. 2020 Aug;584(7819):142-147.
doi: 10.1038/s41586-020-2454-y. Epub 2020 Jul 1.

Wapl repression by Pax5 promotes V gene recombination by Igh loop extrusion

Affiliations

Wapl repression by Pax5 promotes V gene recombination by Igh loop extrusion

Louisa Hill et al. Nature. 2020 Aug.

Abstract

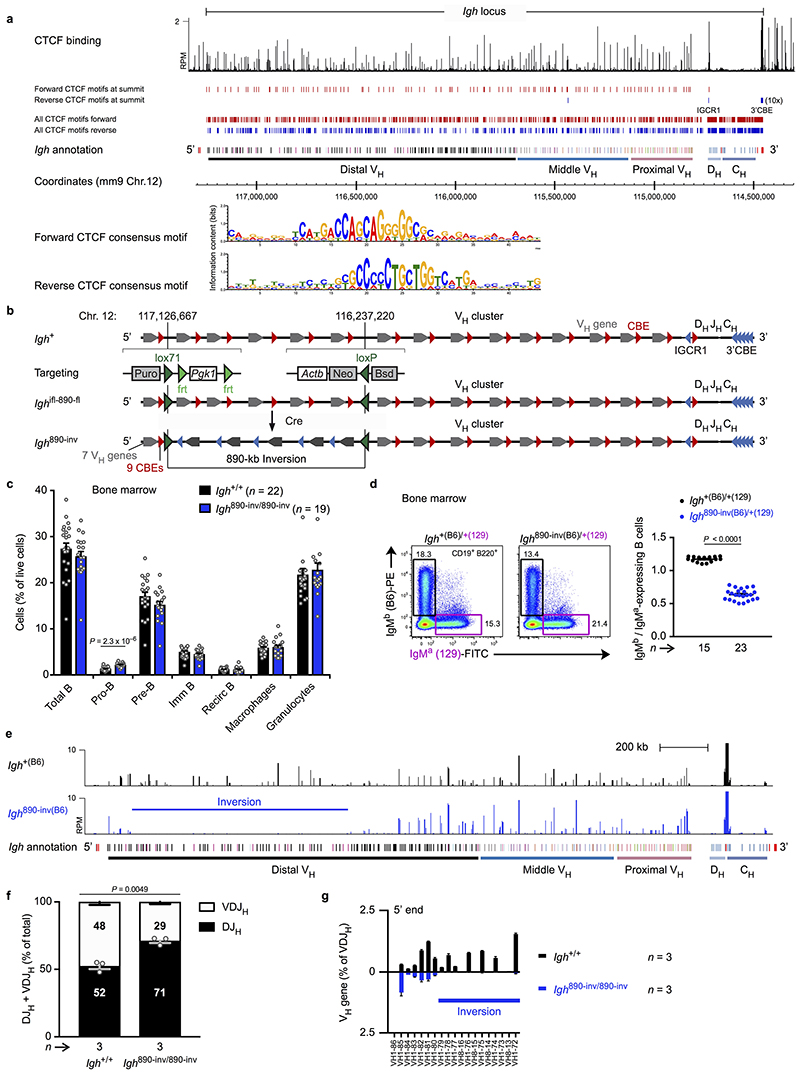
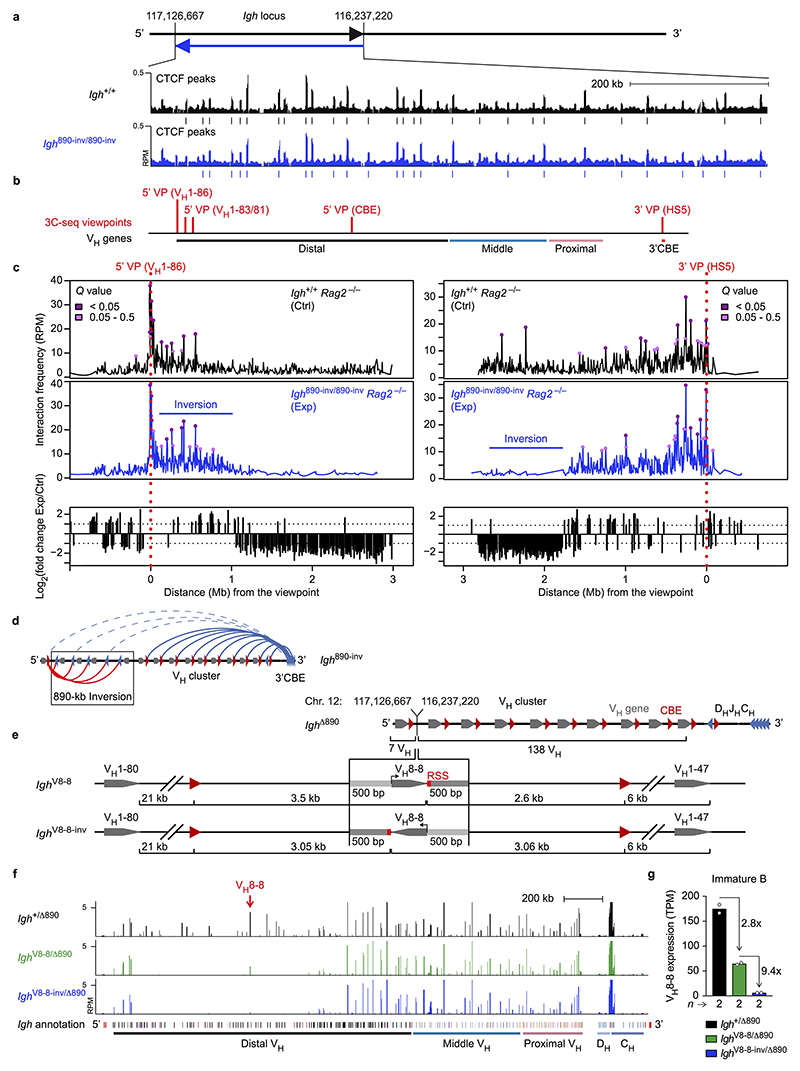
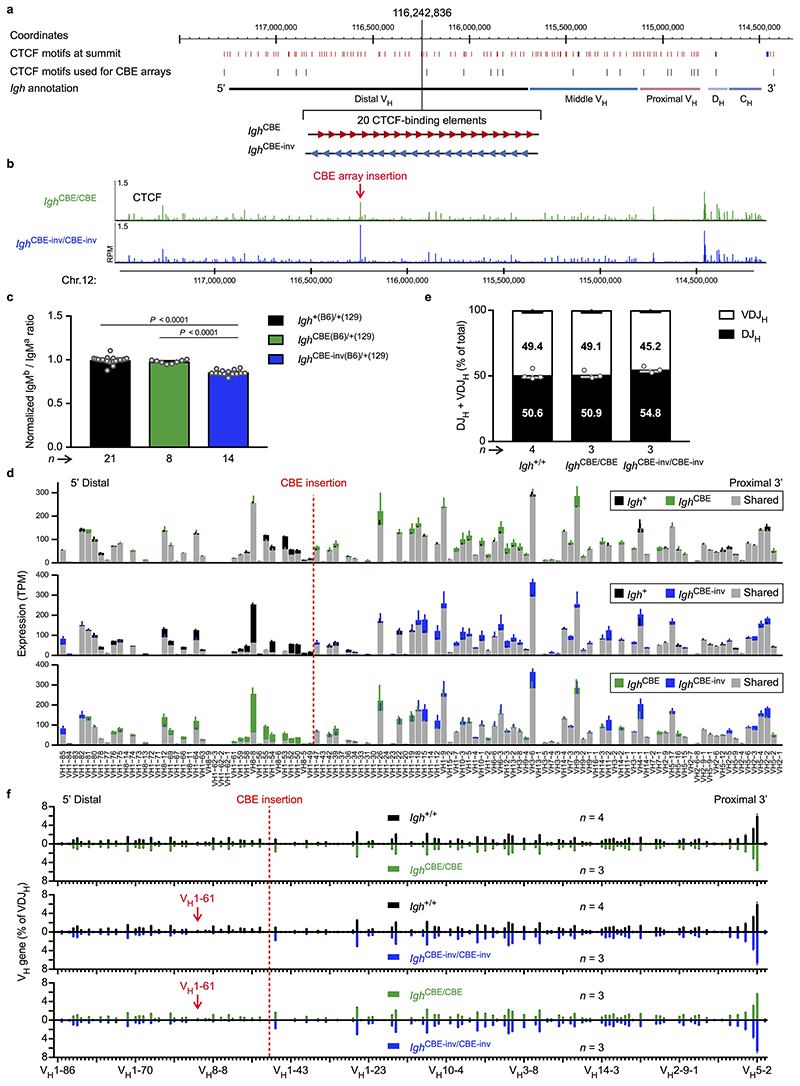
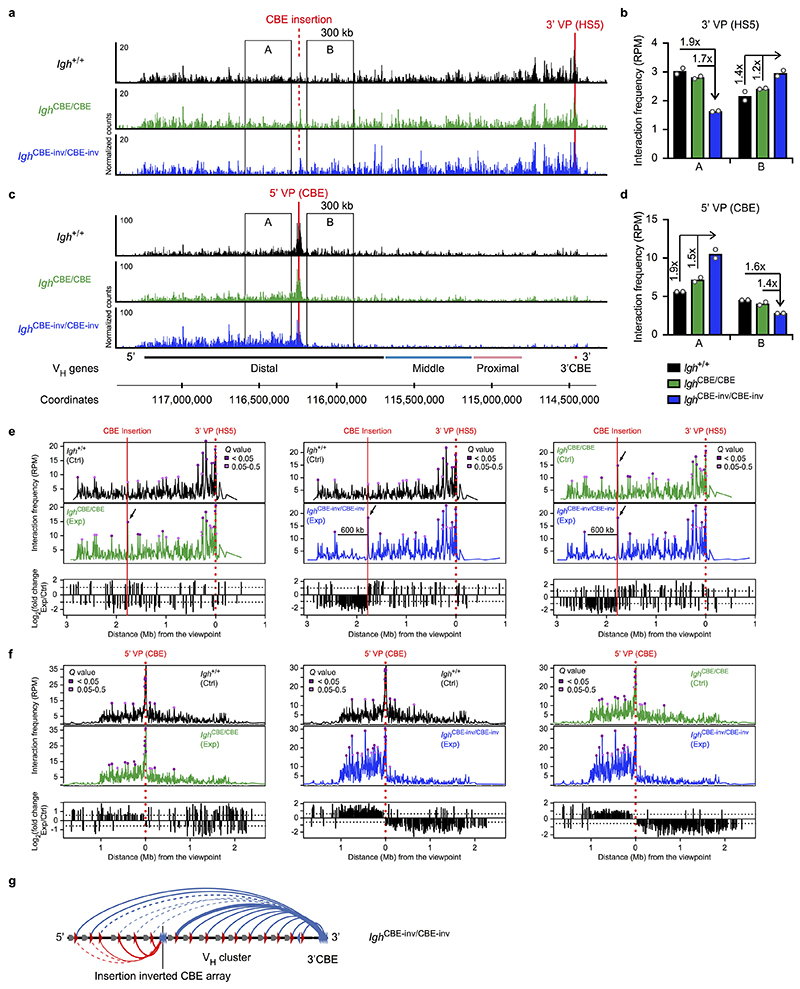
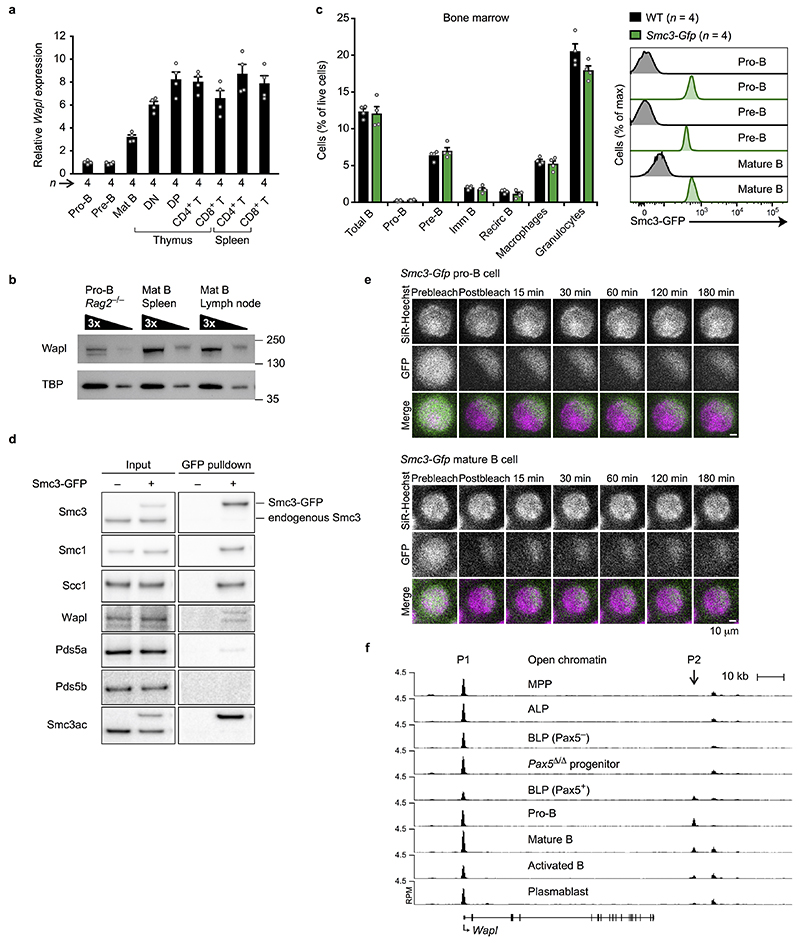
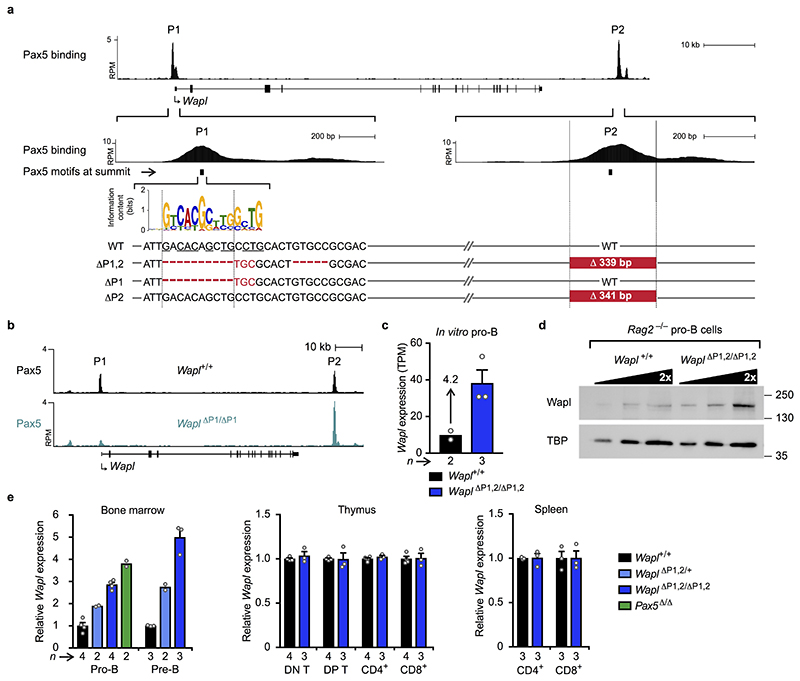
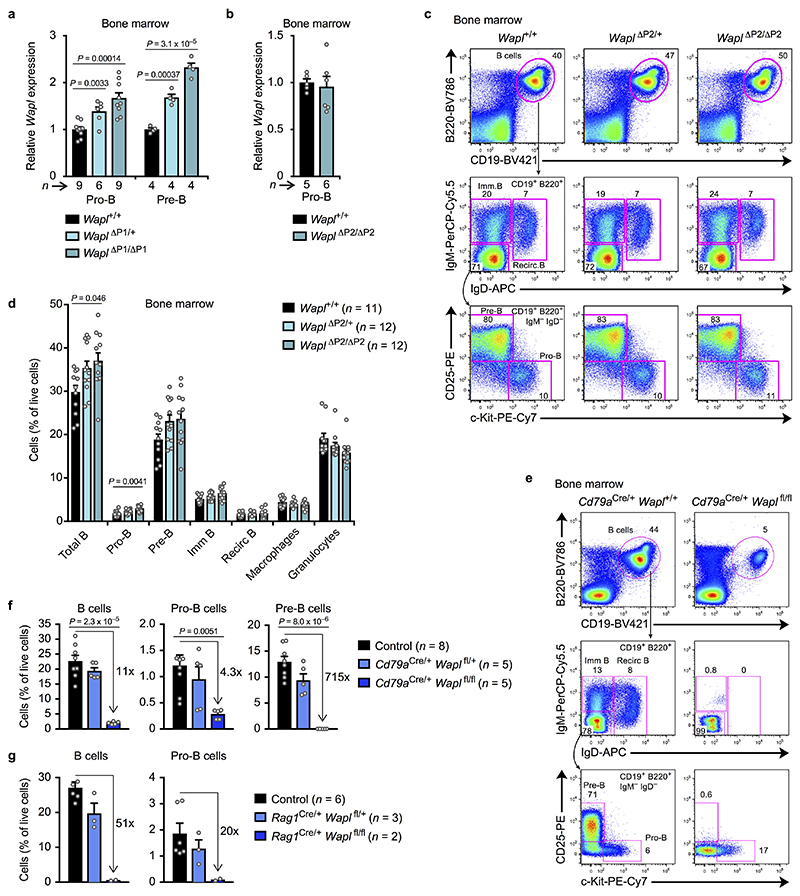
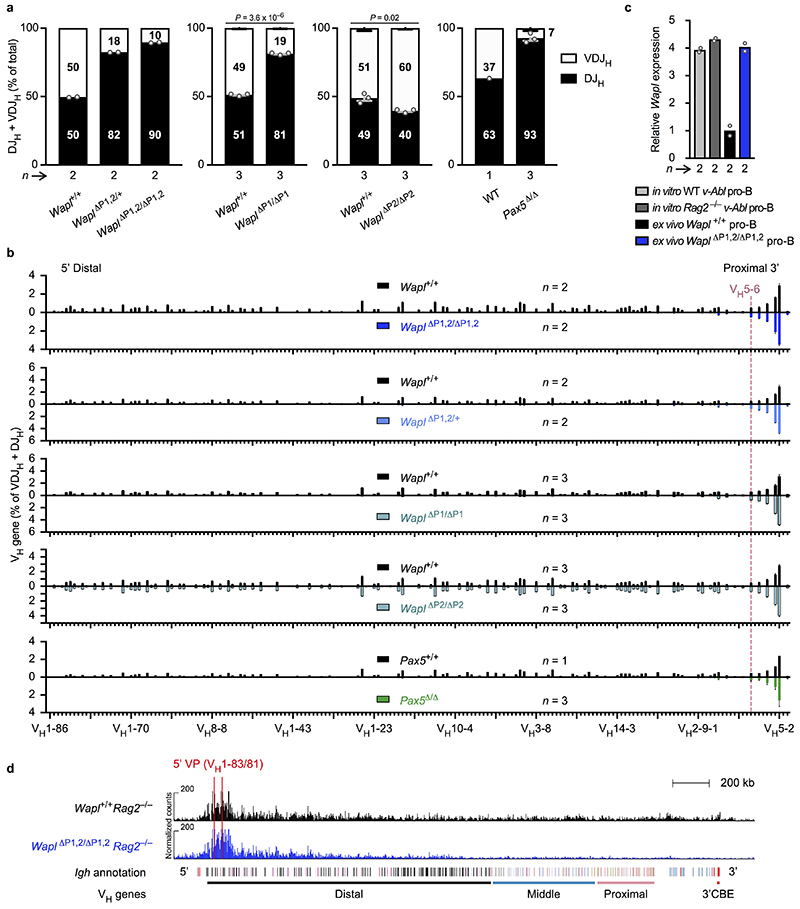
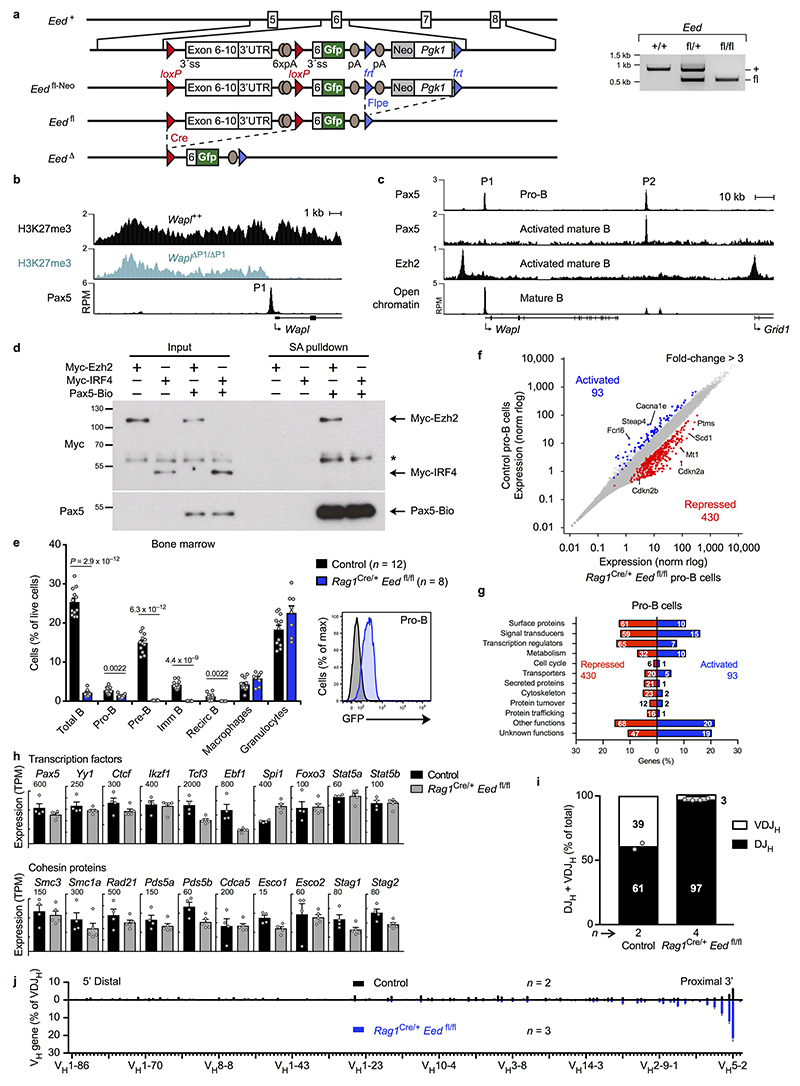
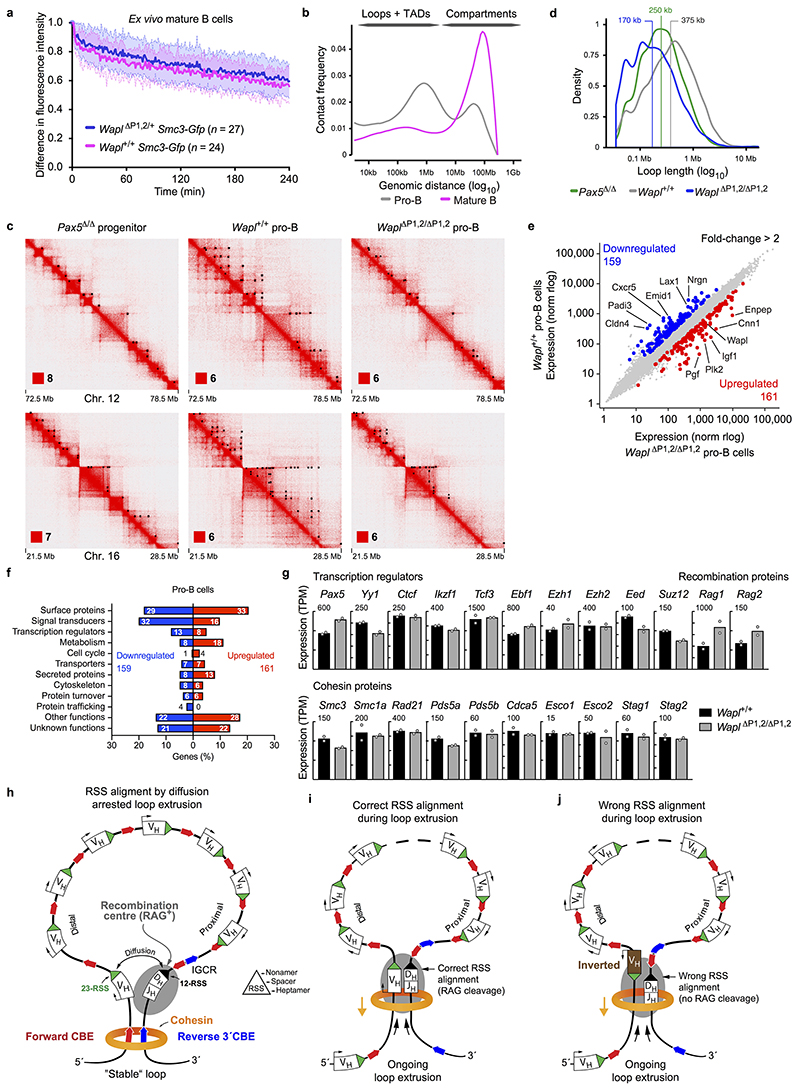
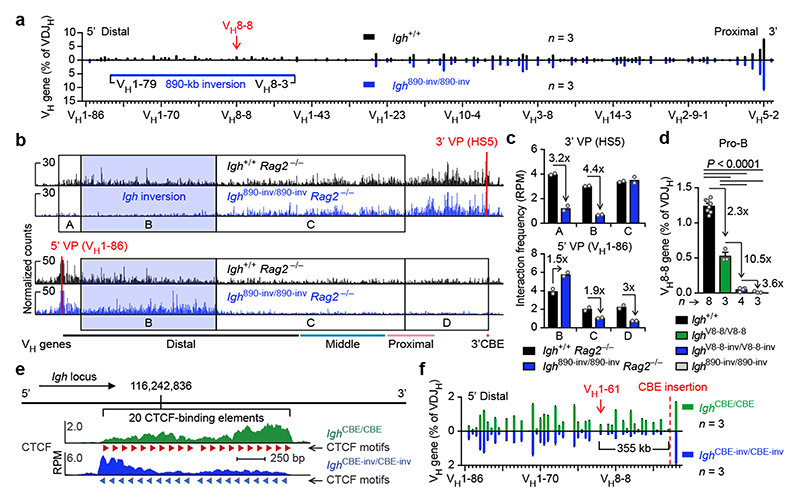
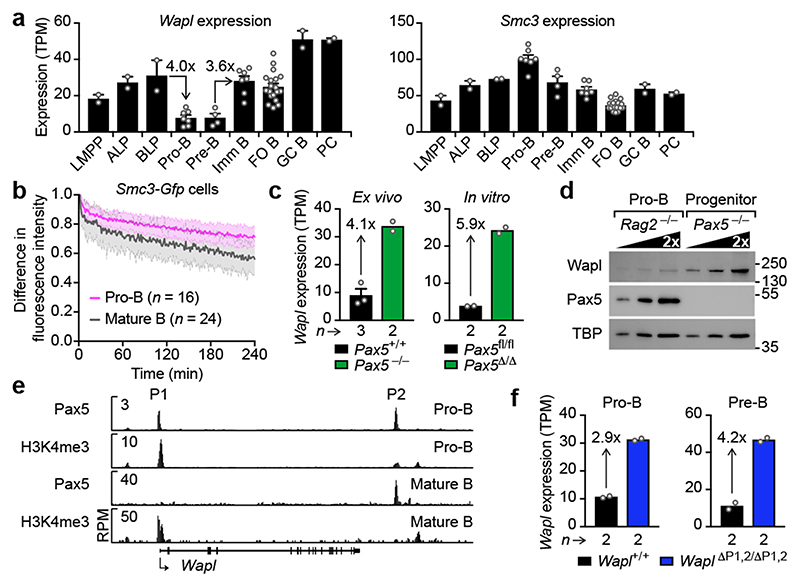
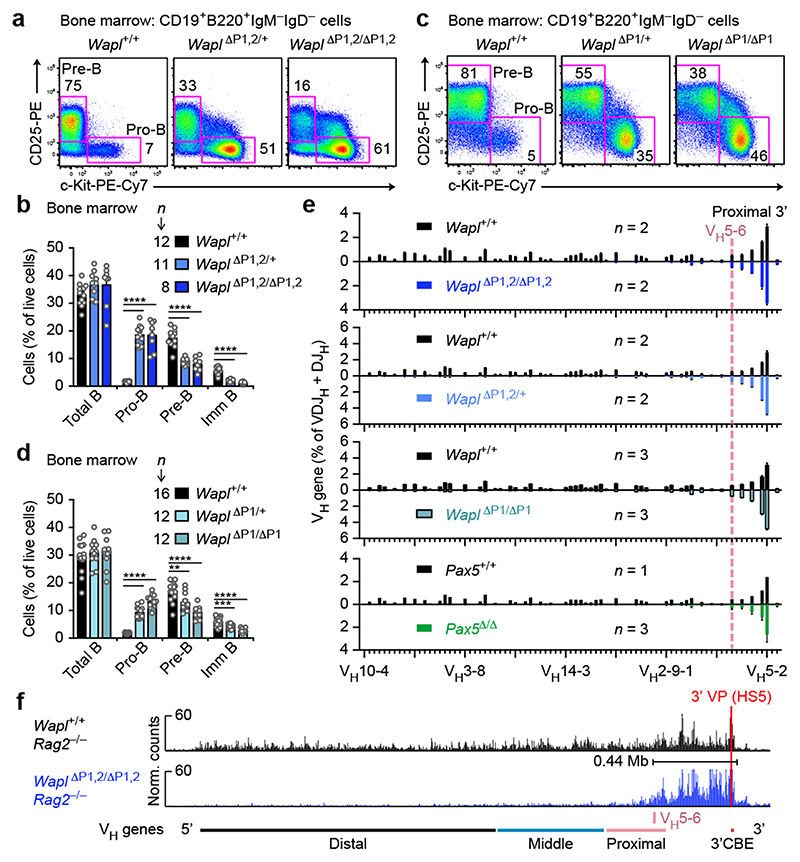
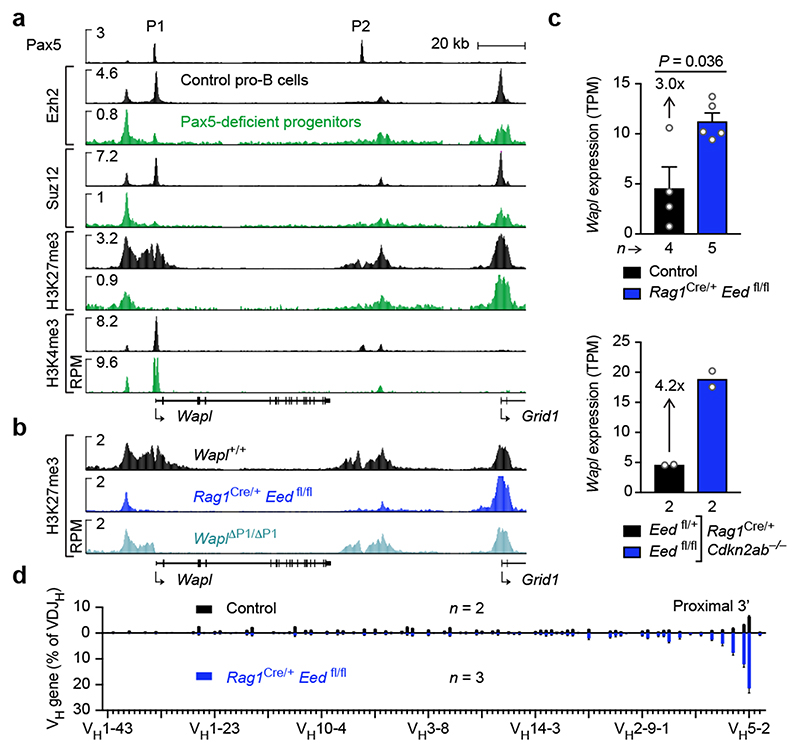
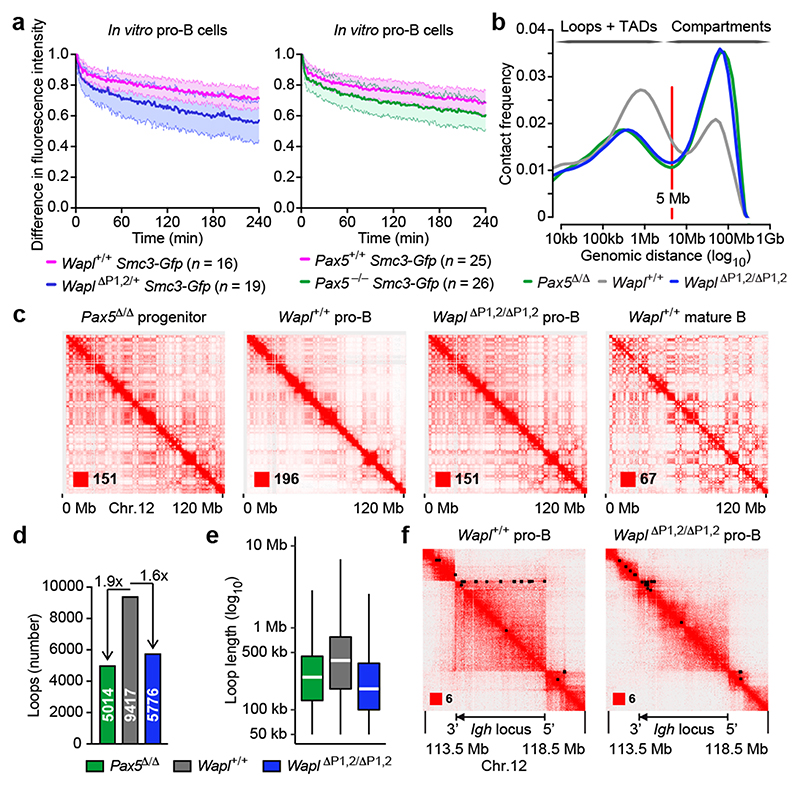
Nuclear processes, such as V(D)J recombination, are orchestrated by the three-dimensional organization of chromosomes at multiple levels, including compartments1 and topologically associated domains (TADs)2,3 consisting of chromatin loops4. TADs are formed by chromatin-loop extrusion5-7, which depends on the loop-extrusion function of the ring-shaped cohesin complex8-12. Conversely, the cohesin-release factor Wapl13,14 restricts loop extension10,15. The generation of a diverse antibody repertoire, providing humoral immunity to pathogens, requires the participation of all V genes in V(D)J recombination16, which depends on contraction of the 2.8-Mb-long immunoglobulin heavy chain (Igh) locus by Pax517,18. However, how Pax5 controls Igh contraction in pro-B cells remains unknown. Here we demonstrate that locus contraction is caused by loop extrusion across the entire Igh locus. Notably, the expression of Wapl is repressed by Pax5 specifically in pro-B and pre-B cells, facilitating extended loop extrusion by increasing the residence time of cohesin on chromatin. Pax5 mediates the transcriptional repression of Wapl through a single Pax5-binding site by recruiting the polycomb repressive complex 2 to induce bivalent chromatin at the Wapl promoter. Reduced Wapl expression causes global alterations in the chromosome architecture, indicating that the potential to recombine all V genes entails structural changes of the entire genome in pro-B cells.


Conflict of interest statement

Competing interests

The authors declare no competing financial interests.

Figures

Extended Data Fig. 1
Extended Data Fig. 1. Generation and characterization of the Igh 890-inv allele.
a, Orientation of the CTCF-binding sites in the Igh locus. The CTCF-binding pattern was determined by ChIP-seq of Rag2 –/– pro-B cells. The locations of forward (red) and reverse (blue) CTCF motifs detected at the summit of the CTCF peaks are shown together with all predicted CTCF motifs, identified based on the forward and reverse consensus CTCF-binding motifs shown. The annotation of the C57BL/6 Igh locus indicates the distinct VH gene families (different colours) in the distal, middle and proximal VH gene regions (Johnston et al. 2006. J. Immunol. 176, 4221-4234) and the 3’ proximal Igh domain containing the DH, JH and CH elements as well as the Eμ and 3’RR enhancers (red). b, Schematic diagram of the Igh ifl-890-fl and Igh 890-inv alleles. The indicated selection cassettes were used for introducing the upstream inverted lox71 site (ifl) and downstream loxP site (fl) by sequential ES cell targeting. c, Flow cytometric analysis of bone marrow cells from Igh 890-inv/890-inv and Igh +/+ mice. The relative frequencies of the indicated cell types (defined in Methods) are shown as mean values with SEM. d, Flow cytometric determination of the ratio of immature IgMb (B6) to IgMa (129) B cells from Igh 890-inv(B6)/+(129) and Igh +(B6)/+(129) mice, which were generated by crossing Igh 890-inv/+ mice on the C57BL/6 (B6) background with Igh +/+ mice of the 129/Sv (129) strain. The rearranged Igh alleles of the C57BL/6 and 129/Sv strains give rise to expression of the IgMb and IgMa isotypes, respectively. e, VH gene expression from the Igh 890-inv(B6) or Igh +(B6) allele in immature IgMb (B6) B cells sorted from Igh 890-inv(B6)/+(129) or Igh +(B6)/+(129) mice, respectively. The RNA-seq profiles are shown with the Igh annotation (see a) and inverted region (bar). One of two experiments is shown. RPM, reads per million mapped sequence reads. f,g VDJ-seq analysis of pro-B cells from the bone marrow of Igh 890-inv/890-inv and Igh +/+ mice. f, The percentages of uniquely identified DJH and VDJH sequences are indicated. g, The relative usage of the distal VH genes at the Igh 5’ end is shown as mean percentage of all VDJH recombination events with SEM. A horizontal bar indicates the 5’ end of the inverted region. Statistical data are shown as mean value with SEM and were analysed either by multiple t-tests (unpaired and two-tailed with Holm-Sidak correction; c,f) or by the Student’s t-test (unpaired and two-tailed; d). n, number of mice (c,d) or experiments (f,g). Each dot corresponds to one mouse.
Extended Data Fig. 2
Extended Data Fig. 2. Dependence of VH-DJH recombination on chromatin looping and VH gene orientation.
a, ChIP-seq analysis of CTCF binding in the distal 890-kb region in short-term cultured pro-B cells from Igh 890-inv/890-inv and Igh +/+ mice. Vertical bars indicated CTCF peaks defined by ‘peak calling’. The ChIP-seq data of the Igh 890-inv allele were aligned on the wild-type Igh sequences. One of two experiments per genotype is shown. b, Igh positions of the 3C-seq viewpoints, which are referred to by the nearest VH gene, the hypersensitive site 5 (HS5) in the 3’CBE region or the CBE array insertion (Supplementary Table 1c). c, Interactions from the 5’ (VH1-86; left) and 3’ (HS5; right) viewpoints in short-term cultured pro-B cells from Igh 890-inv/890-inv Rag2 –/– and Igh +/+ Rag2 –/– mice. The 3C-seq reads along the Igh locus (upper two panels) are shown as RPM values with the respective Q values, which were calculated by the r3Cseq program based on two 3C-seq experiments per genotype. The lower panel shows the fold-change of the RPM values for interaction differences of > 2-fold (dashed line) between experimental (Exp) Igh 890-inv/890-inv Rag2 –/– and control (Ctrl) Igh +/+ Rag2 –/– pro-B cells. d, Schematic diagram summarising the loop formation at the Igh 890-inv allele in pro-B cells. The CBEs with their orientation are indicated by red and blue arrowheads, VH genes by grey arrows and loops by arches. The new loop domain is indicated in red. e, Schematic diagram of the Igh Δ890, Igh V8-8 and Igh V8-8-inv alleles. The Igh V8-8 and Igh V8-8-inv alleles were generated by insertion of the VH8-8 gene with 500 bp of its 5’ and 3’ flanking sequences (lacking any CBE) in the forward or reverse orientation at the deletion point (117,126,667 / 116,237,220; mm9, Chr. 12) of the Igh Δ890 allele (see Methods). The distances from the 3’ end of the VH8-8 gene to the next CBEs and VH genes are indicated. The sequence of the inserted VH8-8 with its flanking DNA sequences is shown in Supplementary Table 1b. f, RNA-seq profile of the Igh locus in immature B cells from the bone marrow of Igh V8-8/Δ890, Igh V8-8-inv/Δ890 and Igh +/Δ890 mice. The VH8-8 gene position and Igh annotation are indicated. The data of one of two RNA-seq experiments per genotype is shown. g, VH8-8 mRNA expression in immature B-cells of the indicated genotypes is shown as mean TPM (transcripts per million) value. Each dot corresponds to one experiment.
Extended Data Fig. 3
Extended Data Fig. 3. Characterization of Igh alleles with inserted CBE arrays.
a, Insertion of an array of 20 functional CBEs in forward (red) or inverted (inv, blue) orientation at position 116,242,836 (mm9, Chr. 12) in the Igh CBE or Igh CBE-inv allele, respectively. The positions of the Igh CBEs used for the generation of the CBE arrays (Supplementary Table 1c) are indicated below a map of all CBEs. b, CTCF binding at the Igh locus, as determined by ChIP-seq analysis of short-term cultured pro-B cells from the bone marrow of Igh CBE-inv/CBE-inv and Igh CBE/CBE mice. One of two experiments is shown. c, Flow cytometric determination of the ratio of immature IgMb (B6) to IgMa (129) B cells in the bone marrow of Igh CBE-inv(B6)/+(129), Igh CBE(B6)/+(129) and Igh +(B6)/+(129) mice (see Extended Data Fig. 1d). The IgMb / IgMa ratios are shown relative to that of immature B cells of Igh +(B6)/+(129) mice (set to 1). Statistical data are shown as mean value with SEM and were analysed by one-way ANOVA with Tukey’s post-hoc test. d, VH gene expression from the Igh CBE-inv(B6), Igh CBE(B6) and Igh +(B6) alleles in immature IgMb (B6) B cells sorted from Igh CBE-inv(B6)/+(129), Igh CBE(B6)/+(129) and Igh +(B6)/+(129) mice, respectively (see Extended Data Fig. 1d). The expression (TPM) value of each VH gene is shown as shared (grey) and unique expression of the Igh CBE-inv(B6) (blue), Igh CBE(B6) (green) and Igh +(B6) (black) alleles. Mean TPM values with SEM were determined by the DESeq2 program and are based on two (Igh CBE-inv(B6), Igh CBE(B6)) and three (Igh +(B6)) RNA-seq experiments. The VH genes are aligned according to their Igh position. e,f, VDJ-seq analysis of ex vivo sorted pro-B cells from the bone marrow of Igh +/+, Igh CBE/CBE and Igh CBE-inv/CBE-inv mice. e, The percentages of uniquely identified DJH and VDJH sequences are shown as mean percentage with SEM. f, Pairwise comparisons of VDJ-seq results obtained with Igh +/+ (black), Igh CBE/CBE (green) and Igh CBE-inv/CBE-inv (blue) pro-B cells. The relative usage of each VH gene was determined as percentage of all VDJH recombination events and is shown as mean percentage with SEM. n, number of mice. Each dot corresponds to one mouse (c,e).
Extended Data Fig. 4
Extended Data Fig. 4. New loop formation upon insertion of an inverted CBE array in the Igh locus.
a-d, 3C-seq analysis of interactions across the Igh locus from the 3’ (HS5; a,b) or 5’ (CBE; c,d) viewpoint in short-term cultured Igh CBE-inv/CBE-inv , Igh CBE/CBE and Igh +/+ pro-B cells. a,c, Mapping of the 3C-seq reads as normalized counts across the Igh locus. One of two experiments per genotype is shown. b,d, Quantification of the interactions from the 3’ (HS5, b) or 5’(CBE, d) viewpoint. The 3C-seq reads in regions A and B were quantified as mean RPM value per region, based on two experiments per genotype. e,f, Interactions from the 3’ (HS5; e) or 5’ (CBE; f) viewpoint in Igh +/+, Igh CBE/CBE and Igh CBE-inv/CBE-inv pro-B cells. The 3C-seq reads along the Igh locus (upper two panels) are shown as RPM values with the respective Q values, calculated by the r3Cseq program based on two experiments per genotype. Arrows highlight a strong interaction from the 3’ viewpoint (HS5) to a region immediately downstream of the inserted CBE array (e), and a bar denotes the 600-kb region exhibiting reduced interactions in Igh CBE-inv/CBE-inv pro-B cells (e). The lower panel shows the fold-change of the RPM values for interaction differences of > 2-fold (dashed line; e) or > 1.5-fold (f) between the experimental (Exp) and control (Ctrl) pro-B cells of the indicated genotypes. g, Schematic diagram summarising the loop formation at the Igh CBE-inv allele in pro-B cells. The CBEs with their orientation are indicated by red and blue arrowheads, VH genes by grey arrows and loops by arches. The new loop domain is indicated in red. A thicker blue arche indicates the enhanced interaction from the 3’CBE to a region immediately downstream of the inserted CBE array.
Extended Data Fig. 5
Extended Data Fig. 5. Cohesin stabilization on chromatin by Pax5-dependent Wapl repression in pro-B cells.
a, Wapl mRNA expression in developing and mature B and T cells of wild-type mice. The indicated B and T cell types were sorted from the bone marrow (pro-B, pre-B cells), thymus (DN, DP, CD4+, CD8+ T cells) or spleen (mature B, CD4+ and CD8+ T cells). The Wapl mRNA expression of the different cell types was determined by RT-qPCR analysis relative to Tbp expression and is shown relative to that of pro-B cells (set to 1). The expression data are shown as mean values with SEM, based on four RT-qPCR experiments per cell type. b, Wapl protein expression in ex vivo sorted Rag2 –/– pro-B cells from the bone marrow and wild-type mature B cells from the spleen and lymph nodes, as determined by immunoblotting of 3-fold serially diluted whole-cell extracts with antibodies detecting Wapl or TBP. One of two experiments is shown with marker proteins (kilodaltons). c, B cell development in the bone marrow of Smc3-Gfp transgenic (green) and wild-type (black) mice, as determined by flow cytometry. The relative frequencies of the indicated cell types are shown as mean values with SEM (left). GFP expression in selected cell types is shown (right). d, Interaction of the Smc3-GFP protein with other cohesin subunits in short-term cultured Smc3-Gfp pro-B cells. Endogenous Smc1, Scc1 (Rad21), Wapl, Pds5a and Pds5b proteins were co-precipitated with Smc3-GFP from whole-cell extracts of Smc3-Gfp or wild-type pro-B cells with an anti-GFP antibody. The input (1/10) and protein precipitate were analysed by immunoblotting with antibodies detecting the indicated cohesin proteins. Smc3ac, acetylated Smc3. One experiment was performed. e, Images of one of 16 or 24 iFRAP experiments performed with Smc3-Gfp pro-B or mature B cells, respectively. The fluorescence intensities of SiR-Hoechst (pink) and GFP (green) are false-coloured. Scale bar, 10 μm. f, Identification of open chromatin regions at the Wapl locus by ATAC-seq of the indicated progenitor and B cell types. MPPs, ALPs, pro-B and mature B cells were sorted from wild-type bone marrow or lymph nodes (mature B). Activated B cells and plasmablasts were generated by in vitro LPS stimulation of mature B cells. hCD2 (Pax5) and hCD2+ (Pax5+) BLPs were sorted from bone marrow of Pax5 ihCd2/ihCd2 mice, and Pax5 Δ/Δ progenitors from Vav-Cre Pax5 fl/fl Rag2 –/– mice. n, number of mice. Each dot corresponds to one mouse (a,c). The different cell types are defined in Methods.
Extended Data Fig. 6
Extended Data Fig. 6. Generation and analysis of Wapl mutant mice.
a, Mutations introduced at the Pax5-binding sites P1 and P2 in the Wapl ΔP1,2, Wapl ΔP1 and Wapl ΔP2 alleles by CRISPR/Cas9-mediated mutagenesis. The consensus Pax5 motif and the extent of the deletions (red) are indicated. b, Loss of Pax5 binding at the mutated P1 site in Wapl ΔP1/ΔP1 pro-B cells. One of two ChIP-seq experiments is shown. c. Wapl mRNA expression in short-term cultured Wapl ΔP1,2/ΔP1,2 and Wapl +/+ pro-B cells is shown as mean TPM value with SEM. n, number of RNA-seq experiments. d, Wapl protein expression in short-term cultured Wapl ΔP1,2/ΔP1,2 Rag2 –/– and Wapl +/+ Rag2 –/– pro-B cells was determined by immunoblotting of 2-fold serially diluted whole-cell extracts with antibodies detecting Wapl or TBP. One of two experiments is shown with marker proteins (kilodaltons). e, Wapl mRNA expression in ex vivo sorted Wapl ΔP1,2/ΔP1,2 (blue), Wapl ΔP1,2/+ (light blue) and Wapl +/+ (black) pro-B and pre-B cells, Pax5 Δ/Δ progenitors (green; Vav-Cre Pax5 fl/fl) as well as Wapl ΔP1,2/ΔP1,2 and Wapl +/+ T cell subsets from the thymus and spleen, as determined by RT-qPCR analysis relative to Tbp expression. The Wapl expression of each cell type is indicated relative to that of the Wapl +/+ cells (set to 1) and is shown as mean value with SEM, based on 2-4 independent RT-qPCR experiments for each cell type and genotype. Each dot (c,e) corresponds to one mouse. The different cell types are defined in Methods.
Extended Data Fig. 7
Extended Data Fig. 7. B cell development in Wapl mutant mice.
a,b, Wapl expression in ex vivo sorted Wapl ΔP1/ΔP1 (blue), Wapl ΔP1/+ (light blue) and Wapl +/+ (black) pro-B and pre-B cells (a) as well as in Wapl ΔP2/ΔP2 (blue) and Wapl +/+ (black) pro-B cells (b), as determined by RT-qPCR analysis relative to Tbp expression. The Wapl expression of each cell type is shown as mean value with SEM relative to that of Wapl +/+ cells (set to 1). Each dot corresponds to one RT-qPCR experiment performed with sorted cells from one mouse. c,d, Flow cytometric analysis of bone marrow from Wapl ΔP2/ΔP2 (blue), Wapl ΔP2/+ (light blue) and Wapl +/+ (black) mice (c). The frequencies of the indicated cell types are shown as mean values with SEM (d). e, Flow cytometric analysis of bone marrow from Cd79a Cre/+ Wapl fl/fl and Cd79a Cre/+ Wapl +/+ mice. f,g, Frequencies of total B, pro-B and pre-B cells are shown for Cd79a Cre/+ Wapl fl/fl, Cd79a Cre/+ Wapl fl/+ and control mice (f) as well as for Rag1 Cre/+ Wapl fl/fl, Rag1 Cre/+ Wapl fl/+ and control mice (g). The control mice in (f) were 3× Cd79a Cre/+ Wapl +/+ and 5× Wapl fl/+ mice, and the control mice in (g) were 2× Rag1 Cre/+ Wapl +/+, 2× Wapl fl/fl, 1× Wapl fl/+ and 1× Wapl +/+. Statistical data (a,b,d,f,g) are shown as mean values with SEM and were analysed by multiple t-tests (unpaired and two-tailed with Holm-Sidak correction). One of 5 (c) or 4 (e) experiments is shown. n, number of mice. Each dot corresponds to one mouse.
Extended Data Fig. 8
Extended Data Fig. 8. VH-DJH recombination and looping in Wapl mutant mice.
a, VDJ-seq analysis of Igh rearrangements in Wapl ΔP1,2/ΔP1,2, Wapl ΔP1,2/+, Wapl ΔP1/ΔP1, Wapl ΔP2/ΔP2 and Wapl +/+ pro-B cells as well as in Pax5 Δ/Δ progenitors (Vav-Cre Pax5 fl/fl), which were performed in 4 different experimental series. The percentages of uniquely identified DJH and VDJH sequences are shown as mean values with SEM and were analysed by multiple t-tests (unpaired and two-tailed with Holm-Sidak correction). b, VH gene recombination in Wapl +/+ and mutant pro-B-cells, as determined by pairwise VDJ-seq experiments. The VDJ-seq data of Wapl +/+ and mutant pro-B-cells are shown in the upper and lower part, respectively. The VH gene usage is shown as mean percentage of all DJH and VDJH rearrangement events with SEM. c, Wapl mRNA expression in in vitro cultured v-Abl transformed pro-B cells of the wild-type (light grey) or Rag2 –/– (grey) genotype as well as in ex vivo sorted Wapl ΔP1,2/ΔP1,2 (blue) and wild-type Wapl +/+ (black) pro-B cells. The Wapl expression was determined by RT-qPCR analysis relative to the Tbp expression and is shown a mean value relative to that of the Wapl +/+ pro-B cells (set to 1). d, 3C-seq analysis of interactions across the Igh locus from the 5’ viewpoints (VH1-83/81) in short-term cultured Wapl ΔP1,2/ΔP1,2 Rag2 –/– and Wapl +/+ Rag2 –/– pro-B cells. The 3C-seq reads are mapped as normalized counts. One of two experiments is show. n, number of experiments. Each dot corresponds to one mouse.
Extended Data Fig. 9
Extended Data Fig. 9. Generation and analysis of conditional Eed mutant mice.
a, Generation of a floxed (fl) Eed allele. The Eed fl-Neo allele was generated by replacing exon 6 of the Eed gene with the following sequences in the 5’ to 3’ direction: (i) a loxP-flanked Eed cDNA fragment (from exon 6 to the 5’ part of the 3’UTR) linked to six copies of the SV40 polyadenylation (pA) region, (ii) a DNA fragment containing the 3’ splice site and 5’ sequences of exon 6 fused in-frame to the coding sequence of Gfp followed by an SV40 pA sequence and (iii) a frt-flanked DNA fragment containing the mouse phosphoglycerate kinase 1 (Pgk1) promoter linked to the neomycin (Neo) resistance gene. Brackets indicate the two homology regions used for ES cell recombination. The frt (blue) and loxP (red) sites (arrowheads) of the Eed fl-Neo allele were used to generate the Eed fl and Eed Δ alleles by sequential Flpe- and Cre-mediated deletion in vivo. The six SV40 pA sequences downstream of the last Eed exon prevented RNA splicing to the Gfp exon prior to Cre-mediated deletion, as demonstrated by flow cytometry (e, right). A genotyping gel image of Eed +/+, Eed fl/+, and Eed fl/fl mice is shown to the right. b, Selective loss of H3K27me3 at the Wapl promoter in Wapl ΔP1/ΔP1 pro-B cells (light blue) compared to Wapl +/+ pro-B cells (black). The H3K27me3 signal is precipitously lost 220 bp upstream of the P1 site. One of two ChIP-seq experiments are shown. c, Loss of Ezh2 and Pax5 binding at the Wapl promoter in mature B cells after two days of activation. d, Co-precipitation of Myc-tagged Ezh2 or IRF4 by streptavidin (SA) pulldown of biotinylated Pax5-Bio from nuclear extracts prepared from HEK-293T cells that were transiently transfected with expression vectors encoding Pax5-Bio-IRES-BirA, Myc-Ezh2, Eed and Suz12 or Pax5-Bio-IRES-BirA and Myc-IRF4. The input (1/100) and protein precipitates were analysed by immunoblotting with antibodies detecting Myc and Pax5. The band indicated by an asterisk may correspond to endogenous Myc. One of four experiments is shown with marker proteins (kilodaltons). e, Flow cytometric analysis of bone marrow from Rag1 Cre/+ Eed fl/fl (blue) and control (black) mice. Rag1 Cre/+ Eed fl/+, Rag1 Cre/+, Eed fl/+ and Eed +/+ mice were used as control. The relative frequencies of the indicated cell types (left), which were determined in six experiments, are shown as mean values with SEM and were analysed by multiple t-tests (unpaired and two-tailed with Holm-Sidak correction). GFP expression (right) is shown for Rag1 Cre/+ Eed fl/fl pro-B cells in contrast to control Eed fl/+ pro-B cells. f, Scatterplot of gene expression differences between Eed-deficient and control pro-B cells. Eed-activated (blue) and Eed-repressed (red) genes were defined by an expression difference of > 3-fold, an adjusted P value of < 0.05 and a TPM value of > 5 in Eed-deficient or control pro-B cells, respectively (Supplementary Table 2). The expression data are based on 5 (Rag1 Cre/+ Eed fl/fl) and 4 (control; 3× Rag1 Cre/+ Eed fl/+, 1× Eed fl/fl) RNA-seq experiments. g, Functional classification and quantification of the proteins encoded by Eed-activated and Eed-repressed genes (Supplementary Table 2). The bar size indicates the percentage of activated or repressed genes in each functional class relative to the total activated or repressed genes, respectively. Numbers in the bars refer to the genes in each functional class. h, Expression of selected genes in Eed-deficient (grey) and Eed-expressing (black) pro-B cells. The expression of the indicated genes, which are not differentially expressed according to the definition in f, is shown as mean TPM value with SEM. i,j, VDJ-seq analysis of Rag1 Cre/+ Eed fl/fl and control pro-B cells. i, The mean percentages of uniquely identified DJH and VDJH sequences were determined based on 4 (Rag1 Cre/+ Eed fl/fl) and 2 (control; 1× Eed fl/+, 1× Eed +/+) experiments. j, The VH gene usage is shown as mean percentage of all VDJH rearrangement events with SEM. n, number of experiments. Each dot corresponds to one mouse (e,h,i) or one gene (f).
Extended Data Fig. 10
Extended Data Fig. 10. Changes of chromosomal architecture and gene expression in Wapl +/+ and Wapl ΔP1,2/ΔP1,2 pro-B cells.
a, iFRAP analysis of splenic mature B cells from Wapl ΔP1,2/+ (blue) and Wapl +/+ (pink) mice carrying the Smc3-Gfp transgene. The difference in fluorescence intensity between bleached and unbleached regions is plotted against time. The mean values are indicated by lines and the SD by shading. n, number of cells analysed in three experiments per genotype. b, Frequency distribution of intra-chromosomal contacts as a function of the genomic distance using logarithmically increased genomic distance bins, as determined by Homer analysis of Hi-C data generated with short-term cultured pro-B cells (grey) and ex vivo sorted splenic mature B cells (pink) from wild-type mice. c, Hi-C contact matrices of a zoomed-in region on chromosome 12 (mm9: 72,500,000-78,500,000; upper row) and 16 (21,500,000-28,500,000; lower row), displayed at a 10-kb bin resolution for Pax5 Δ/Δ progenitors, Wapl +/+ and Wapl ΔP1,2/ΔP1,2 pro-B cells. Black dots indicate loop anchors identified with Juicebox, and the intensity of each pixel represents the normalized number of contacts between a pair of loci (Durand et al. 2016. Cell Syst. 3, 95-98). The maximum intensity is indicated in the lower left of each panel. d, Density distribution of the loop length in Pax5 Δ/Δ progenitors, Wapl +/+ and Wapl ΔP1,2/ΔP1,2 pro-B cells, as determined with HiCCUPS of Juicer. The median loop length (in kb) is shown for each genotype. e, Scatterplot of gene expression differences, based on two RNA-seq experiments per genotype. Genes upregulated (red) or downregulated (blue) in Wapl ΔP1,2/ΔP1,2 pro-B cell compared to Wapl +/+ pro-B cells were defined by an expression difference of > 2-fold, an adjusted P value of < 0.05 and a TPM value of > 5 in at least one of the two pro-B cell types (Supplementary Table 3). f, Functional classification and quantification of the proteins encoded by up-regulated (red) and down-regulated (blue) genes in Wapl ΔP1,2/ΔP1,2 pro-B cells relative to Wapl +/+ pro-B cells (Supplementary Table 3). See Extended Data Fig. 9g for detailed explanation. g, Expression of selected genes in Wapl ΔP1,2/ΔP1,2 (grey) and Wapl +/+ (black) pro-B cells. The expression of the indicated genes, which are not differentially expressed according to the definition in e, is shown as mean TPM value. h, Schematic diagram depicting a ‘stable’ loop formed by loop extrusion across the entire Igh locus in pro-B cells. The forward CBEs (in the VH gene cluster and IGCR region) and the reverse CBEs (in the IGCR and 3’CBE regions) are indicated by red and blue arrows, respectively. The RAG-bound recombination centre, which is located at the DJH-rearranged gene segment (Ji et al. 2010. Cell 141, 419-431), is indicated in grey. The convergent orientation of the 12-RSS (recognition signal sequence with a 12-bp spacer, black arrowhead) of the DH segment and the 23-RSS (with a 23-bp spacer, green arrowhead) of the VH genes is essential for mediating RAG-cleavage and deletional joining (Alt et al. 2013. Cell 152, 417-429). The loop-extruding cohesin ring (orange) is arrested at convergent CBEs. In a ‘stable’ loop, the correct alignment of the RSS elements of a VH gene and the DJH-rearranged gene segment likely occurs by local diffusion. Arrowheads symbolize the RSS element consisting of the heptamer, nonamer and intervening spacer. i, Correct alignment of the RSS elements of a VH gene and the DJH-rearranged gene segment may be mediated by the ongoing process of loop extrusion. Orange and black arrows indicate the direction of movement of cohesin and DNA, respectively. j, Misalignment of the RSS elements of an inverted VH gene and the DJH-rearranged gene segment during loop extrusion, which prevents RAG-mediated cleavage.
Fig. 1
Fig. 1. Inversion of an 890-kb Igh region and insertion of inverted CBEs interfere with VH gene recombination.
a, VDJ-seq analysis of Igh 890-inv/890-inv bone marrow pro-B-cells. VH gene usage is shown as mean percentage (with SEM) of all VDJH recombination events in Igh +/+ or Igh 890-inv/890-inv pro-B-cells. The VH genes (Supplementary Table 1a) are aligned according to their Igh position. b, 3C-seq analysis of interactions from a 3’ viewpoint (HS5) or 5’ viewpoint (VH1-86) in short-term cultured Igh 890-inv/890-inv Rag2 –/– and Igh +/+ Rag2 –/– pro-B-cells. Normalized counts of the 3C-seq reads are plotted. One of two 3C-seq experiments is shown. c, Quantification of interactions. The 3C-seq reads in regions A-D (b) were quantified as mean RPM value per region for each viewpoint. RPM, reads per million mapped sequence reads. d, VDJ-seq analysis of the VH8-8 recombination frequency in pro-B-cells of the indicated genotypes. e, CTCF binding at an array of 20 CBEs, inserted at position 116,242,836 (mm9, chromosome 12) in forward (Igh CBE /CBE) or reverse (Igh CBE-inv/CBE-inv) orientation, as determined by ChIP-seq (Extended Data Fig. 3b). f, VDJ-seq analysis of VH gene recombination at the Igh 5’ end in Igh CBE/CBE and Igh CBE-inv/CBE-inv pro-B-cells. Statistical data in d were analysed by one-way ANOVA with Tukey’s post-hoc test. n, number of experiments. Each dot corresponds to one mouse (c,d).
Fig. 2
Fig. 2. Pax5-dependent repression of Wapl in pro-B and pre-B-cells.
a, Expression of Wapl and Smc3 in developing B-cells. RNA-seq expression data for the indicated cell types (Methods) are shown as mean TPM values with SEM. LMPP, lymphoid-primed multipotent progenitors; ALP, all-lymphoid progenitors; BLP, B-cell-biased lymphoid progenitors; FO and GC B, follicular and germinal centre B-cells; PC, plasma cells. For experiment numbers see source data. b, iFRAP analysis of short-term cultured bone marrow pro-B-cells and ex vivo sorted splenic mature B-cells from Smc3-Gfp transgenic mice. The difference in fluorescence intensity between bleached and unbleached regions is plotted against time. The mean values are indicated by lines and the SD by shading. n, number of cells analysed. c, Wapl expression in ex vivo sorted and in vitro cultured pro-B-cells of the indicated genotypes. d, Wapl expression in cultured Pax5 –/– progenitors and Rag2 –/– pro-B-cells, determined by immunoblotting of whole-cell extracts with antibodies detecting Wapl, Pax5 or TBP. One of two experiments is shown with marker proteins (kilodaltons). e, Detection of Pax5 binding and H3K4me3 at the Wapl locus in bone marrow pro-B-cells and splenic mature B-cells by ChIP-seq. The Pax5 peaks P1 and P2 are indicated. One of two experiments is shown. f, Wapl expression in pro-B and pre-B-cells of Wapl ΔP1,2/ΔP1,2 and Wapl +/+ mice is shown as mean TPM values. n, number of RNA-seq experiments (c,f).
Fig. 3
Fig. 3. The Pax5-binding site at the Wapl promoter controls loop extrusion and VH-DJH recombination.
a-d, Flow cytometric analysis of B-cell development in the bone marrow of the indicated genotypes. The percentage of pro-B and pre-B-cells is indicated for one of five experiments (a,c), and the relative frequencies of the indicated cell types are shown as mean values with SEM (b,d). e, VH gene recombination in Wapl +/+ and mutant pro-B-cells, determined by pairwise VDJ-seq experiments. The VDJ-seq data of Wapl +/+ and mutant pro-B-cells are shown in the upper and lower part, respectively. The VH gene usage is shown as mean percentage of all DJH and VDJH rearrangement events with SEM. f, 3C-seq analysis of interactions from the 3’ viewpoint (HS5) in Wapl ΔP1,2/ΔP1,2 Rag2 –/– and Wapl +/+ Rag2 –/– pro-B-cells. The 0.44-Mb proximal loop domain and the position of the VH5-6 gene are indicated. One of two 3C-seq experiments is shown. Statistical data in b and d were analysed by multiple t-tests (unpaired and two-tailed with Holm-Sidak correction); **P < 0.01; ***P < 0. 001; ****P < 0.0001. n, number of mice (b,d) or experiments (e). Each dot (b,d) corresponds to one mouse.
Fig. 4
Fig. 4. Pax5-mediated recruitment of PRC2 to the Wapl promoter facilitates VH-DJH recombination.
a, Epigenetic landscape at the Wapl locus in Pax5-deficient progenitors and Pax5-expressing control pro-B-cells. Binding of Pax5, Ezh2 and Suz12 and the presence of H3K4me3 and H3K27me3 were determined by ChIP-seq. One of two experiments per genotype and antibody is shown. b, Selective loss of H3K27me3 at the Wapl promoter in Rag1 Cre/+ Eed fl/fl and Wapl ΔP1/ΔP1 pro-B-cells. One of two experiments per genotype is shown. c, Wapl mRNA expression in ex vivo sorted pro-B-cells from mice of the indicated genotypes, as shown by mean TPM values. The P value and SEM (c, top) were determined by DESeq2. d, VDJ-seq analysis of pro-B-cells from Rag1 Cre/+ Eed fl/fl or control mice. The VH gene usage is shown as mean percentage of all VDJH rearrangement events with SEM. n, number of experiments.
Fig. 5
Fig. 5. Pax5-dependent changes of the entire chromatin architecture in pro-B-cells.
a, iFRAP analysis of short-term cultured bone marrow pro-B-cells from Wapl ΔP1,2/+, Pax5 –/– and wild-type mice carrying the Smc3-Gfp transgene, as described in Fig. 2b. n, number of cells analysed. b, Frequency distribution of intra-chromosomal contacts as a function of the genomic distance using logarithmically increased genomic distance bins, as determined by HOMER analysis of Hi-C data generated with short-term cultured Pax5 Δ/Δ progenitors, Wapl +/+ pro-B-cells and Wapl ΔP1,2/ΔP1,2 pro-B-cells. c, Hi-C contact matrices of chromosome 12 determined for Pax5 Δ/Δ progenitors, Wapl +/+ and Wapl ΔP1,2/ΔP1,2 pro-B-cells and ex vivo sorted Wapl +/+ mature B-cells, plotted at 250-kb bin resolution with Juicebox. The intensity of each pixel represents the normalized number of contacts between a pair of loci with the maximum intensity being indicated in the lower left corner. d, Number of chromatin loops (with a length of < 5 Mb) identified in Pax5 Δ/Δ progenitors, Wapl +/+ and Wapl ΔP1,2/ΔP1,2 pro-B-cells with HiCCUPS. e, Distribution of the loop length. The median (white lines), middle 50% of the data (boxes) and all values of 1.5× interquartile range (whiskers) are shown. f, Hi-C contact matrices of the Igh region. Black dots indicate loop anchors. Two Hi-C experiments per genotype were performed except for mature B-cells (one experiment).

References

    1. Lieberman-Aiden E, et al. Comprehensive mapping of long-range interactions reveals folding principles of the human genome. Science. 2009;326:289–293. - PMC - PubMed
    1. Dixon JR, et al. Topological domains in mammalian genomes identified by analysis of chromatin interactions. Nature. 2012;485:376–380. - PMC - PubMed
    1. Nora EP, et al. Spatial partitioning of the regulatory landscape of the X-inactivation centre. Nature. 2012;485:381–385. - PMC - PubMed
    1. Rao SS, et al. A 3D map of the human genome at kilobase resolution reveals principles of chromatin looping. Cell. 2014;159:1665–1680. - PMC - PubMed
    1. Nasmyth K. Disseminating the genome: joining, resolving, and separating sister chromatids during mitosis and meiosis. Annu Rev Genet. 2001;35:673–745. - PubMed

Publication types

MeSH terms