

Citalopram-induced pathways regulation and tentative treatment-outcome-predicting biomarkers in lymphoblastoid cell lines from depression patients
- PMID: 32612257
- PMCID: PMC7329820
- DOI: 10.1038/s41398-020-00900-8
Citalopram-induced pathways regulation and tentative treatment-outcome-predicting biomarkers in lymphoblastoid cell lines from depression patients
Abstract
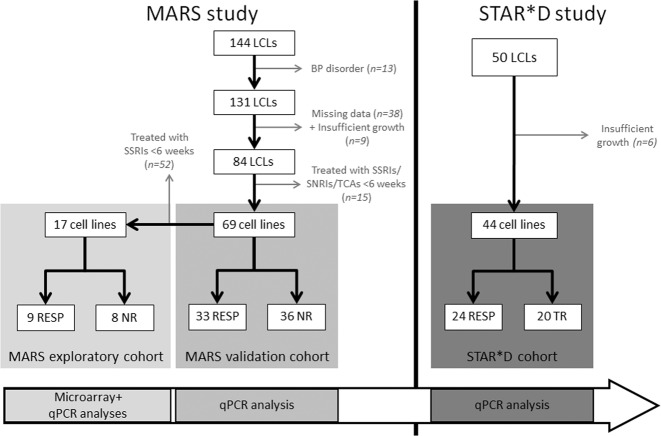
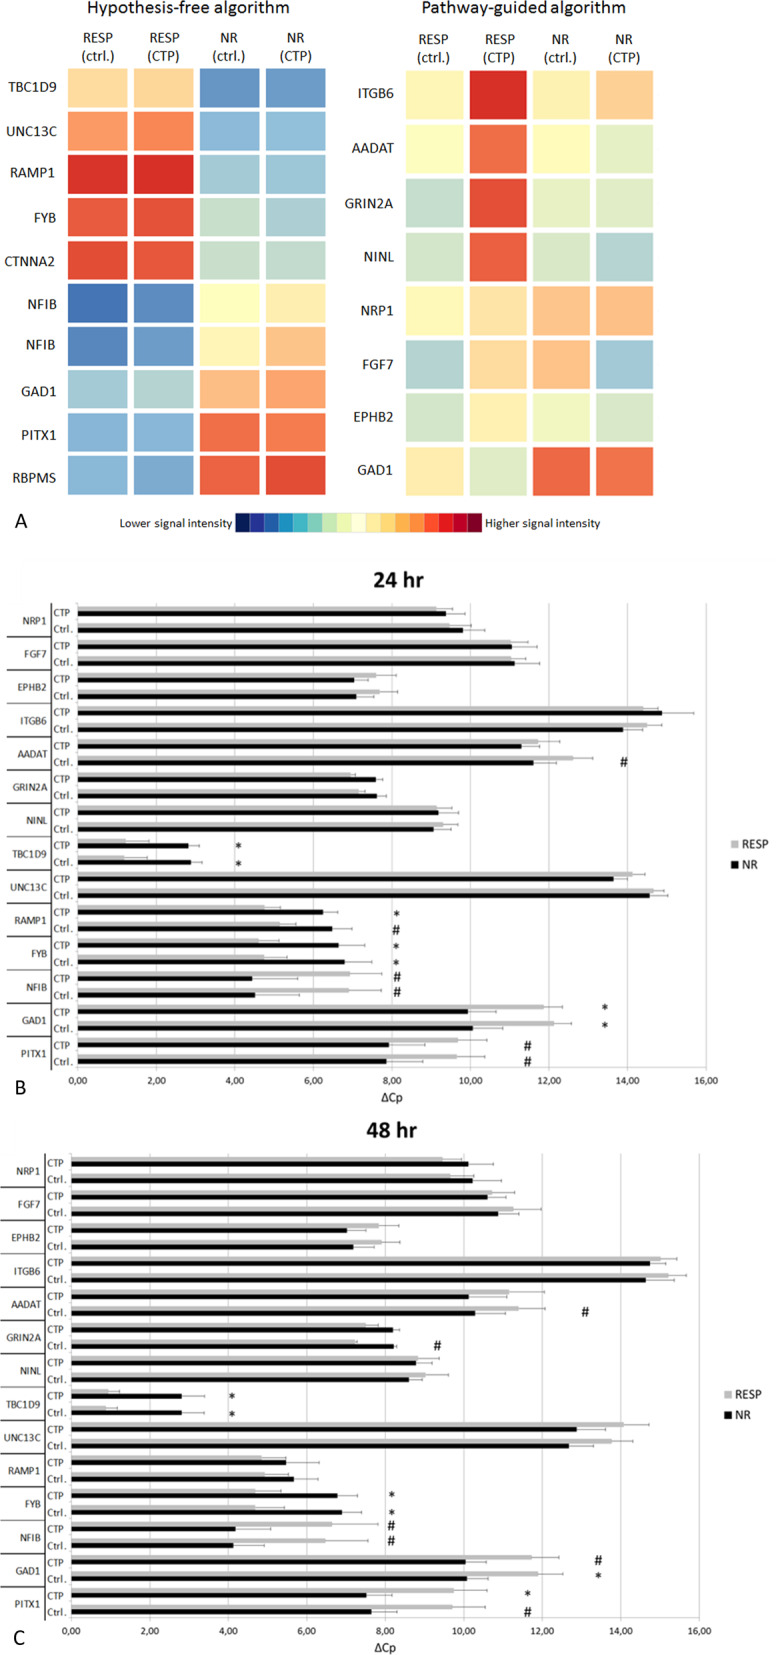
Antidepressant therapy is still associated with delays in symptomatic improvement and low response rates. Incomplete understanding of molecular mechanisms underlying antidepressant effects hampered the identification of objective biomarkers for antidepressant response. In this work, we studied transcriptome-wide expression followed by pathway analysis in lymphoblastoid cell lines (LCLs) derived from 17 patients documented for response to SSRI antidepressants from the Munich Antidepressant Response Signatures (MARS) study upon short-term incubation (24 and 48 h) with citalopram. Candidate transcripts were further validated with qPCR in MARS LCLs from responders (n = 33) vs. non-responders (n = 36) and afterward in an independent cohort of treatment-resistant patients (n = 20) vs. first-line responders (n = 24) from the STAR*D study. In MARS cohort we observed significant associations of GAD1 (glutamate decarboxylase 1; p = 0.045), TBC1D9 (TBC1 Domain Family Member 9; p = 0.014-0.021) and NFIB (nuclear factor I B; p = 0.015-0.025) expression with response status, remission status and improvement in depression scale, respectively. Pathway analysis of citalopram-altered gene expression indicated response-status-dependent transcriptional reactions. Whereas in clinical responders neural function pathways were primarily up- or downregulated after incubation with citalopram, deregulated pathways in non-responders LCLs mainly involved cell adhesion and immune response. Results from the STAR*D study showed a marginal association of treatment-resistant depression with NFIB (p = 0.068) but not with GAD1 (p = 0.23) and TBC1D9 (p = 0.27). Our results propose the existence of distinct pathway regulation mechanisms in responders vs. non-responders and suggest GAD1, TBC1D9, and NFIB as tentative predictors for clinical response, full remission, and improvement in depression scale, respectively, with only a weak overlap in predictors of different therapy outcome phenotypes.
Conflict of interest statement
The authors declare that they have no conflict of interest.
Figures
Similar articles
-
Gene expression and proliferation biomarkers for antidepressant treatment resistance.Transl Psychiatry. 2017 Mar 14;7(3):e1061. doi: 10.1038/tp.2017.16. Transl Psychiatry. 2017. PMID: 28291260 Free PMC article.
-
Analysis of 23andMe antidepressant efficacy survey data: implication of circadian rhythm and neuroplasticity in bupropion response.Transl Psychiatry. 2016 Sep 13;6(9):e889. doi: 10.1038/tp.2016.171. Transl Psychiatry. 2016. PMID: 27622933 Free PMC article.
-
Differential prediction of first clinical response to serotonergic and noradrenergic antidepressants using the loudness dependence of auditory evoked potentials in patients with major depressive disorder.J Clin Psychiatry. 2007 Aug;68(8):1206-12. doi: 10.4088/jcp.v68n0806. J Clin Psychiatry. 2007. PMID: 17854244 Clinical Trial.
-
Escitalopram : a review of its use in the management of major depressive and anxiety disorders.CNS Drugs. 2003;17(5):343-62. doi: 10.2165/00023210-200317050-00004. CNS Drugs. 2003. PMID: 12665392 Review.
-
Citalopram--a review of pharmacological and clinical effects.J Psychiatry Neurosci. 2000 May;25(3):241-54. J Psychiatry Neurosci. 2000. PMID: 10863884 Free PMC article. Review.
Cited by
-
Genome-wide association analyses of symptom severity among clozapine-treated patients with schizophrenia spectrum disorders.Transl Psychiatry. 2022 Apr 7;12(1):145. doi: 10.1038/s41398-022-01884-3. Transl Psychiatry. 2022. PMID: 35393395 Free PMC article.
-
Transcriptomic Studies of Antidepressant Action in Rodent Models of Depression: A First Meta-Analysis.Int J Mol Sci. 2022 Nov 4;23(21):13543. doi: 10.3390/ijms232113543. Int J Mol Sci. 2022. PMID: 36362329 Free PMC article.
-
Assessing the Neurodevelopmental Impact of Fluoxetine, Citalopram, and Paroxetine on Neural Stem Cell-Derived Neurons.Pharmaceuticals (Basel). 2024 Oct 18;17(10):1392. doi: 10.3390/ph17101392. Pharmaceuticals (Basel). 2024. PMID: 39459031 Free PMC article.
-
Lost in translation. The quest for definitions of treatment-resistant depression with a focus on inflammation-related gene expression.Brain Behav Immun Health. 2021 Sep 19;16:100331. doi: 10.1016/j.bbih.2021.100331. eCollection 2021 Oct. Brain Behav Immun Health. 2021. PMID: 34514443 Free PMC article.
References
-
- Kirchheiner J, et al. Pharmacogenetics of antidepressants and antipsychotics: the contribution of allelic variations to the phenotype of drug response. Mol. Psychiatry. 2004;9:442–473. - PubMed
-
- Fabbri C, et al. Genome-wide association study of treatment-resistance in depression and meta-analysis of three independent samples. Br. J. Psychiatry. 2019;214:36–41. - PubMed
-
- Sullivan PF, Fan C, Perou CM. Evaluating the comparability of gene expression in blood and brain. Am. J. Med Genet. B Neuropsychiatr. Genet. 2006;141B:261–268. - PubMed
MeSH terms
Substances
LinkOut - more resources
Full Text Sources
Molecular Biology Databases
Miscellaneous
