. 2020 Jun 16:11:506.
doi: 10.3389/fphys.2020.00506. eCollection 2020.

Sex-Specific Response to Caloric Restriction After Reproductive Investment in Microcebus murinus: An Integrative Approach

Affiliations

Sex-Specific Response to Caloric Restriction After Reproductive Investment in Microcebus murinus: An Integrative Approach

Aude Noiret et al. Front Physiol. .

Abstract

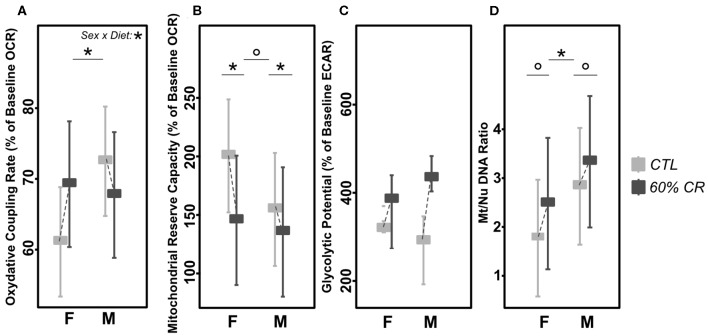
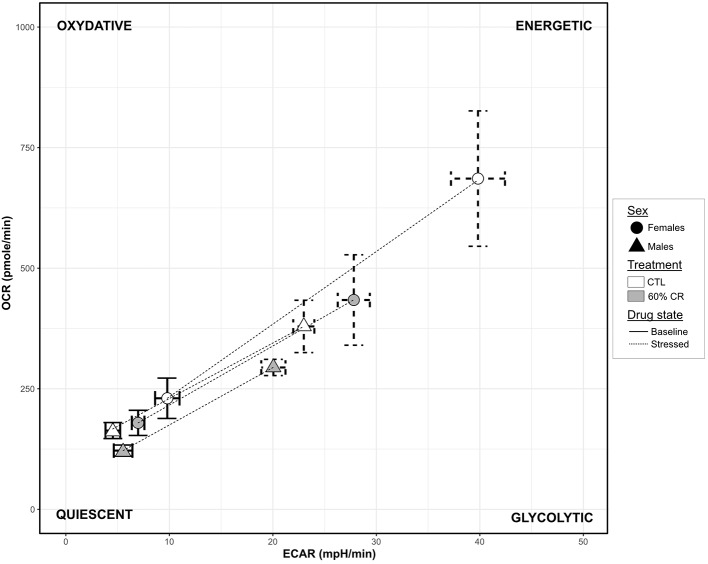
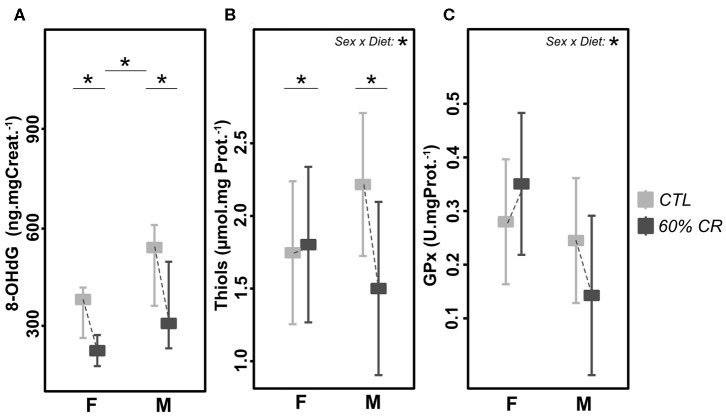
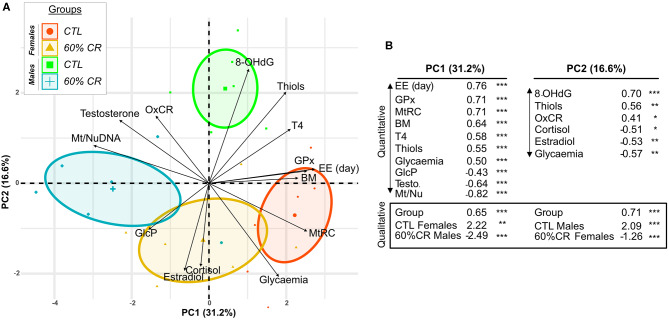
In seasonal environments, males and females usually maintain high metabolic activity during the whole summer season, exhausting their energy reserves. In the global warming context, unpredictability of food availability during summer could dramatically challenge the energy budget of individuals. Therefore, one can predict that resilience to environmental stress would be dramatically endangered during summer. Here, we hypothesized that females could have greater capacity to survive harsh conditions than males, considering the temporal shift in their respective reproductive energy investment, which can challenge them differently, as well as enhanced flexibility in females' physiological regulation. We tackled this question on the gray mouse lemur (Microcebus murinus), focusing on the late summer period, after the reproductive effort. We monitored six males and six females before and after a 2-weeks 60% caloric restriction (CR), measuring different physiological and cellular parameters in an integrative and comparative multiscale approach. Before CR, females were heavier than males and mostly characterized by high levels of energy expenditure, a more energetic mitochondrial profile and a downregulation of blood antioxidants. We observed a similar energy balance between sexes due to CR, with a decrease in metabolic activity over time only in males. Oxidative damage to DNA was also reduced by different pathways between sexes, which may reflect variability in their physiological status and life-history traits at the end of summer. Finally, females' mitochondria seemed to exhibit greater flexibility and greater metabolic potential than males in response to CR. Our results showed strong differences between males and females in response to food shortage during late summer, underlining the necessity to consider sex as a factor for population dynamics in climate change models.

Keywords: caloric restriction; non-human primate; oxidative stress; reproductive investment; season; sex.


Figures

Figure 1
Figure 1
Levels of (A) cortisol (ng*mg Creat.−1), (B) body mass (g), and (C) fasting glycaemia (md*dl−1) exhibited by female (F) and male (M) mouse lemurs before (CTL, light gray) and after (60% CR, dark gray) a 2-weeks exposure to a 60% caloric restriction. Data are given as least square means with 95% confidence intervals. Differences within sex groups (effect of CR, lower bars) and between sex groups (effect of sex, upper bars) are represented, as well as the significance of the interaction of Sex*Diet (CTL or CR). *< 0.05.
Figure 2
Figure 2
Daily variations (mean ± sd) of oxygen consumption (VO2 in ml*kg−1*h−1) and Respiratory Exchange Ratio (RER) measured in female (A,B, respectively) and male (C,D, respectively) mouse lemurs before (CTL, light gray) and after (60% CR, dark gray) a 2-weeks exposure to a 60% caloric restriction.
Figure 3
Figure 3
Levels of (A) mean oxygen consumption (VO2 in ml*kg−1*h−1), (B) Respiratory Exchange Ratio (RER), (C) mean Energy Expenditure (in kcal*h−1) measured during the night (active phase) and the day (resting phase) in female (F) and male (M) mouse lemurs before (light gray) and after (dark gray) a 2-week exposure to a 60% caloric restriction. Thyroxinemia (T4, in nmol.l-1, D) was measured in the same animals during the resting period only. Boxes indicate least square means and error bars represent the 95% confidence interval, except for T4, which is represented as median and total range. Significant differences within sex groups (effect of CR, lower bars) and between sex groups (effect of sex, upper bars) are represented. *< 0.05.
Figure 4
Figure 4
Polar graphics representing averaged time (in hh:mm) when minimum and maximum VO2 (A,B, respectively), RER (C,D), and EE (E,F) were expressed over a 24 h period. Female mouse lemurs are shown as circles, and male as triangles. CTL animals are in ligth gray, CR in dark gray. Each experimental group is represented on its own concentric circle: RM (CR males), CM (CTL males), RF (CR females) and CF (CTL females). Time shift is represented by a dashed line for each individual. The shaded phase between 17:00 and 3:00 is the dark phase of the day, when the lights are off.
Figure 5
Figure 5
Levels of (A) mitochondrial oxidative coupling rate (% of baseline OCR), (B) Mitochondrial reserve capacity (% of baseline OCR), (C) Glycolytic Potential (% of baseline ECAR), and (D) Mt/Nu DNA ratios measured in cultured fibroblasts from female (F) and male (M) mouse lemurs before (CTL, light gray) and after (60% CR, dark gray) a 2-week exposure to a 60% caloric restriction. Boxes indicate least square means and error bars represent the 95% confidence interval, except for GlcP (median and total range). Significant differences within sex groups (effect of CR, lower bars) and between sex groups (effect of sex, upper bars) are represented, as well as the significance of the interaction of Sex*Diet (CTL or CR). *< 0.05; ° < 0.1.
Figure 6
Figure 6
Graphic representation of the cellular metabolic potential measured in cultured fibroblasts from female (circles) and male (triangles) mouse lemurs before (CTL, white) and after (60% CR, gray) a 2-week exposure to a 60% caloric restriction. Metabolic Potentials (mean + sd) are represented by dashed lines between two cell energy phenotypes: “Basal OCR/ECAR” (sd in solid lines) and “Stressed OCR/ECAR” (sd in dashed lines; determined under FCCP conditions, chemically mimicking an induced energy demand). The 2-dimension description of the metabolic potential informs on the general capacity of the cells to meet an energy demand either by glycolysis (“Glycolytic” phenotype), oxidative respiration (“Oxydative” phenotype) or both (“Energetic” phenotype).
Figure 7
Figure 7
Levels of (A) 8-OHdG (ng*mg Creat.−1*g.−1), (B) Thiols (μmol*mg Prot.−1), and (C) Gluthatione Peroxydase (GPx, U*mg Prot.−1) measured in female (F) and male (M) mouse lemurs before (CTL, light gray) and after (60% CR, dark gray) a 2-week exposure to a 60% caloric restriction. Boxes indicate least square means and error bars represent the 95% confidence interval, except for 8-OHdG (median and total range). Significant differences within sex groups (effect of CR, lower bars) and between sex groups (effect of sex, upper bars) are represented, as well as the significance of the interaction of Sex*Diet (CTL or CR). *< 0.05.
Figure 8
Figure 8
Levels of (A) 17-beta Estradiol (pg.mg Creat.−1) and (B) Testosterone (ng.mg Creat.−1) measured in female (F) and male (M) mouse lemurs before (CTL, light gray) and after (60% CR, dark gray) a 2-week exposure to a 60% caloric restriction. Boxes indicate least square means and error bars represent the 95% confidence interval. Significant differences within sex groups (effect of CR, lower bars) and between sex groups (effect of sex, upper bars) are represented, as well as the significance of the interaction of Sex*Diet (CTL or CR). *< 0.05.
Figure 9
Figure 9
Principal Component Analysis discriminating female and male mouse lemurs before (CTL, red and green for females and males, respectively) and after (60% CR, orange and blue for females and males, respectively) a 2-week exposure to a 60% caloric restriction. Parameters indicative of energy balance (Body mass “BM”), metabolic activity (Cortisol “Cortisol,” Thyroxin “T4,” Mean EE over day “EE (day),” mitochondrial respiration (Oxydative coupling rate “OxCR”, Mitochondrial Reserve Capacity “MtRC,” Glycolytic Potential “GlcP”), Oxidative status (8-OHdG “8-OHdG,” Thiols “Thiols,” Glutathione Peroxydase “GPx”), sexual hormones (Estradiol “Estradiol,” Testosterone “Testosterone”) were included in the analysis. Individual plots are shown in (A) and grouped into sex*Diet. The contribution of each parameter is also represented by black arrows displaying the “Variable factor map.” Principal Component 1 (PC1) indicates ~31% of variability and Principal Component 2 (PC2) ~17%. (B) Table of correlation coefficients and corresponding p-values shows only the variables significantly contributing to the two first principal components of the analysis (Quantitative) and the discrimination of qualitative variables: CTL Females, 60%CR Females, CTL Males, 60%CR Males. *< 0.05, **< 0.01, ***< 0.001.

References

    1. Alonso-Alvarez C., Bertrand S., Faivre B., Chastel O., Sorci G. (2007). Testosterone and oxidative stress: the oxidation handicap hypothesis. Proc. R. Soc. Lond. B Biol. Sci. 274, 819–825. 10.1098/rspb.2006.3764 - DOI - PMC - PubMed
    1. Aslam H., Schneiders A., Perret M., Weinbauer G. F., Hodges J. K. (2002). Quantitative assessment of testicular germ cell production and kinematic and morphometric parameters of ejaculated spermatozoa in the grey mouse lemur, Microcebus murinus. Reproduction 123, 323–332. 10.1530/rep.0.1230323 - DOI - PubMed
    1. Barp J., Araujo A. S. R., Fernandes T. R. G., Rigatto K. V., Llesuy S., Bello-Klein A., et al. . (2002). Myocardial antioxidant and oxidative stress changes due to sex hormones. Braz. J. Med. Biol. Res. 35, 1075–1081. 10.1590/S0100-879X2002000900008 - DOI - PubMed
    1. Bieber C., Lebl K., Stalder G., Geiser F., Ruf T. (2014). Body mass dependent use of hibernation: why not prolong the active season, if they can? Funct. Ecol. 28, 167–177. 10.1111/1365-2435.12173 - DOI
    1. Breuner C. W., Delehanty B., Boonstra R. (2013). Evaluating stress in natural populations of vertebrates: total CORT is not good enough. Funct. Ecol. 27, 24–36. 10.1111/1365-2435.12016 - DOI

LinkOut - more resources