. 2020 Jun 16:8:625.
doi: 10.3389/fbioe.2020.00625. eCollection 2020.

Curcumin Protects Osteoblasts From Oxidative Stress-Induced Dysfunction via GSK3β-Nrf2 Signaling Pathway

Affiliations

Curcumin Protects Osteoblasts From Oxidative Stress-Induced Dysfunction via GSK3β-Nrf2 Signaling Pathway

Xumin Li et al. Front Bioeng Biotechnol. .

Abstract

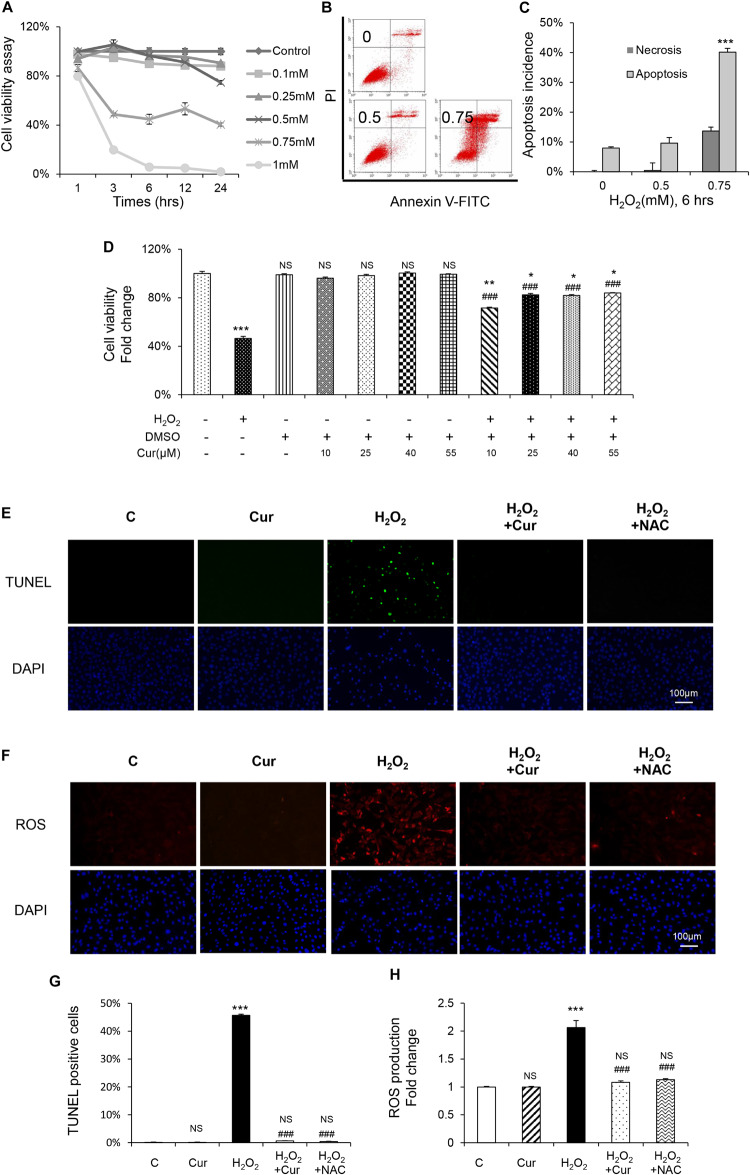
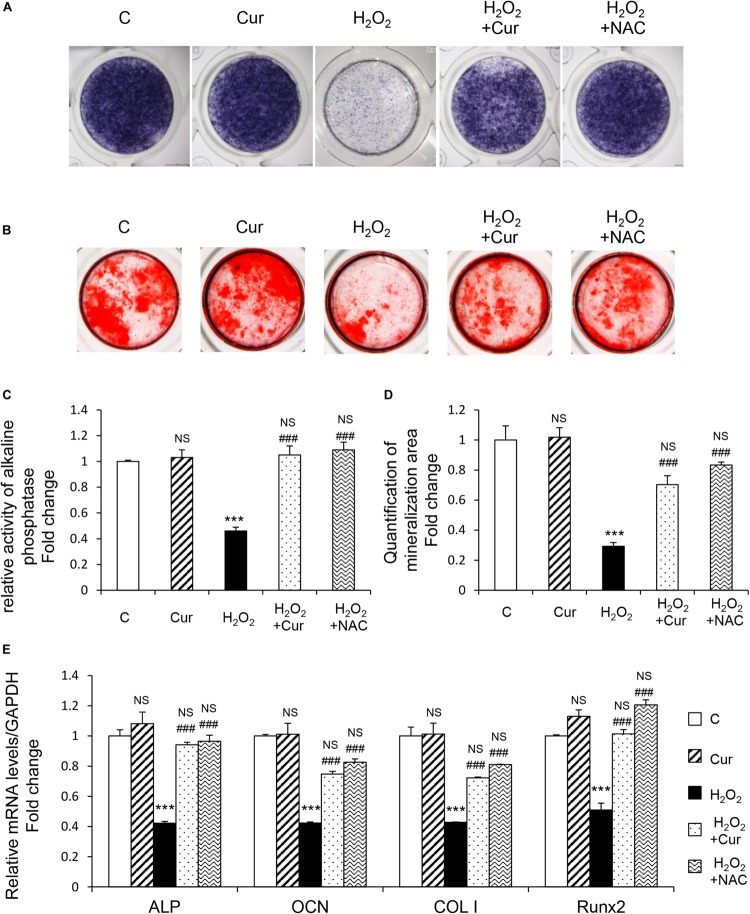
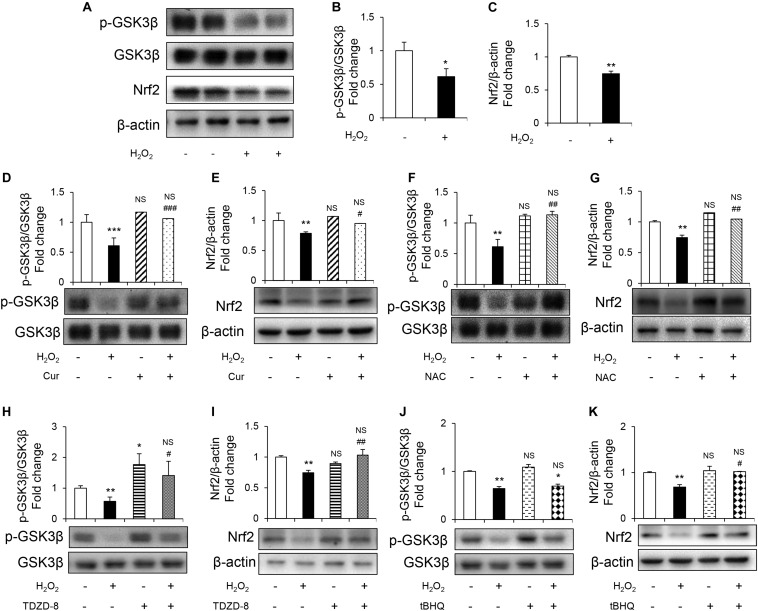
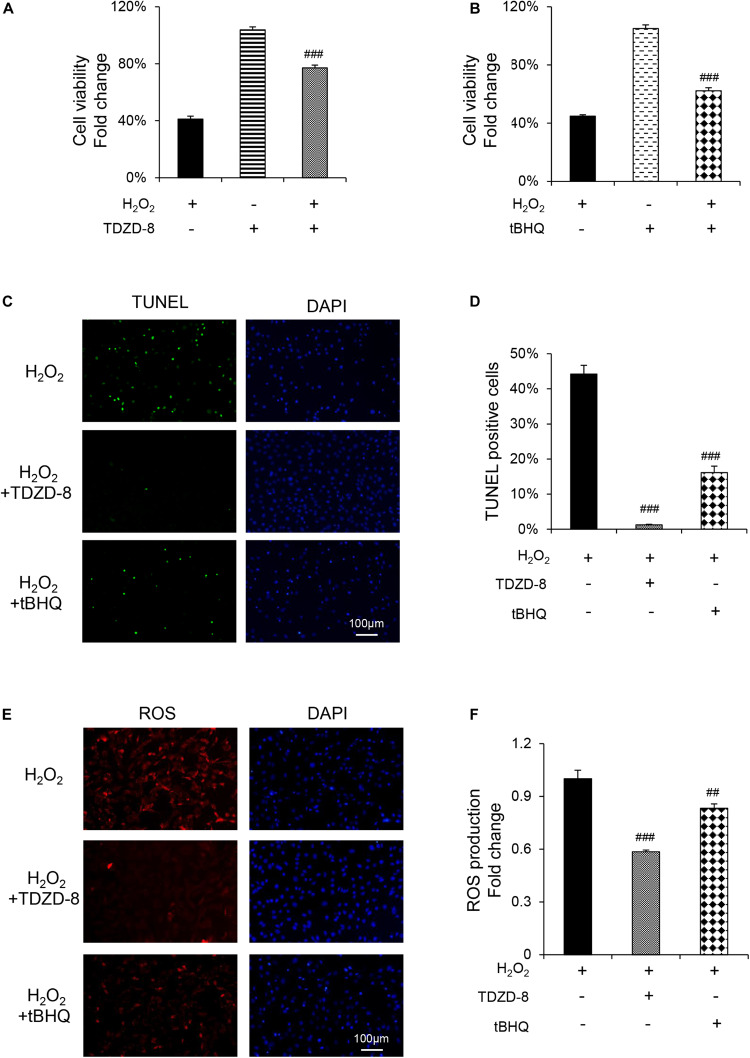
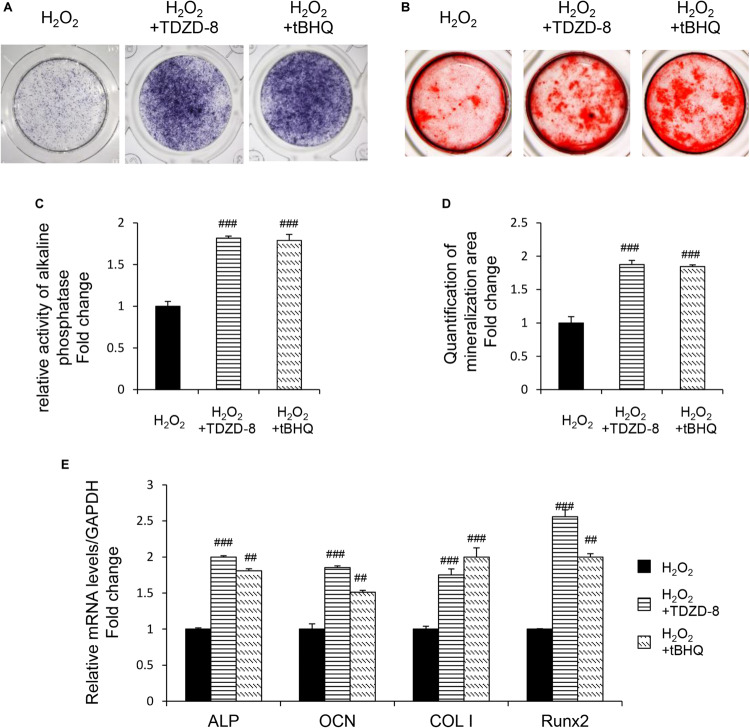
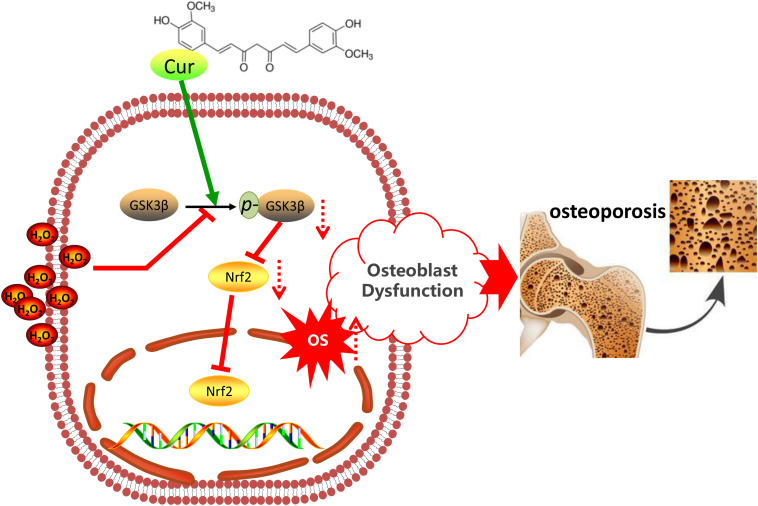
Osteoblasts dysfunction, induced by oxidative stress (OS), is one of major pathological mechanisms for osteoporosis. Curcumin (Cur), a bioactive antioxidant compound, isolated from Curcumin longa L, was regarded as a strong reactive oxygen species (ROS) scavenger. However, it remains unveiled whether Cur can prevent osteoblasts from OS-induced dysfunction. To approach this question, we adopted a well-established OS model to investigate the preventive effect of Cur on osteoblasts dysfunction by measuring intracellular ROS production, cell viability, apoptosis rate and osteoblastogenesis markers. We showed that the pretreatment of Cur could significantly antagonize OS so as to suppress endogenous ROS production, maintain osteoblasts viability and promote osteoblastogenesis. Inhibiting Glycogen synthase kinase (GSK3β) and activating nuclear factor erythroid 2 related factor 2 (Nrf2) could significantly antagonize the destructive effects of OS, which indicated the critical role of GSK3β-Nrf2 signaling. Furthermore, Cur also abolished the suppressive effects of OS on GSK3β-Nrf2 signaling pathway. Our findings demonstrated that Cur could protect osteoblasts against OS-induced dysfunction via GSK3β-Nrf2 signaling and provide a promising way for osteoporosis treatment.

Keywords: GSK3β; Nrf2; curcumin; dysfunction; osteoblast; oxidative stress.


Figures

FIGURE 1
FIGURE 1
Cur attenuated H2O2-induced apoptosis and ROS generation in MC3T3-E1 cells. (A) MC3T3-E1 cells were treated with or without H2O2 in the basic medium. Cell viability was determined by MTT reduction in MC3T3-E1 cells in the presence of different concentration of H2O2 for 1, 3, 6, 12, 24 h. (B,C) The flow cytometric analysis of staining from control group, 0.5 and 0.75 mM H2O2 for 6 h. (D) Cur was added 24 h before H2O2. Cell viability was determined by MTT reduction in MC3T3-E1 cells in the presence of 0.10, 0.25, 0.40, and 0.55 μM Cur for 24 h with (+) or without (–) H2O2. (E,G) The cells were immunostained for TUNEL (green). DAPI staining was used to mark the position of the nuclei. Scale bars = 100 μm. (F,H) The cells were harvested and stained with DCFH-DA (red). Scale bars = 100 μm. Data are presented as the mean ± SD from at least three independent experiments. *p < 0.05, **p < 0.01, ***p < 0.001, versus C group; NS, non-significantly different from C group. #p < 0.05, ##p < 0.01, ###p < 0.001, versus the H2O2 group; ns, non-significantly different from H2O2 group.
FIGURE 2
FIGURE 2
Cur rescue H2O2 induced osteoblast dysfunction. The MC3T3-E1 cells were treated in the osteogenesis differentiation medium with or without H2O2 and Cur. (A) After the cells cultured for a week and they were subjected to ALP staining in the indicated treatment groups. (B) The alizarin red staining of MC3T3-E1 cells showed the mineralizing matrix after cultured for 2 weeks. (C) ALP activity tested in MC3T3-E1 cells as indicated groups. (D) Mineralization area was evaluated by tests. (E) When cultured for 3 days the expression of osteogenic marker genes were analyzed. Data are presented as the mean ± SD from at least three independent experiments. *p < 0.05, **p < 0.01, ***p < 0.001, versus C group; NS, non-significantly different from C group. #p < 0.05, ##p < 0.01, ###p < 0.001, versus the H2O2 group; ns, non-significantly different from H2O2 group.
FIGURE 3
FIGURE 3
Cur attenuated H2O2-induced osteoblast apoptosis through GSK3β-Nrf2 signaling pathway. MC3T3-E1 cells were treated in the basic medium with or without H2O2 for 6 h. (A) Representative immunoreactive bands for phosphorylated GSK3β, GSK3β, and Nrf2 in MC3T3-E1 cells. (B,C) Quantification of immunoreactive bands for phosphorylated GSK3β relative to GSK3β and Nrf2 relative to β-actin. (D,E) Cur was added 24 h before H2O2. Densitometry of immunoreactive bands for p-GSK3β and GSK3β, Nrf2 and β-actin in MC3T3-E1 cells with (+) or without (–) Cur in the presence of H2O2 (+) or culture medium (–). (F,G) NAC was added 1 h before H2O2. Representative immunoreactive bands and relative levels of p-GSK3β and GSK3β, Nrf2 and β-actin in MC3T3-E1 cells with (+) or without (–) NAC treatment in the presence of H2O2 (+) or culture medium (–). Representative immunoblots are shown at the bottom. (H,I) TDZD-8 was added 1 h before H2O2. Representative immunoreactive bands and relative levels of p-GSK3β and GSK3β, Nrf2, and β-actin in MC3T3-E1 cells with (+) or without (–) TDZD-8 treatment in the presence of H2O2 (+) or culture medium (–). (J,K) tBHQ was added 1 h before H2O2. Representative immunoreactive bands and relative levels of p-GSK3β and GSK3β, Nrf2, and β-actin in MC3T3-E1 cells with (+) or without (–) tBHQ treatment in the presence of H2O2 (+) or culture medium (–). Data are presented as the mean ± SD from at least three independent experiments. *p < 0.05, **p < 0.01, ***p < 0.001, versus C group; NS, non-significantly different from C group. #p < 0.05, ##p < 0.01, ###p < 0.001, versus the H2O2 group; ns, non-significantly different from H2O2 group.
FIGURE 4
FIGURE 4
GSK3β-Nrf2 signaling pathway is involved in H2O2-induced apoptosis and ROS generation in MC3T3-E1 cells. MC3T3-E1 cells were treated with or without H2O2 in the basic medium for 6 h. TDZD-8 or tBHQ were added 1 h before H2O2. (A) Cell viability determined by MTT reduction in MC3T3-E1 cells with (+) or without (–) TDZD-8 treatment in the presence or absence of H2O2 (+). (B) Cell viability determined by MTT reduction in MC3T3-E1 cells with (+) or without (–) tBHQ treatment in the presence or absence of H2O2 (+). (C,D) The cells were immunostained for TUNEL (green). DAPI staining was used to mark the position of the nuclei. Scale bars = 100 μm. (E,F) The cells were harvested and stained with DCFH-DA (red). Scale bars = 100 μm. Data are presented as the mean ± SD from at least three independent experiments. *p < 0.05, **p < 0.01, ***p < 0.001, versus C group; NS, non-significantly different from C group. #p < 0.05, ##p < 0.01, ###p < 0.001, versus the H2O2 group; ns, non-significantly different from H2O2 group.
FIGURE 5
FIGURE 5
GSK3β-Nrf2 signaling pathway is involved in H2O2-induced osteoblast dysfunction. The MC3T3-E1 cells were treated in the osteogenesis differentiation medium with or without H2O2 for 6 h. TDZD-8 or tBHQ were added 1 h before H2O2. (A) After the cells cultured for 7 days and they were subjected to ALP staining in the indicated treatment groups. (B) The alizarin red staining of MC3T3-E1 cells showed the mineralizing matrix after cultured for 14 days. (C) ALP activity tested in MC3T3-E1 cells as indicated groups. (D) Mineralization capacity was evaluated by tests. (E) When cultured for 3 days the expression of osteogenic marker genes were analyzed. Data are presented as the mean ± SD from at least three independent experiments. *p < 0.05, **p < 0.01, ***p < 0.001, versus C group; NS, non-significantly different from C group. #p < 0.05, ##p < 0.01, ###p < 0.001, versus the H2O2 group; ns, non-significantly different from H2O2 group.
FIGURE 6
FIGURE 6
Schematic diagram of the mechanism of Cur in OS-induced osteoblasts’ dysfunction.

References

    1. Almeida M., Han L., Ambrogini E., Bartell S. M., Manolagas S. C. (2010). Oxidative stress stimulates apoptosis and activates NF-kappaB in osteoblastic cells via a PKCbeta/p66shc signaling cascade: counter regulation by estrogens or androgens. Mol. Endocrinol. 24 2030–2037. 10.1210/me.2010-0189 - DOI - PMC - PubMed
    1. Baek K. H., Oh K. W., Lee W. Y., Lee S. S., Kim M. K., Kwon H. S., et al. (2010). Association of oxidative stress with postmenopausal osteoporosis and the effects of hydrogen peroxide on osteoclast formation in human bone marrow cell cultures. Calcif. Tissue Int. 87 226–235. 10.1007/s00223-010-9393-9 - DOI - PubMed
    1. Bialek P., Kern B., Yang X., Schrock M., Sosic D., Hong N., et al. (2004). A twist code determines the onset of osteoblast differentiation. Dev. Cell 6 423–435. 10.1016/s1534-5807(04)00058-9 - DOI - PubMed
    1. Chang R., Sun L., Webster T. J. (2014). Short communication: selective cytotoxicity of curcumin on osteosarcoma cells compared to healthy osteoblasts. Int. J. Nanomed. 9 461–465. 10.2147/IJN.S55505 - DOI - PMC - PubMed
    1. Chang R., Sun L., Webster T. J. (2015). Selective inhibition of MG-63 osteosarcoma cell proliferation induced by curcumin-loaded self-assembled arginine-rich-RGD nanospheres. Int. J. Nanomed. 10 3351–3365. 10.2147/IJN.S78756 - DOI - PMC - PubMed

LinkOut - more resources