. 2020 Feb;1(2):235-248.
doi: 10.1038/s43018-019-0018-6. Epub 2020 Jan 20.

Discovering the anti-cancer potential of non-oncology drugs by systematic viability profiling

Affiliations

Discovering the anti-cancer potential of non-oncology drugs by systematic viability profiling

Steven M Corsello et al. Nat Cancer. 2020 Feb.

Abstract

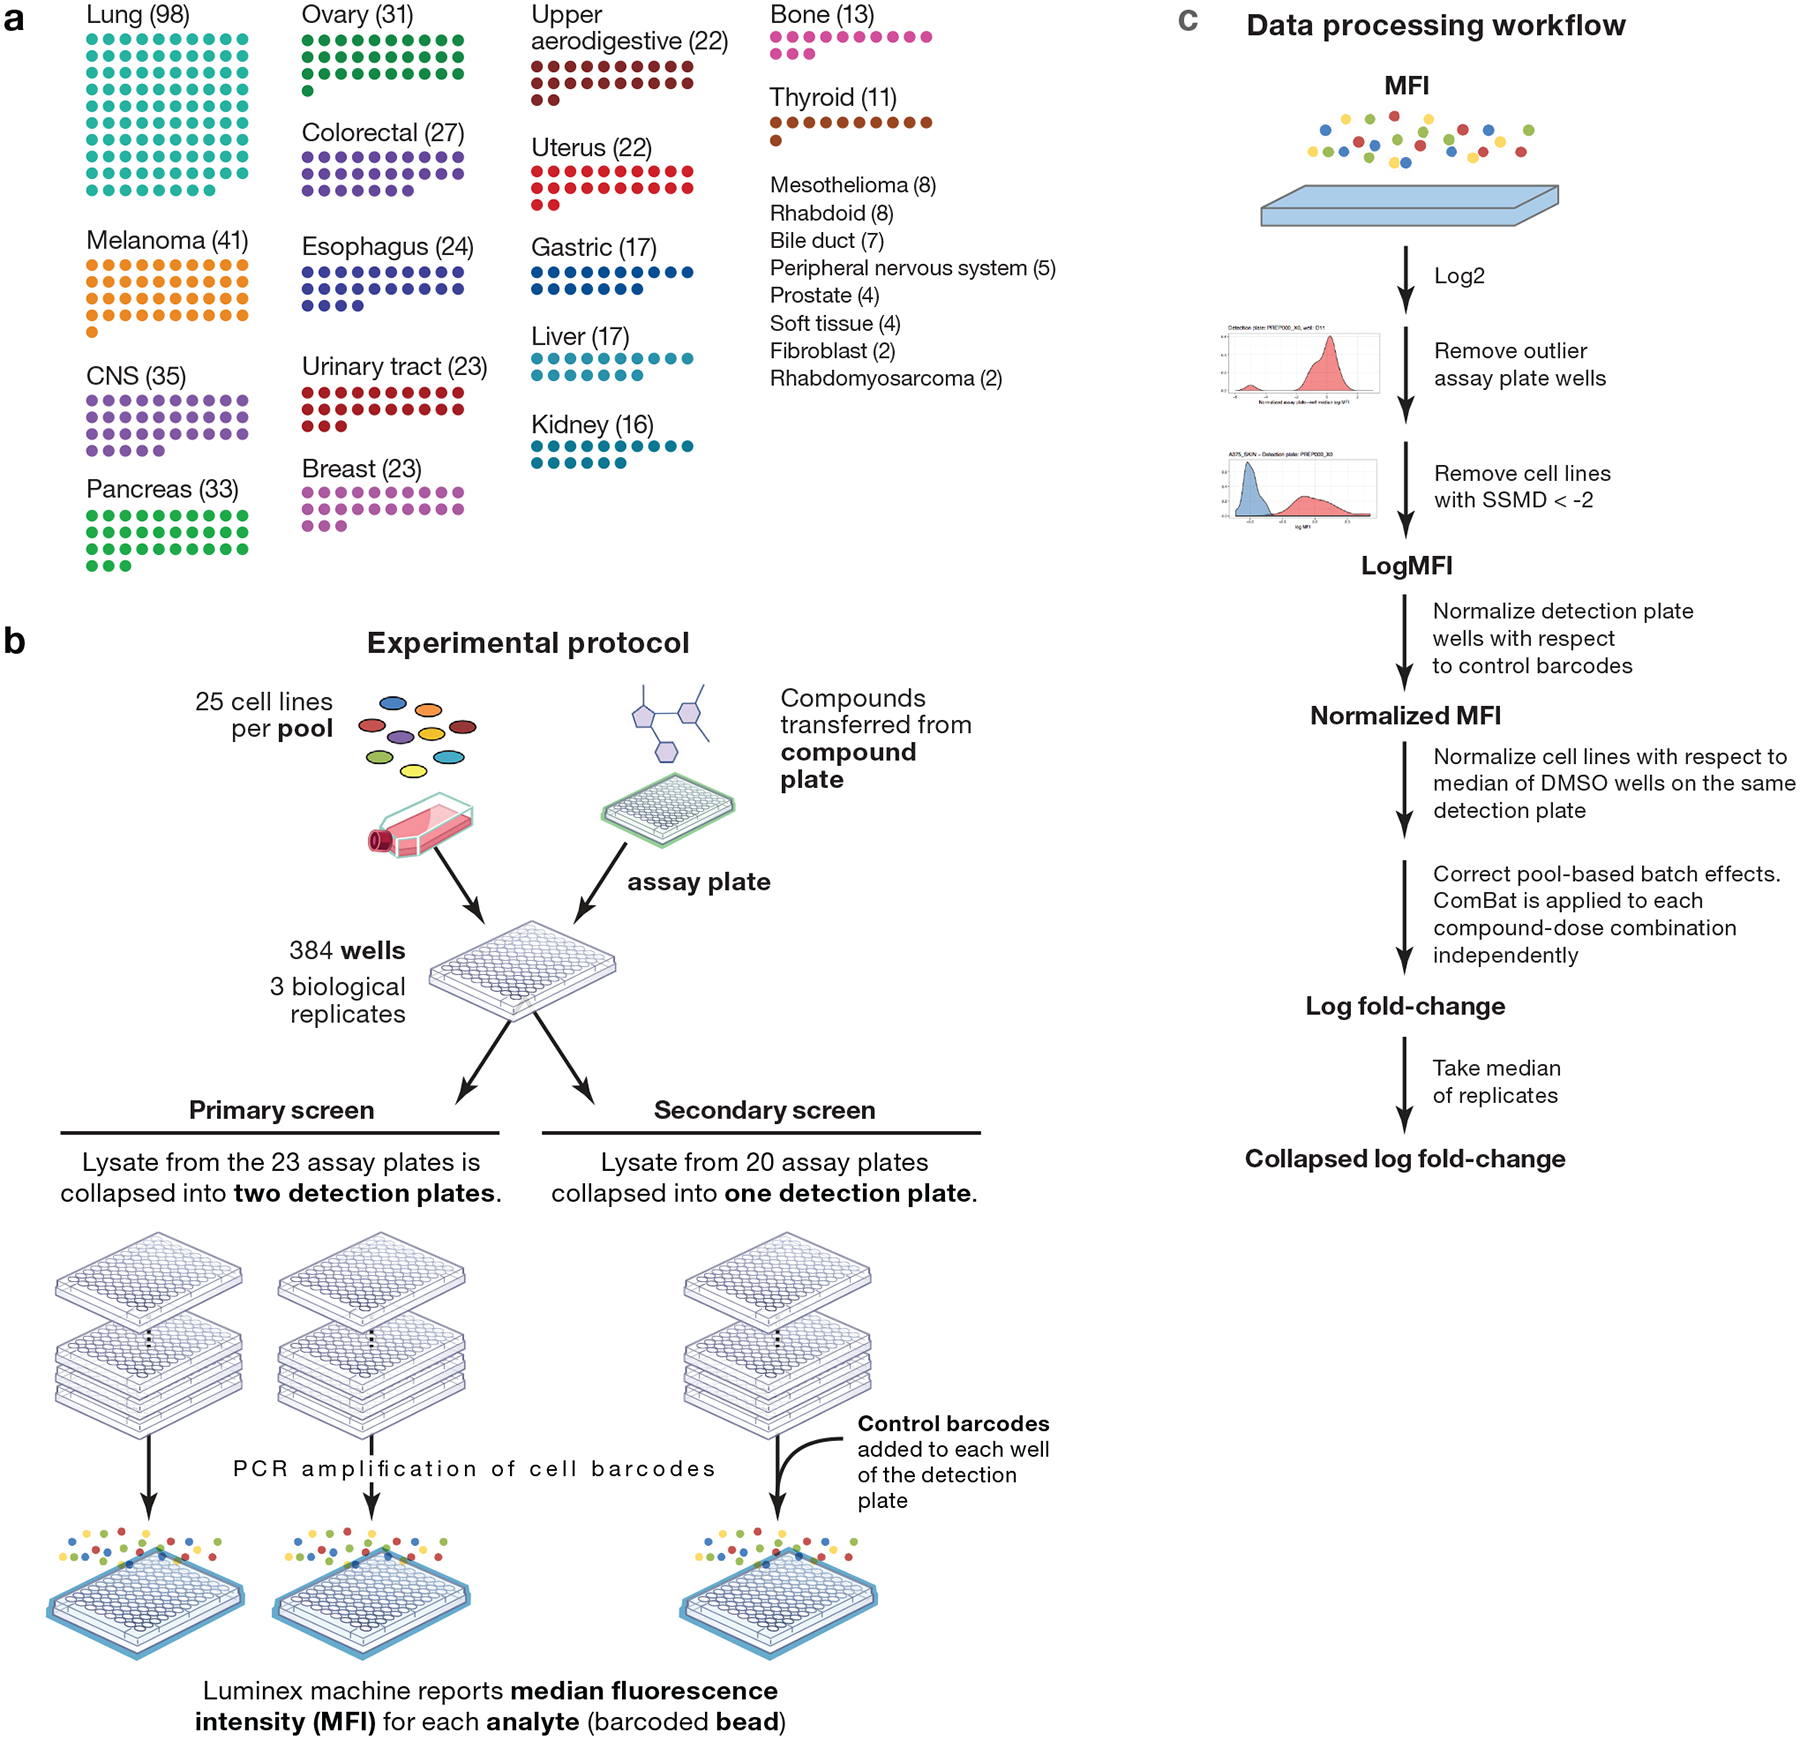
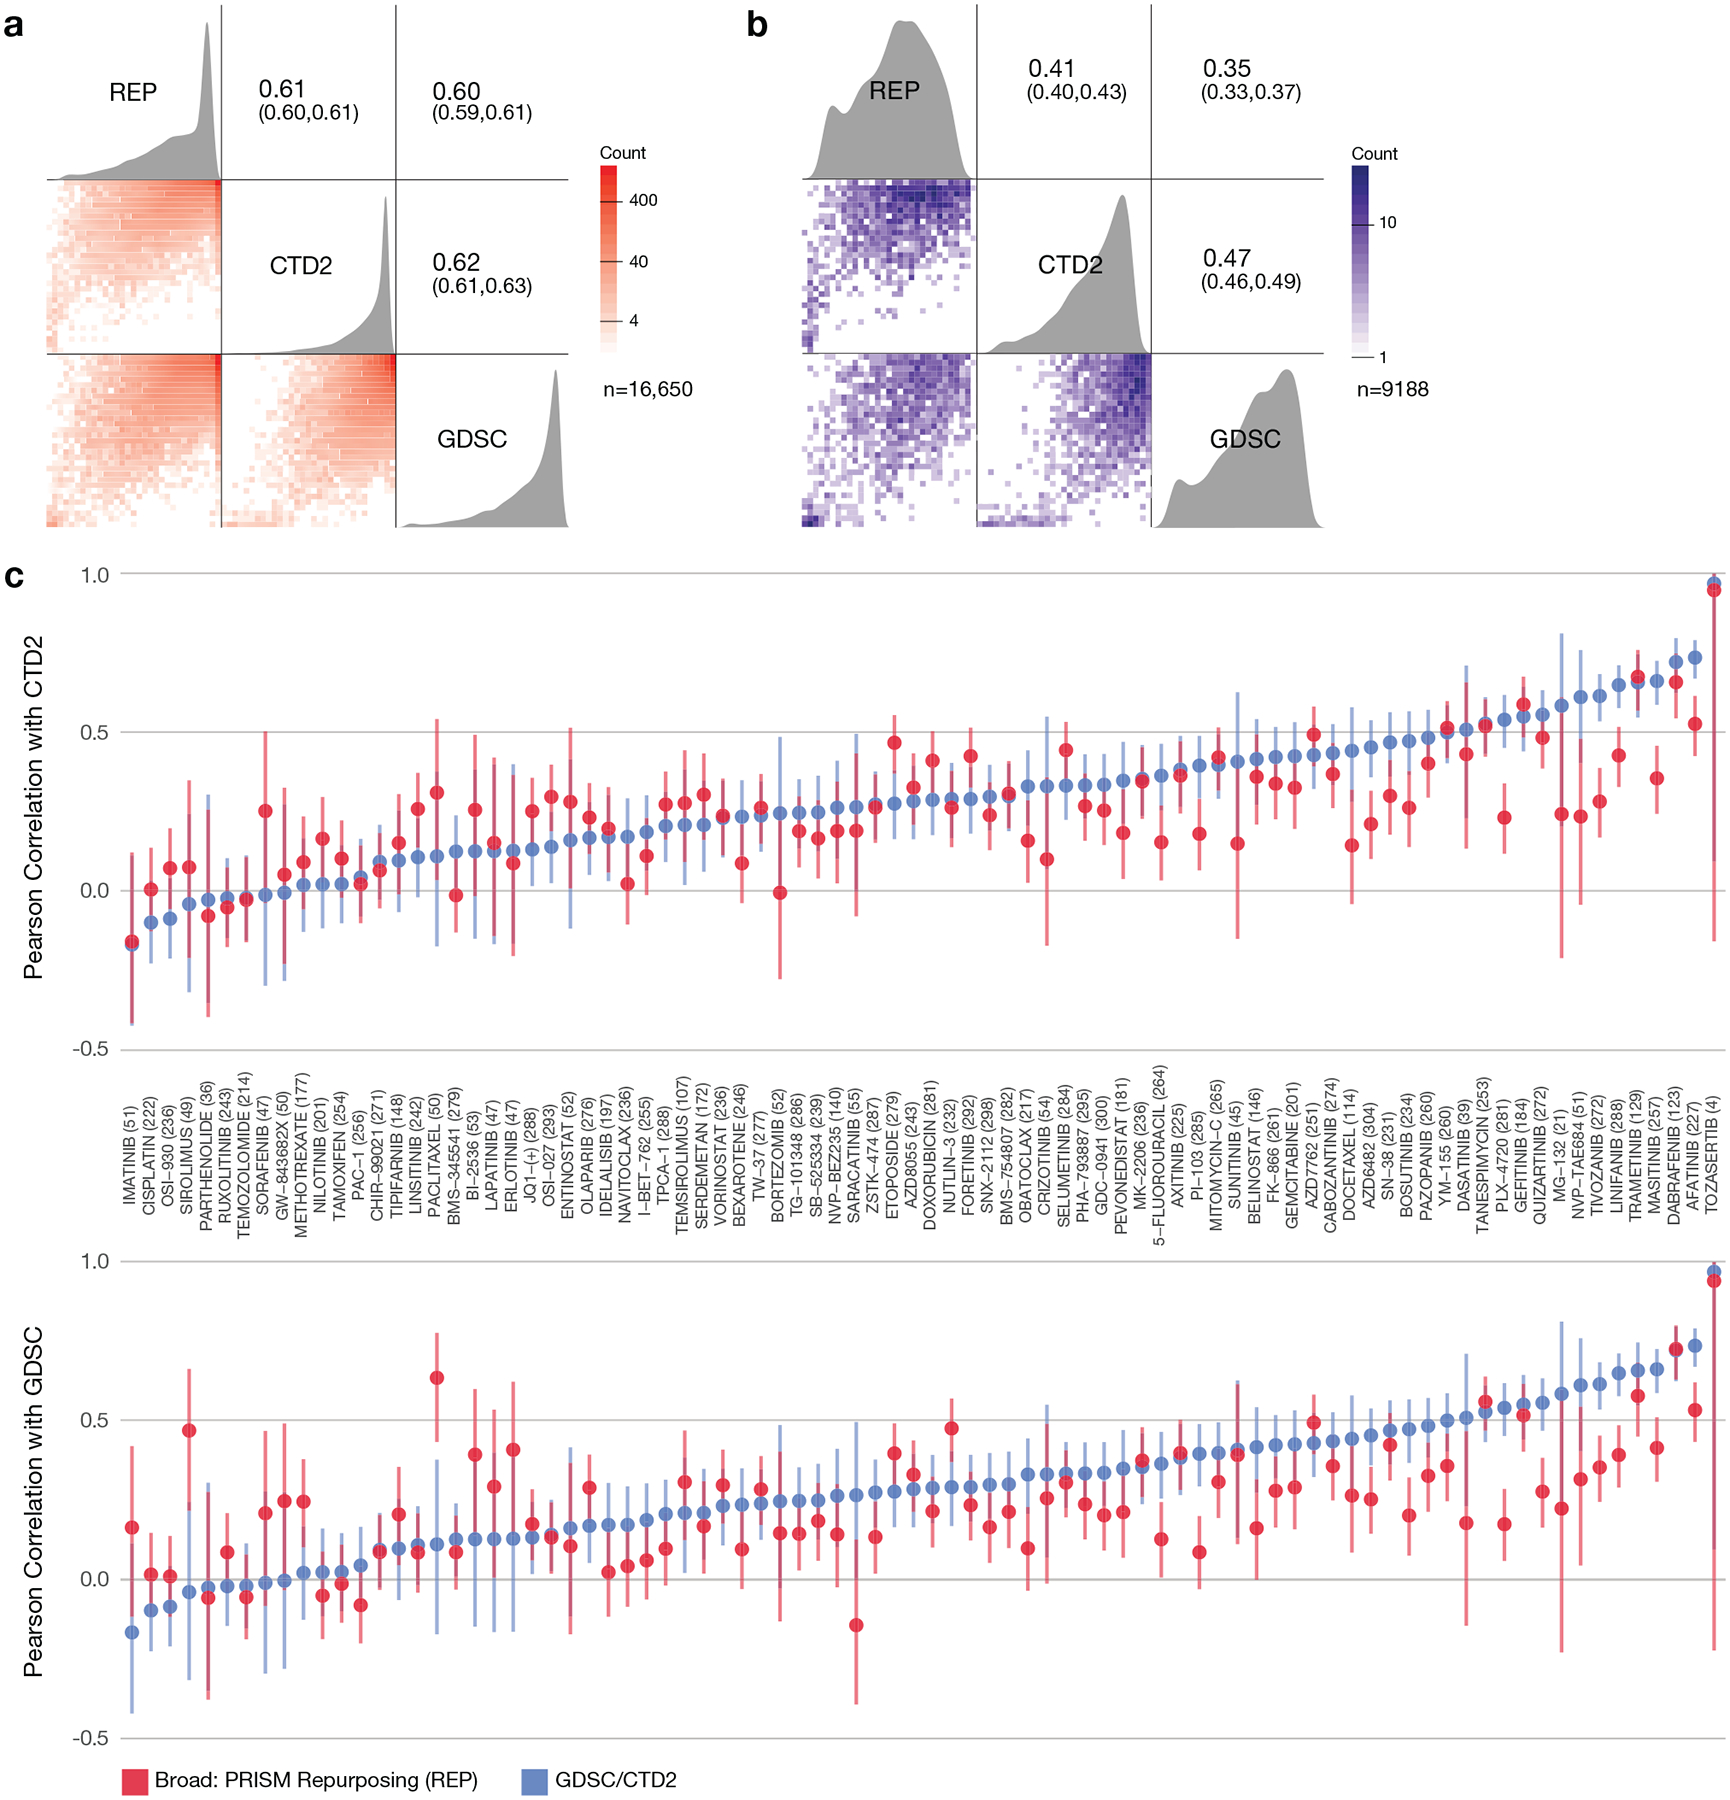
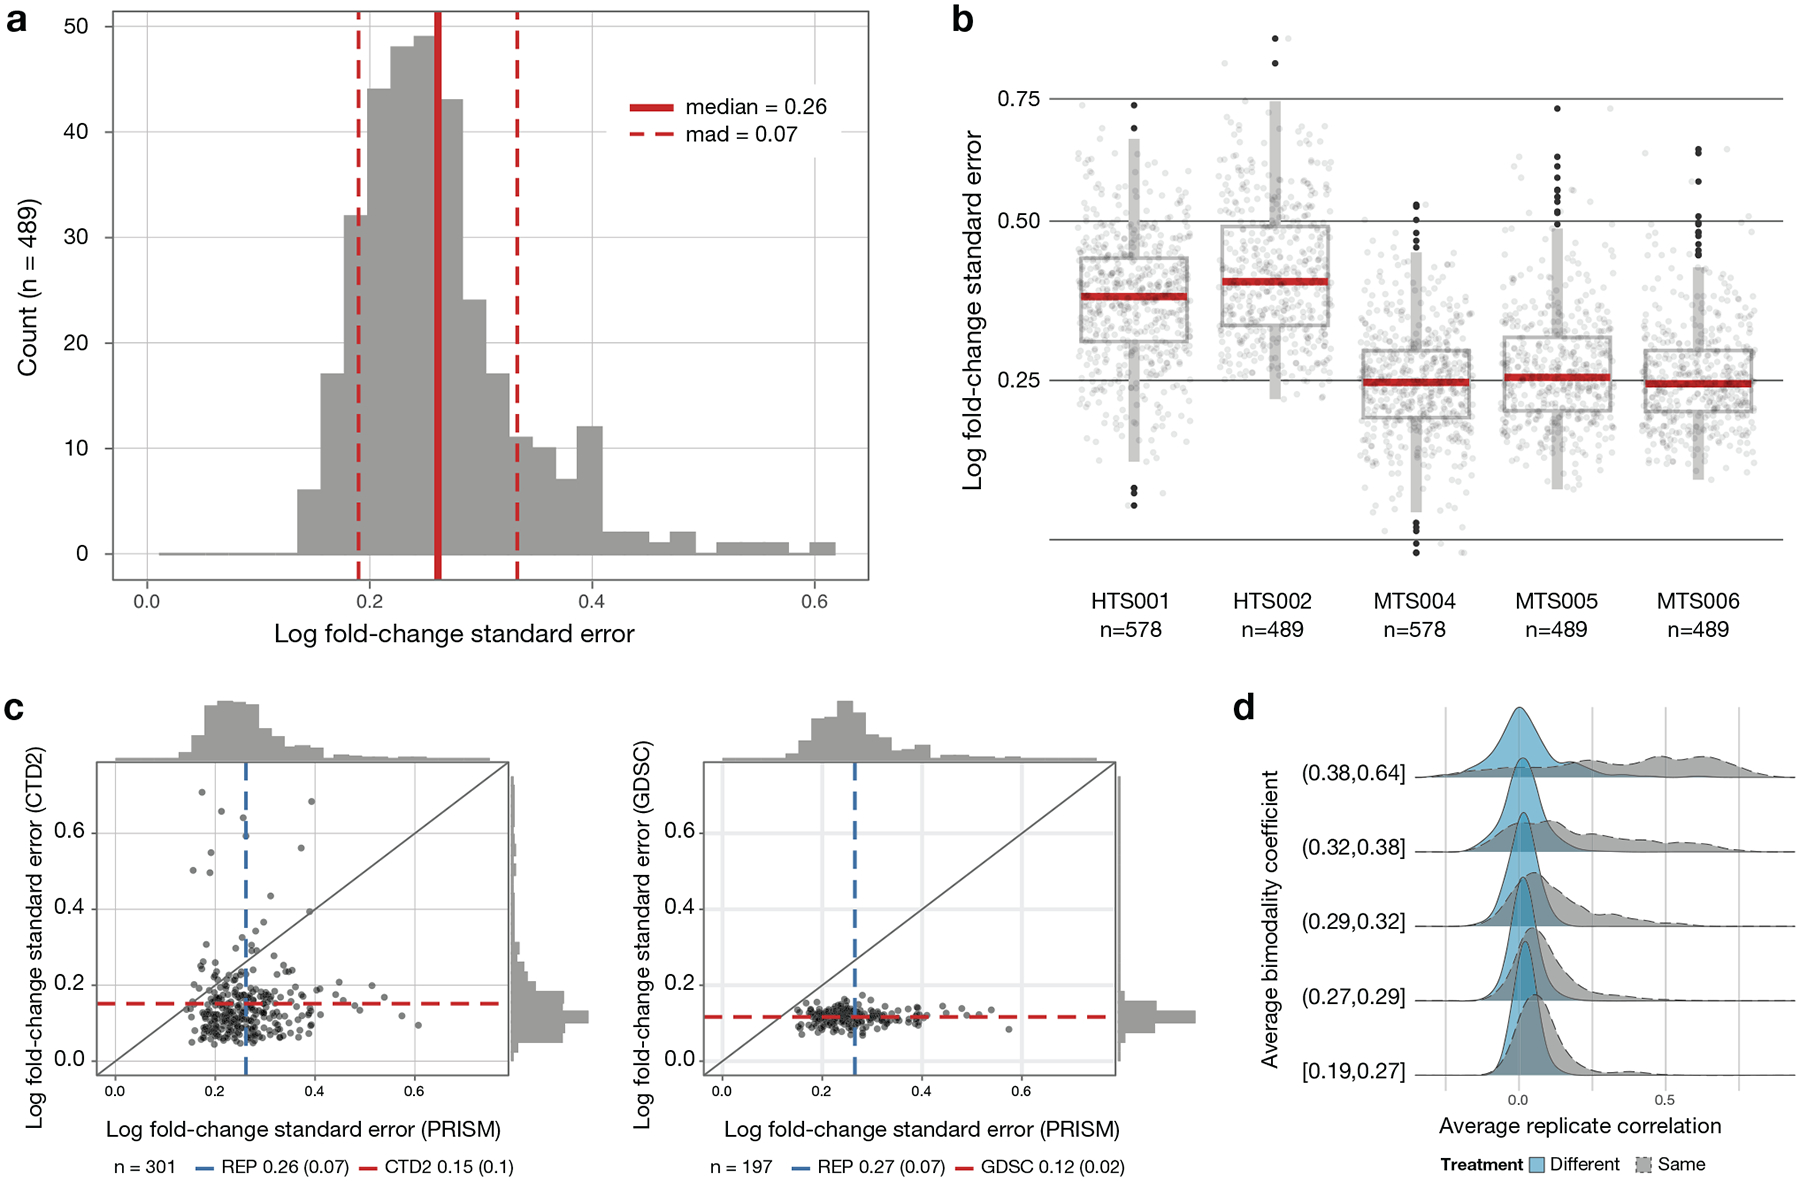
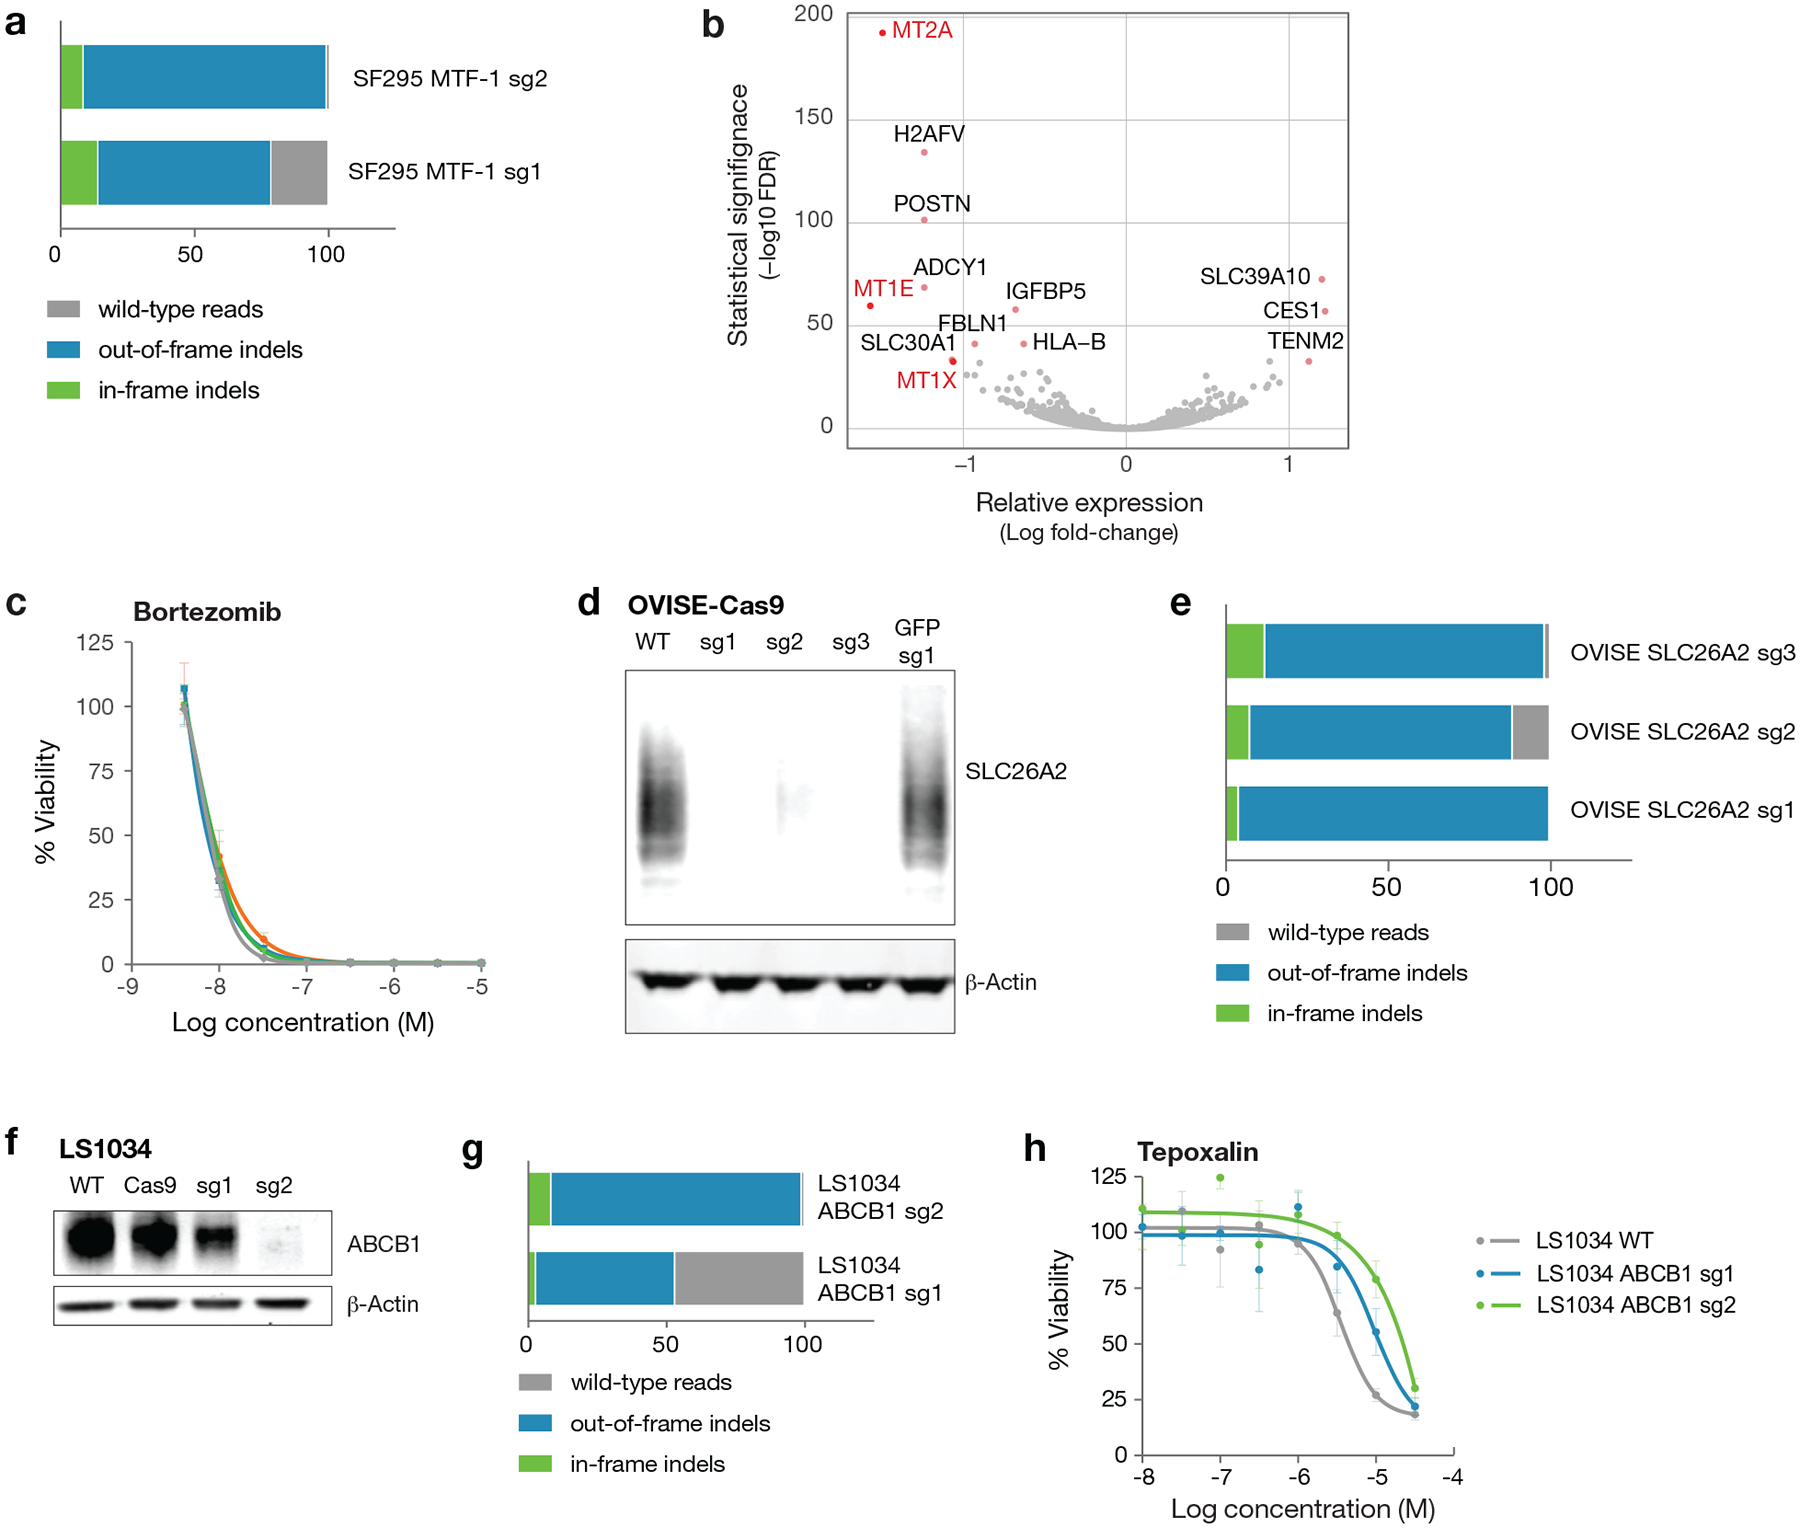
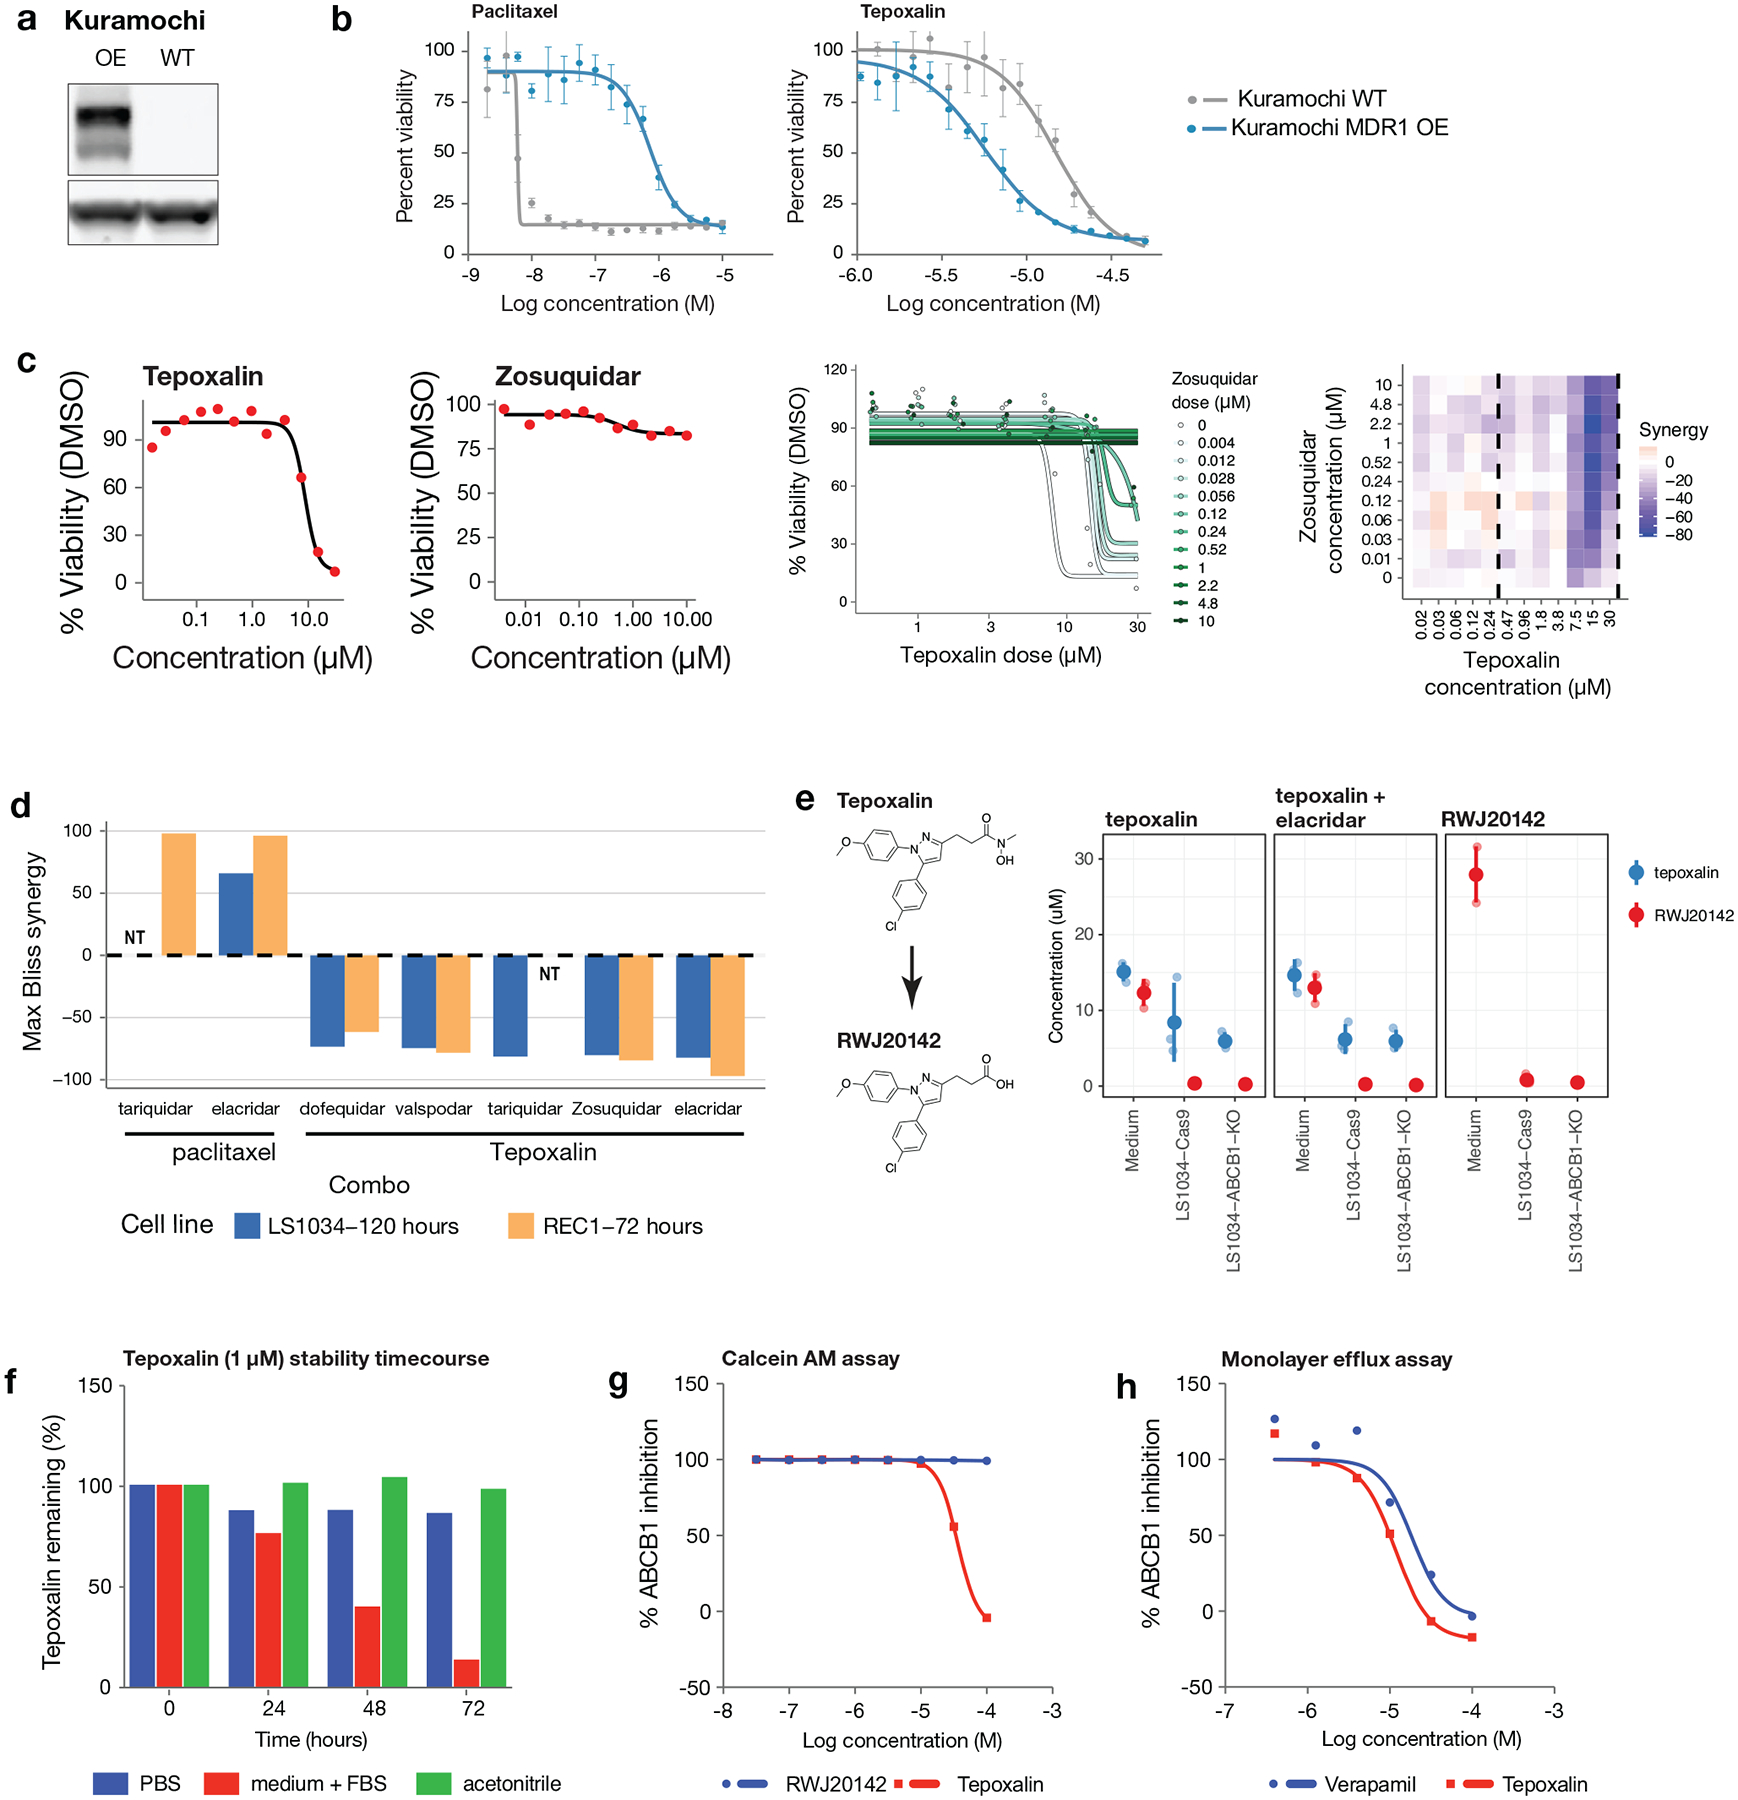
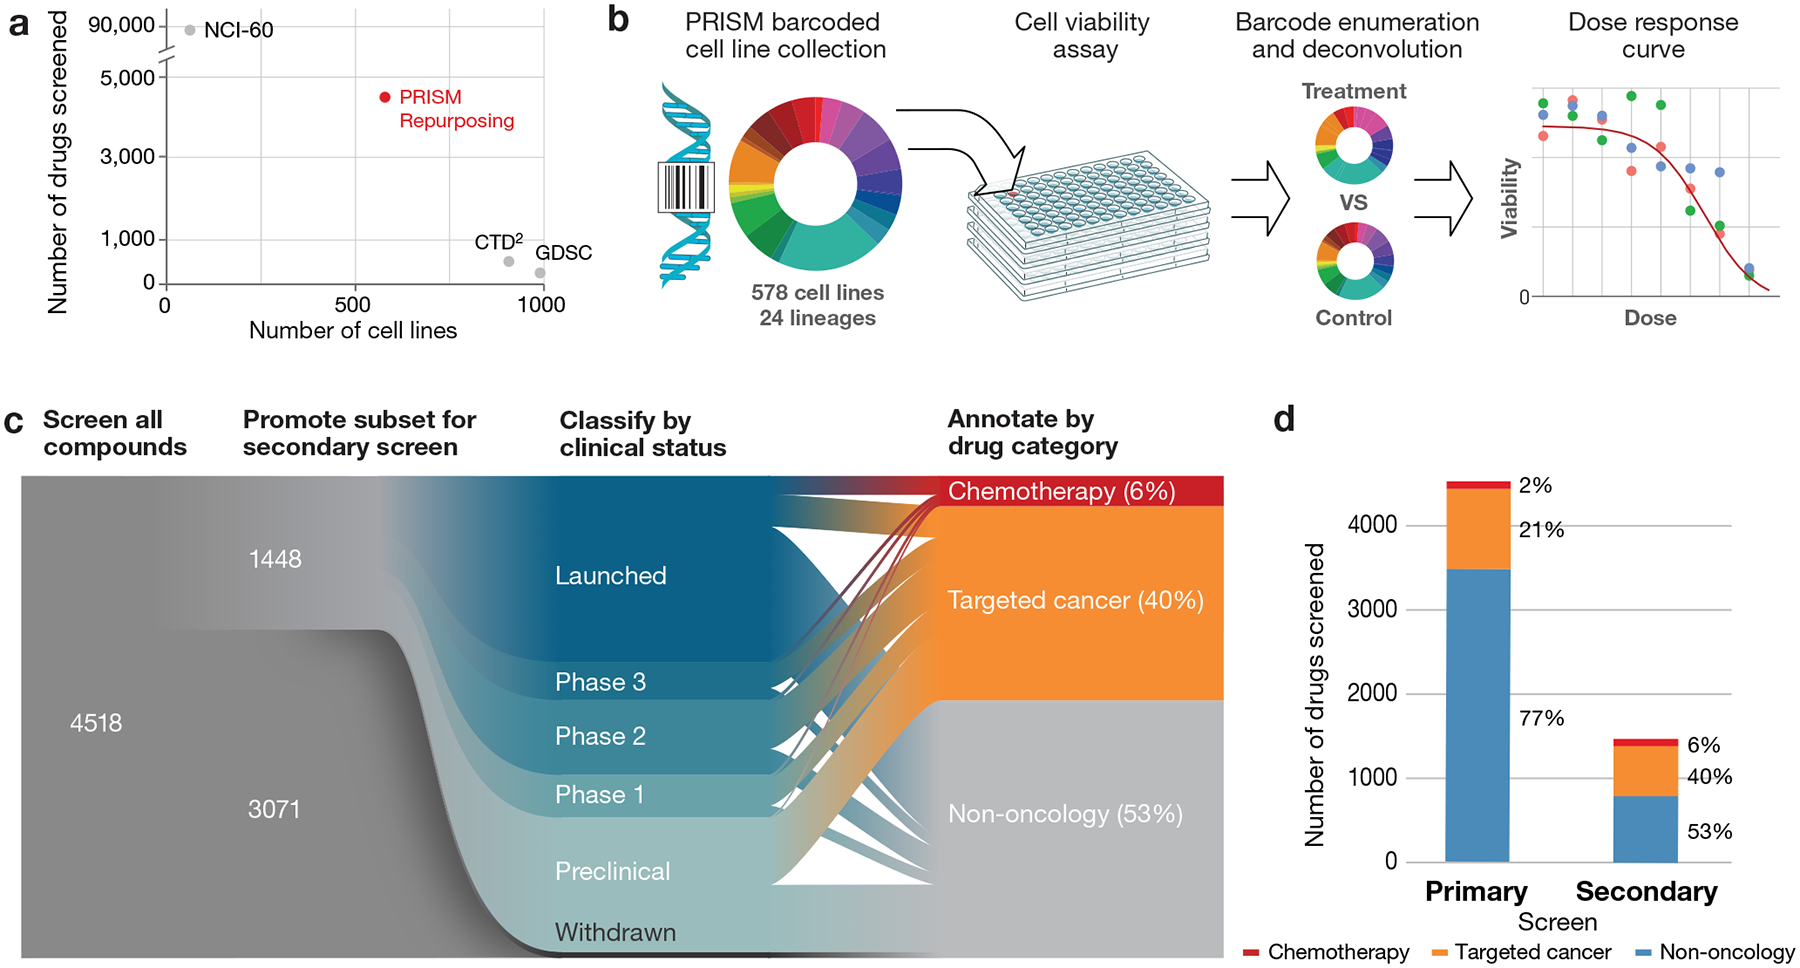
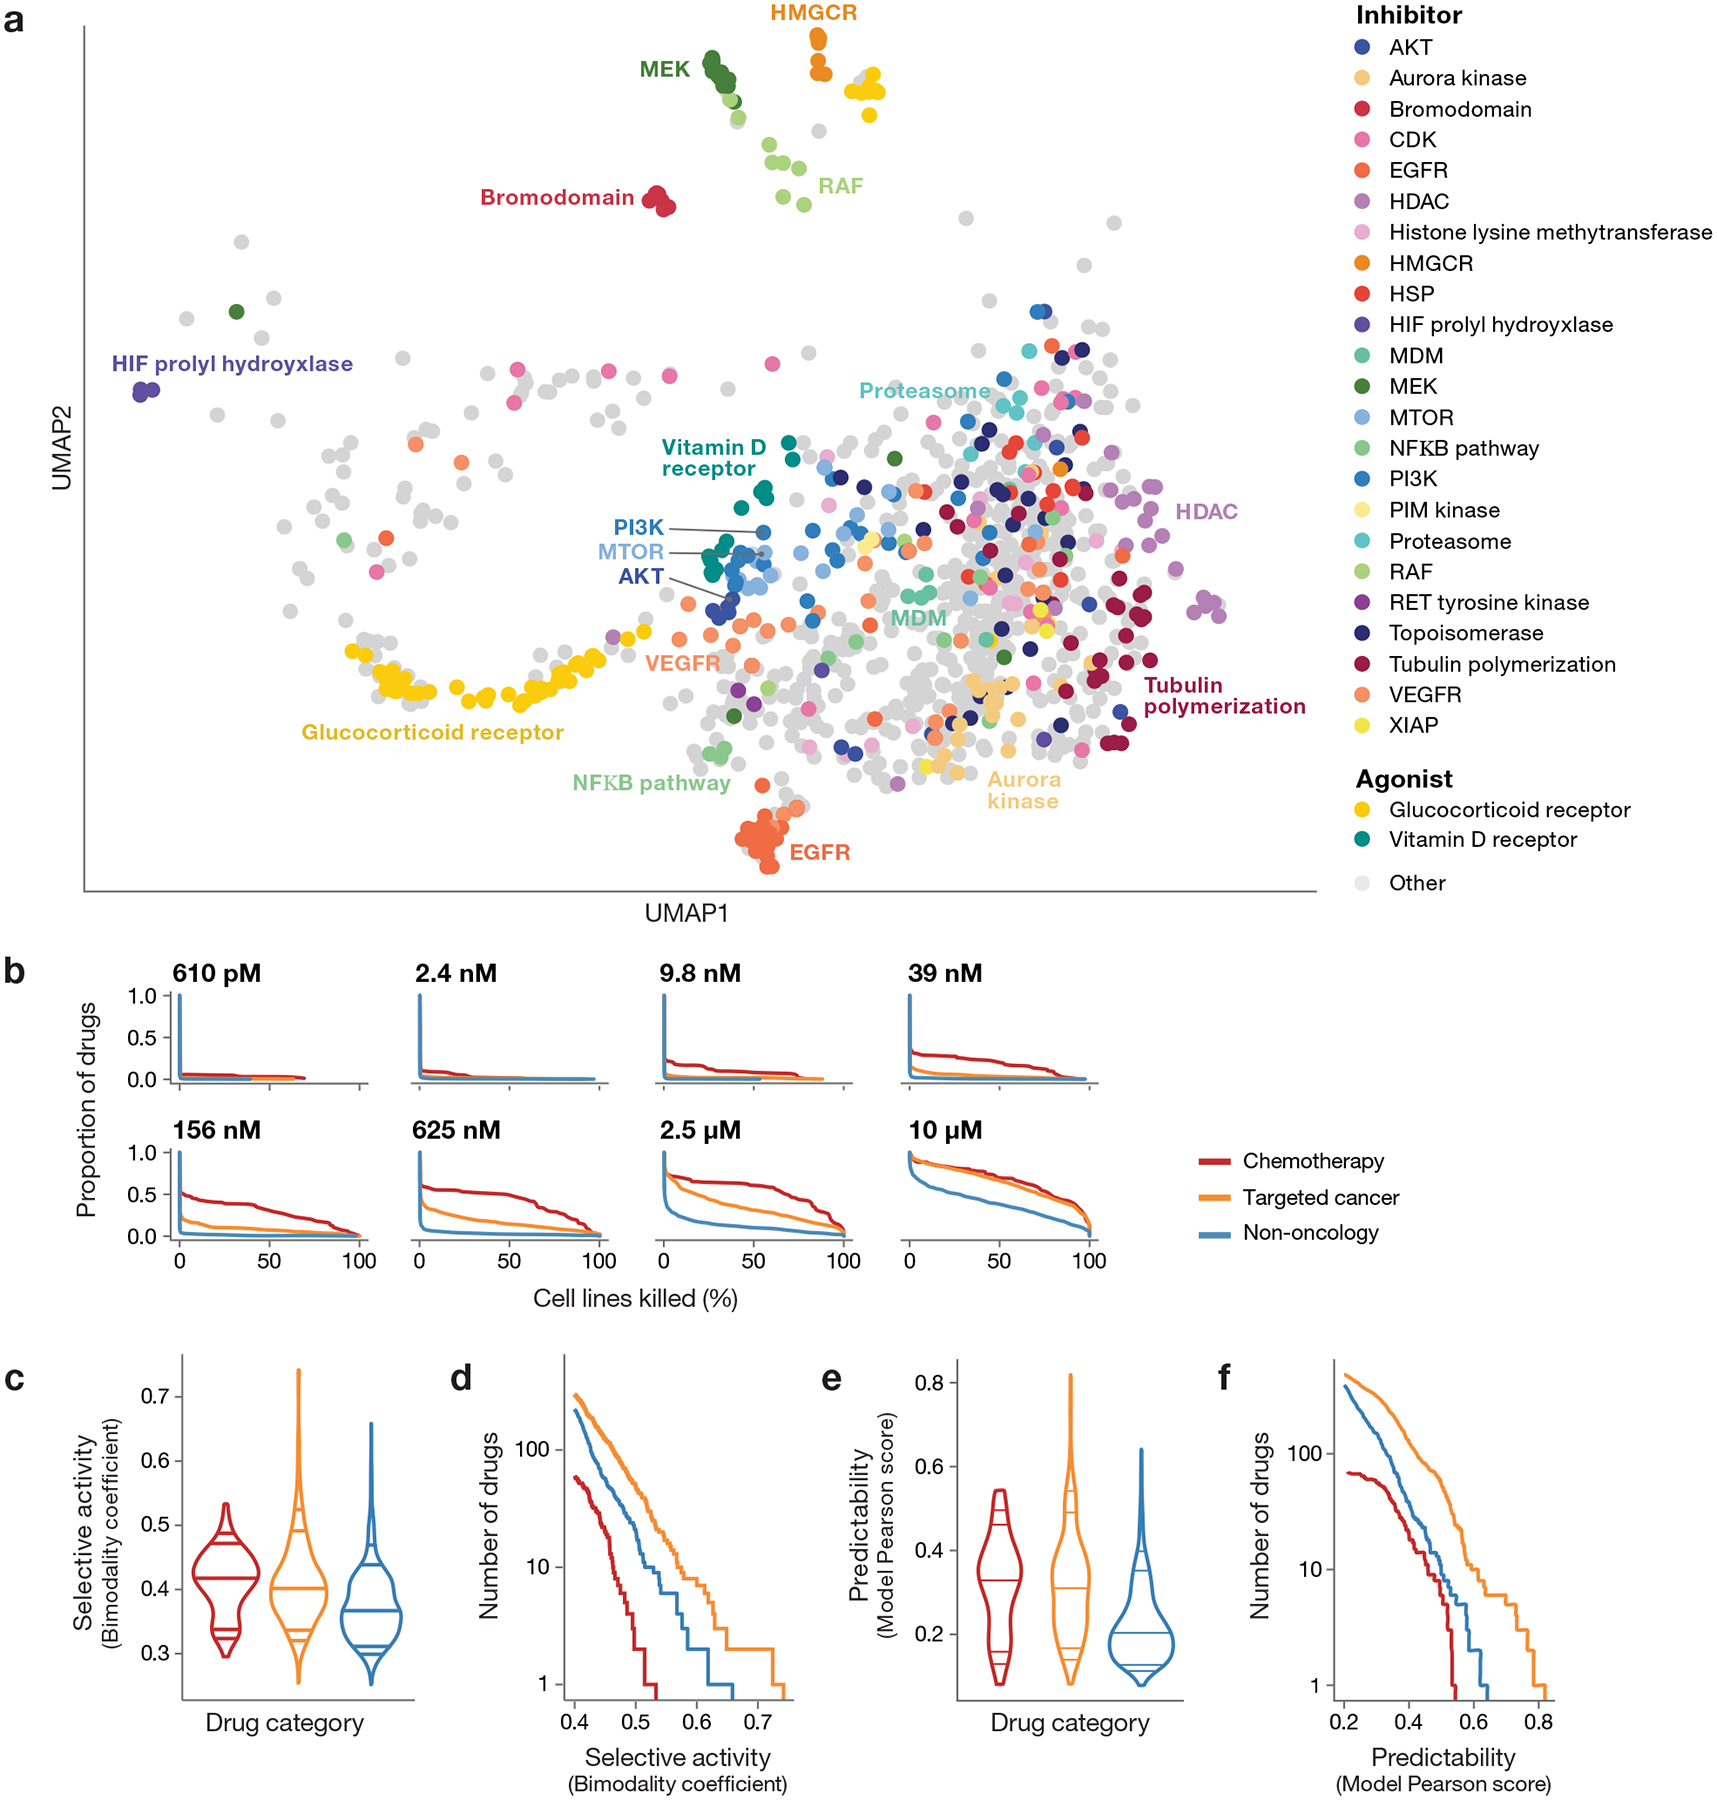
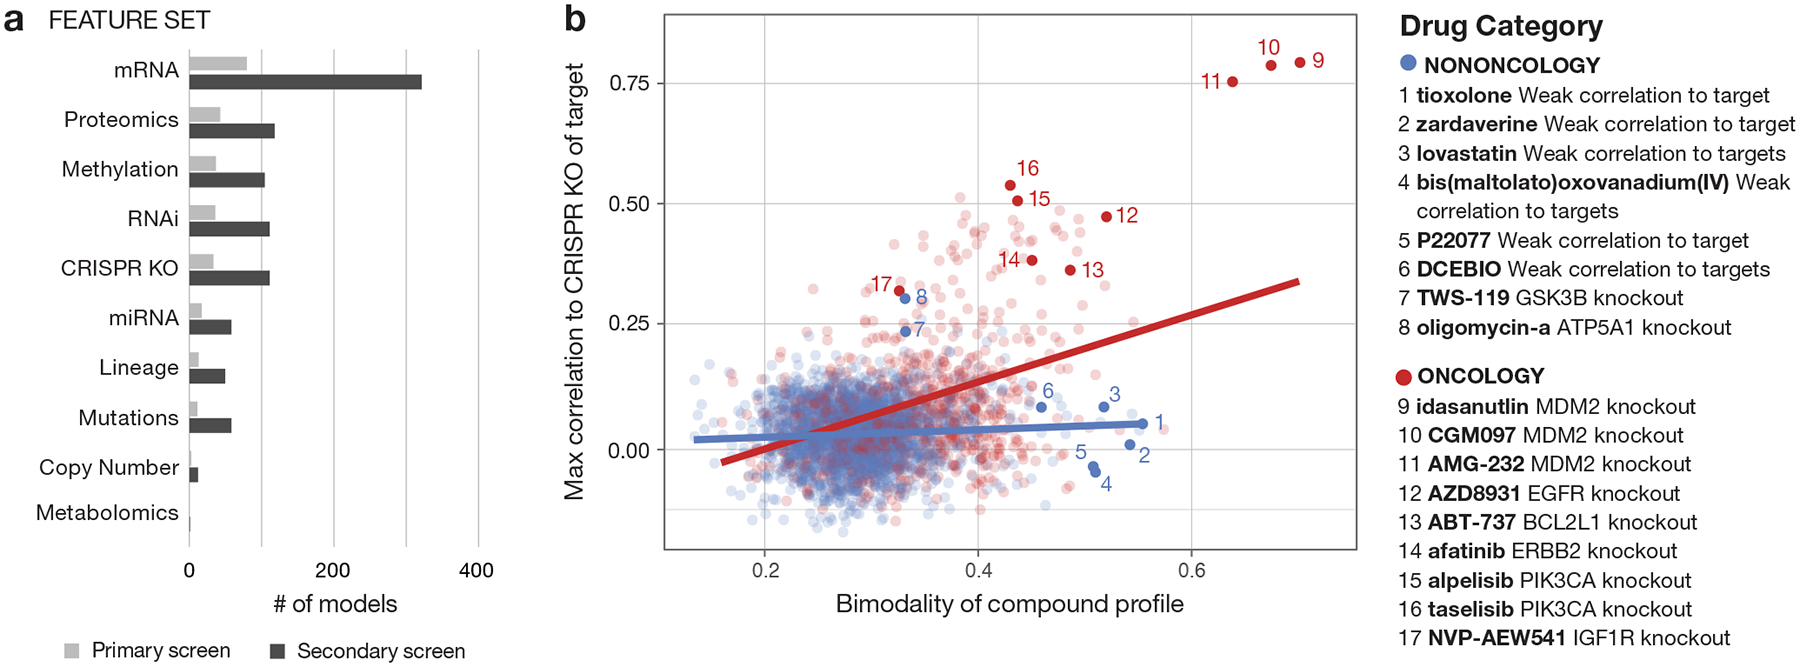
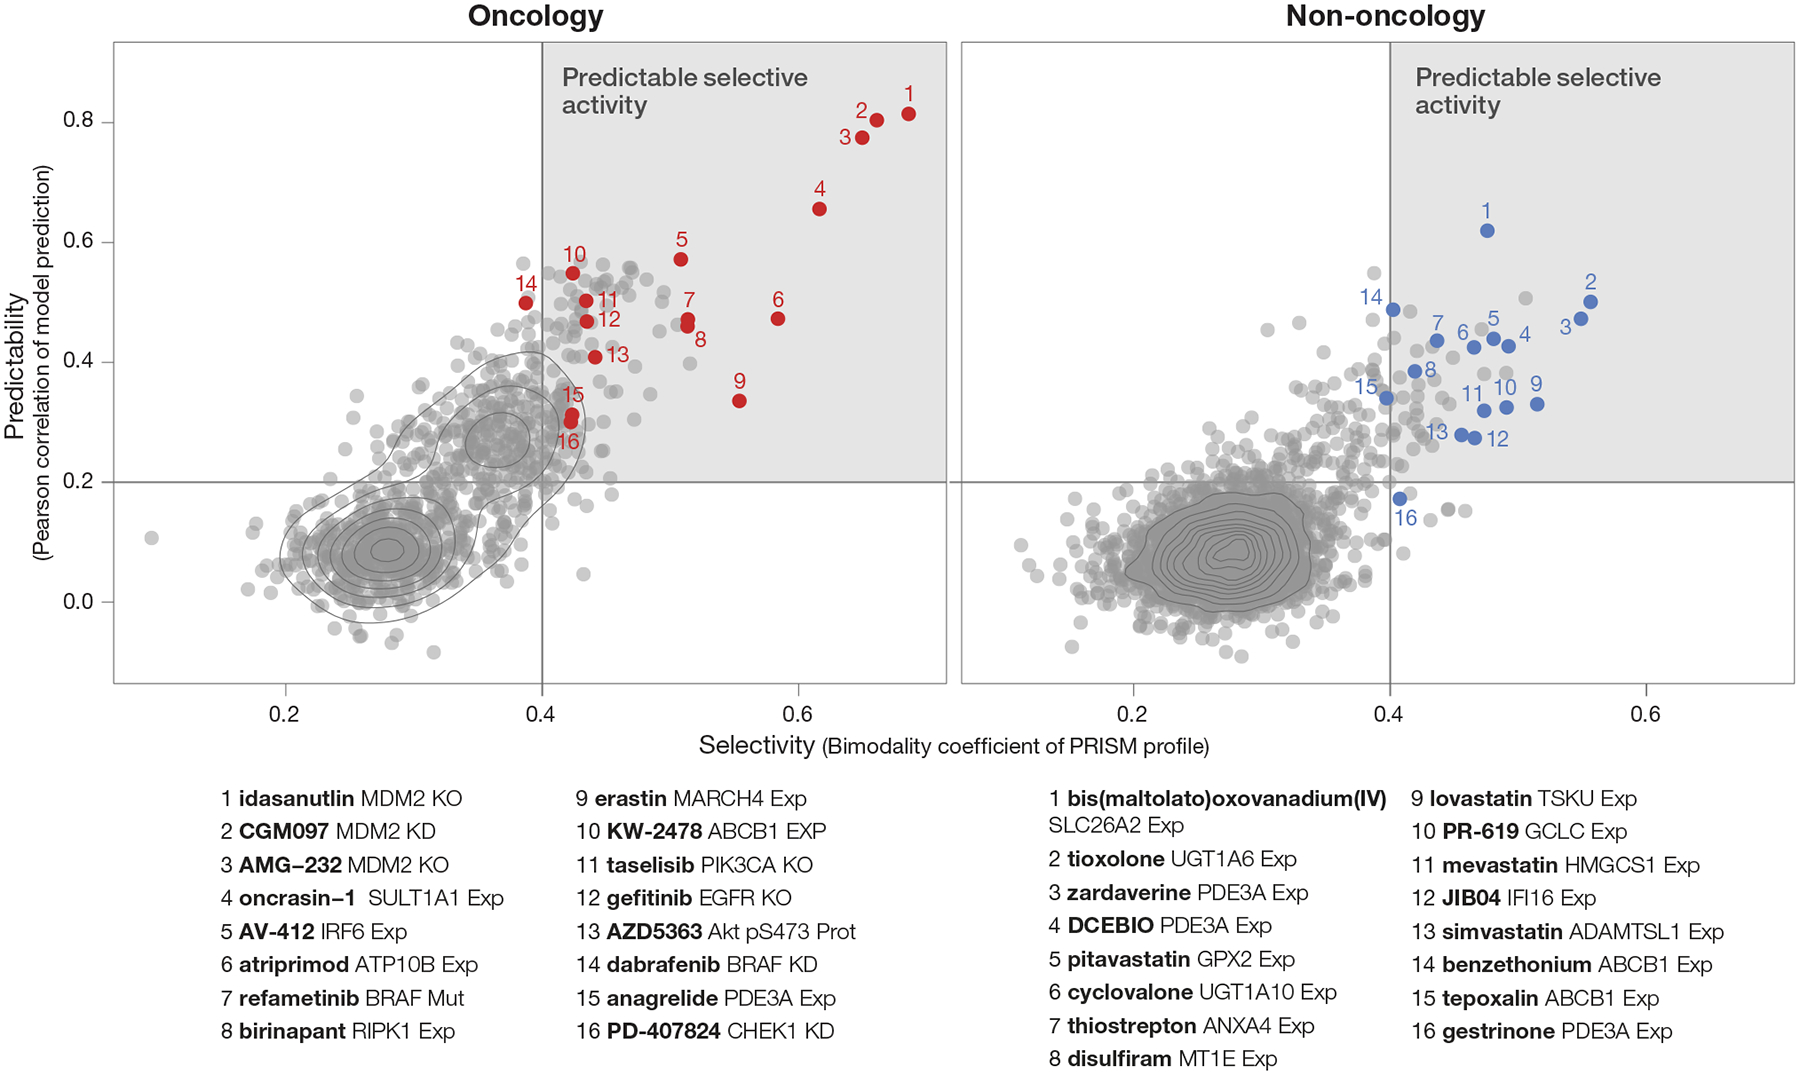
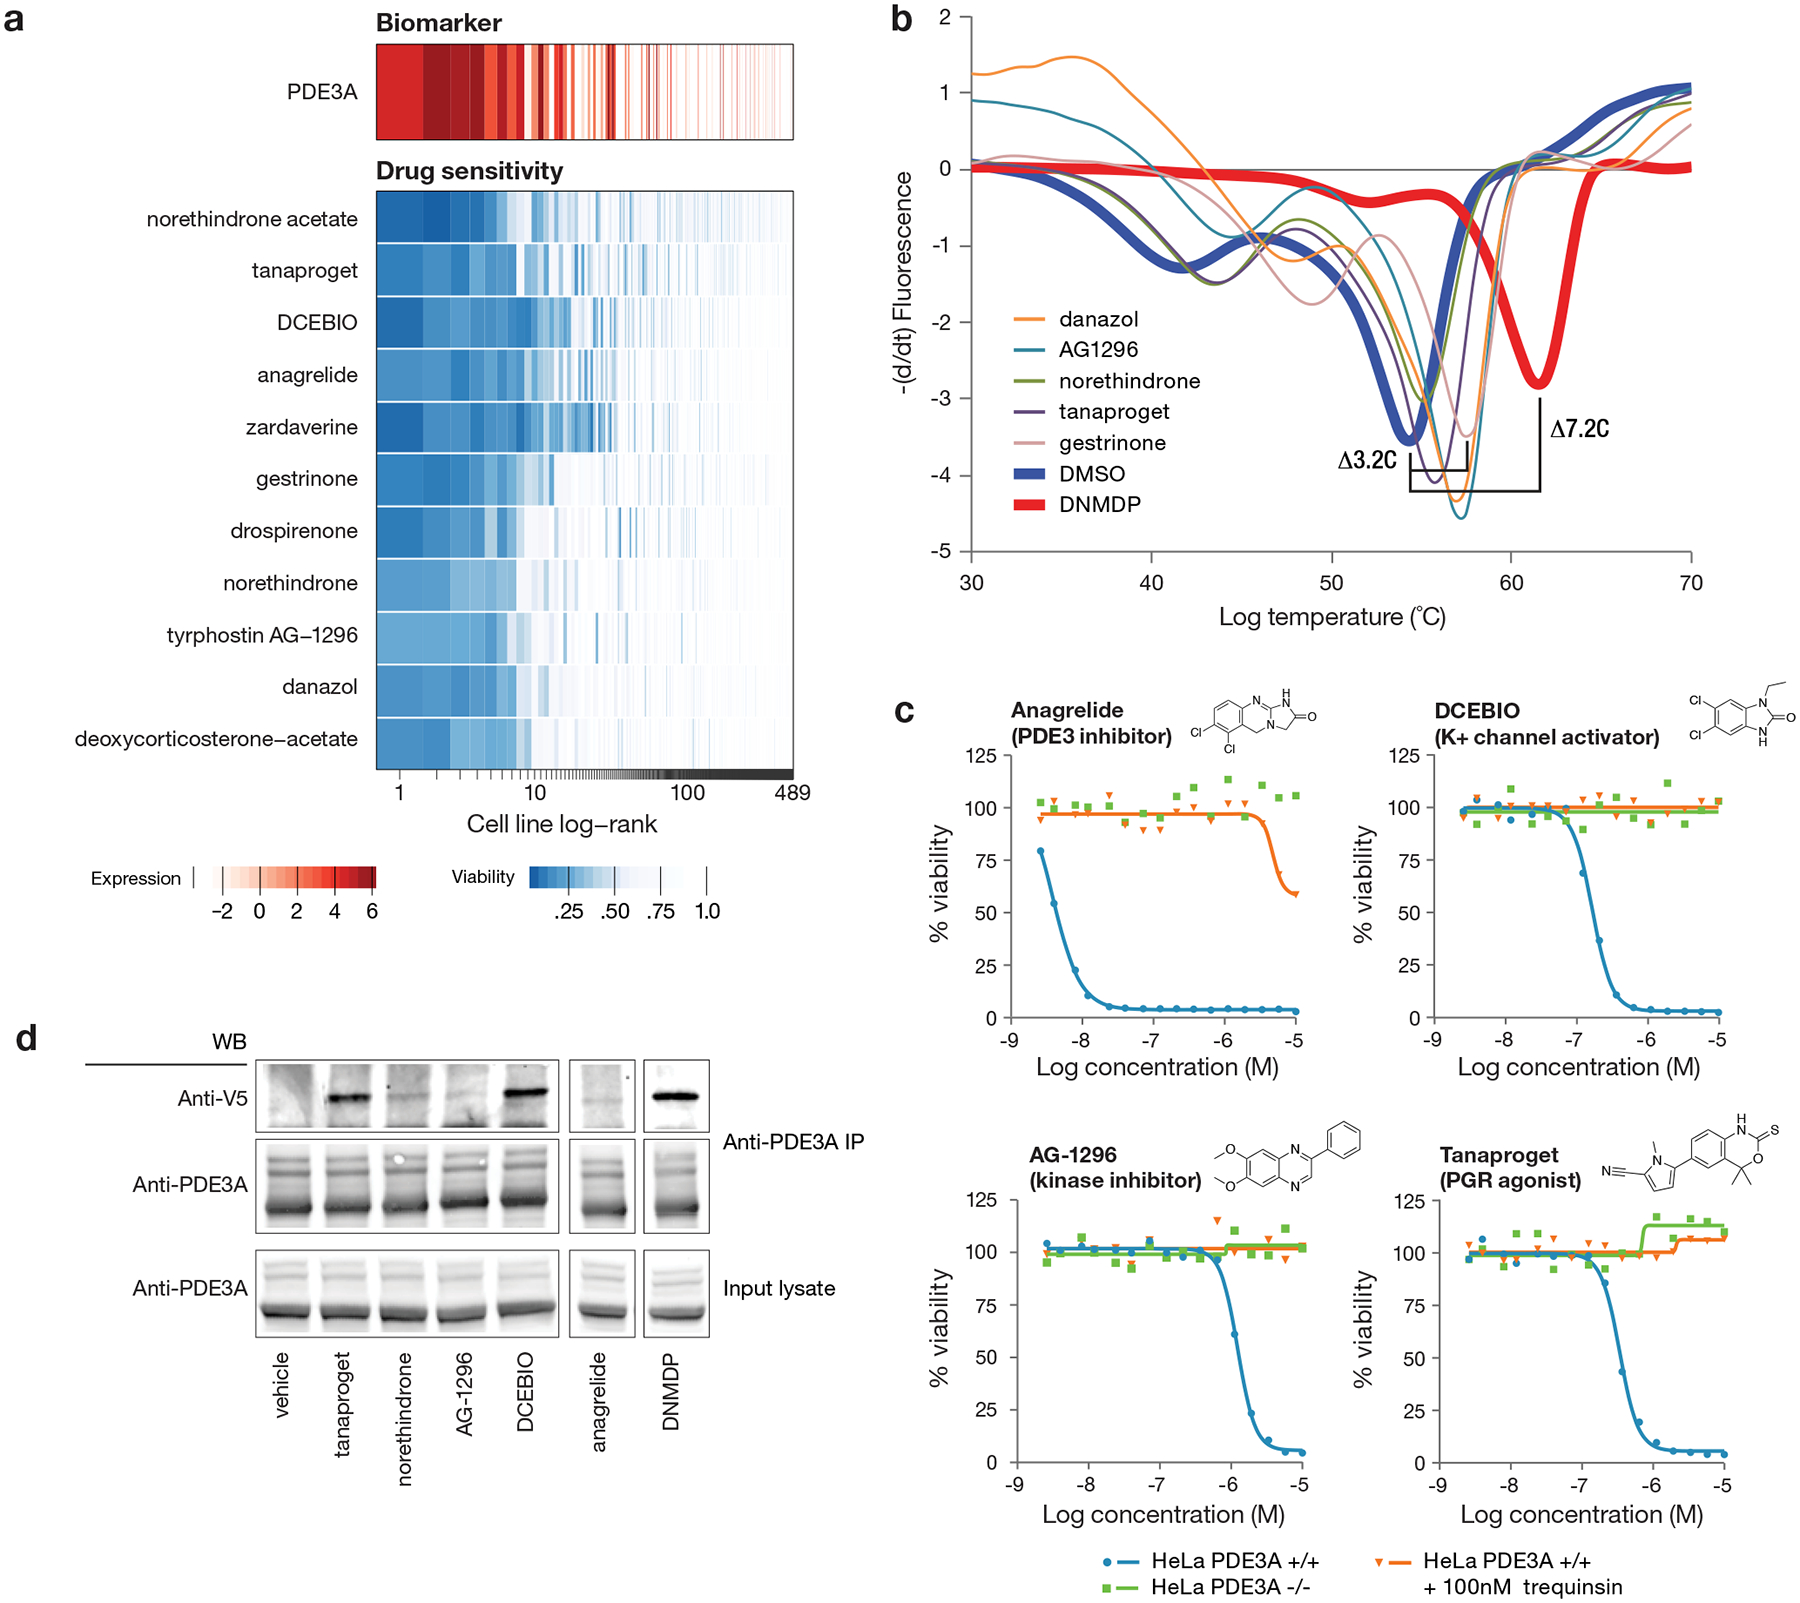
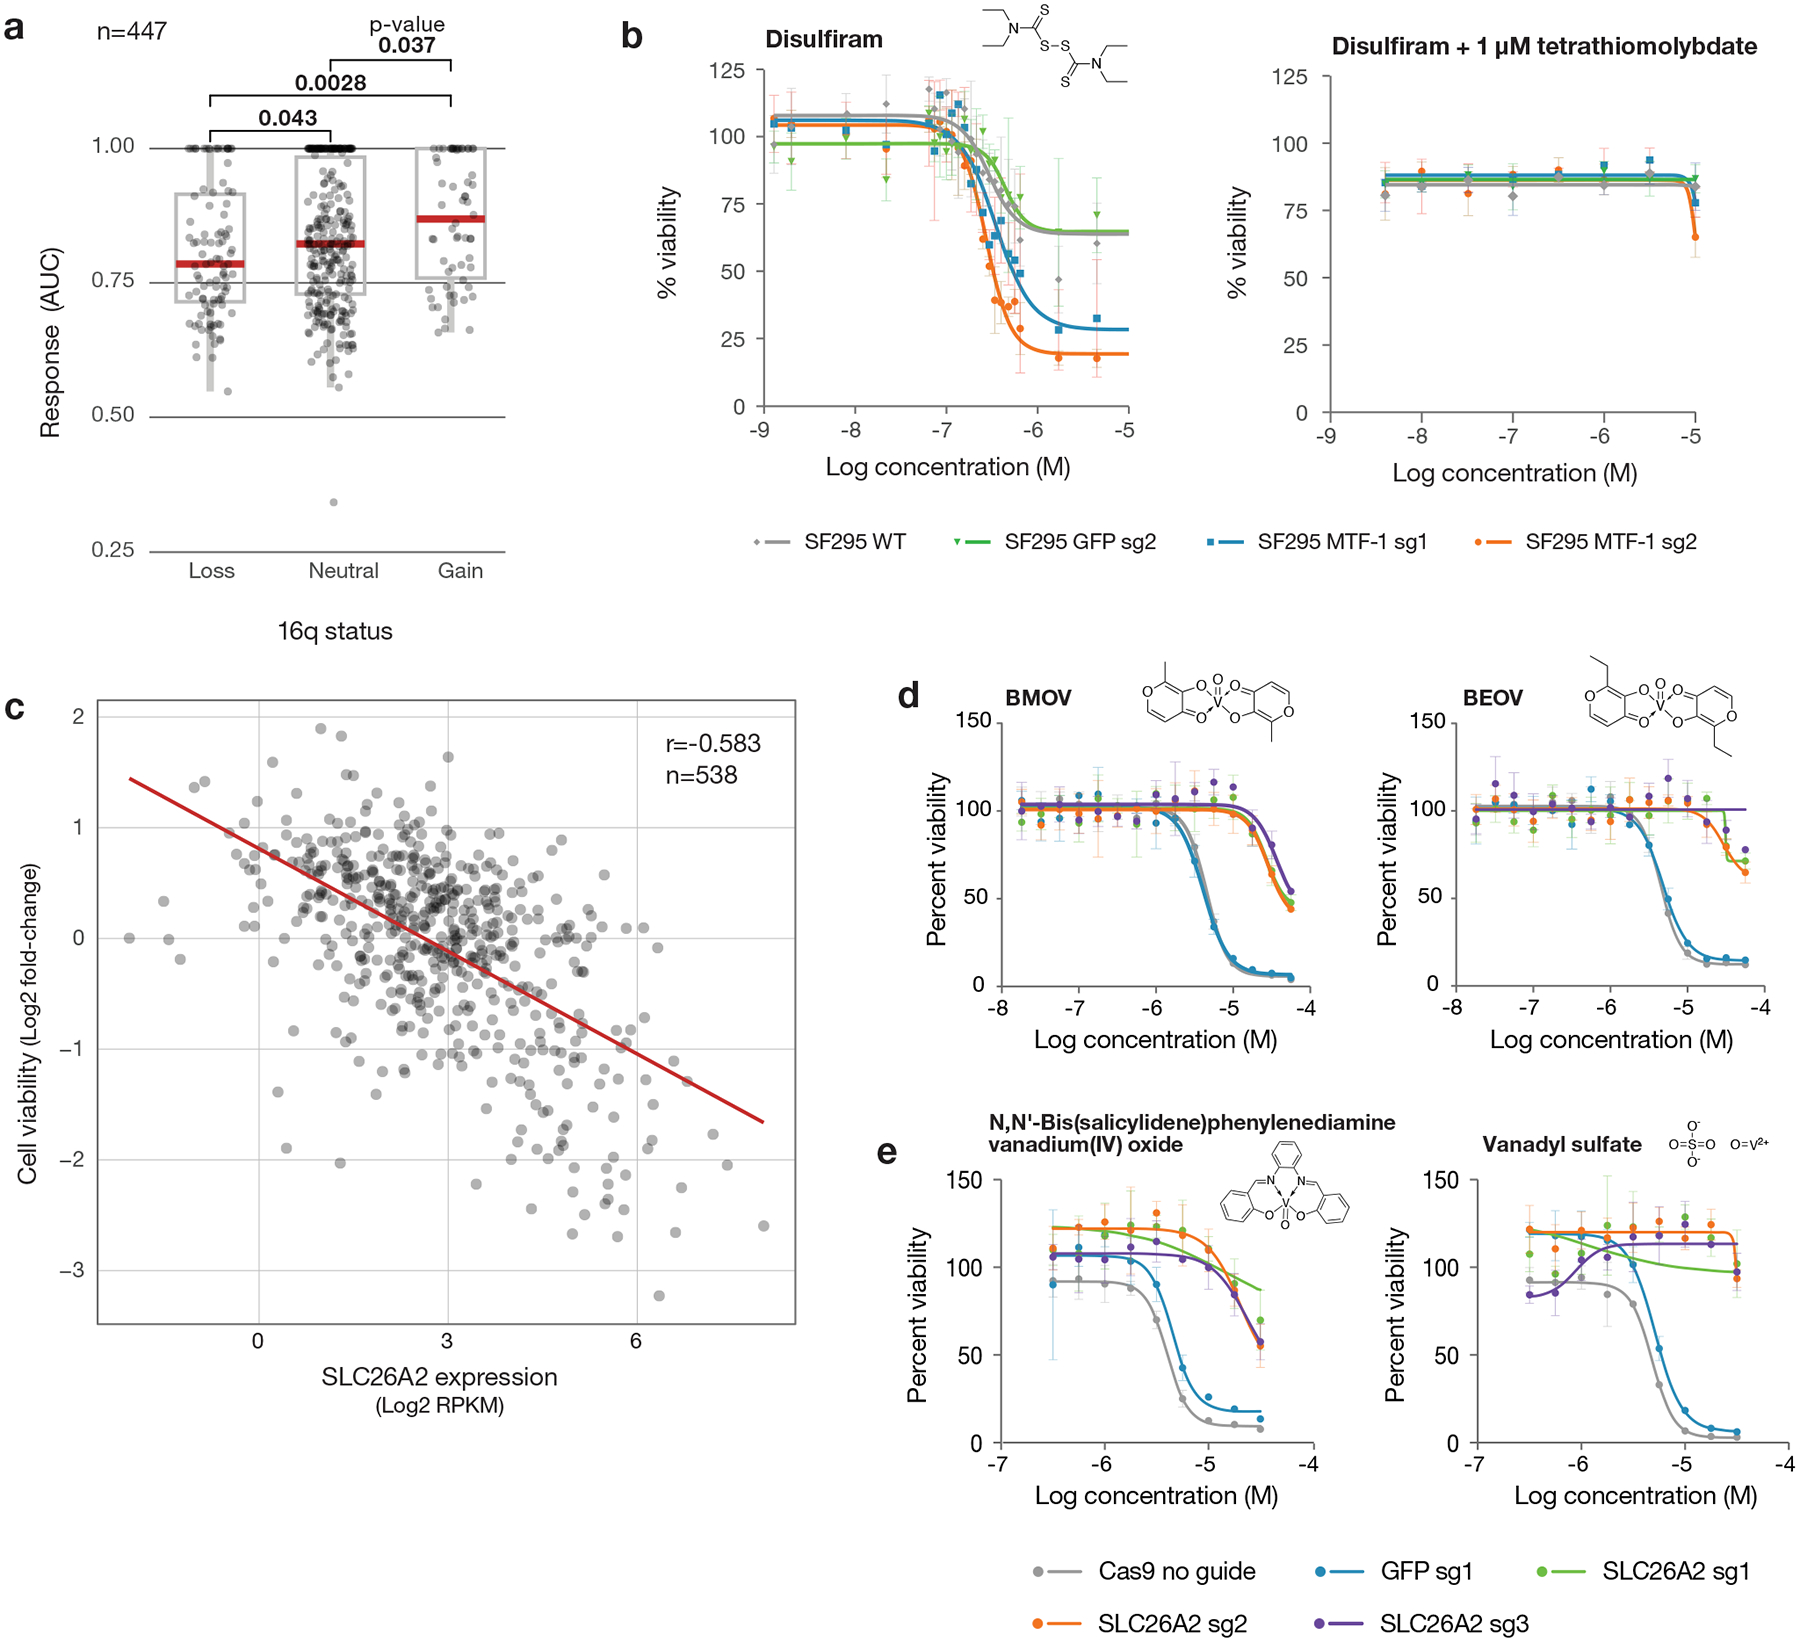
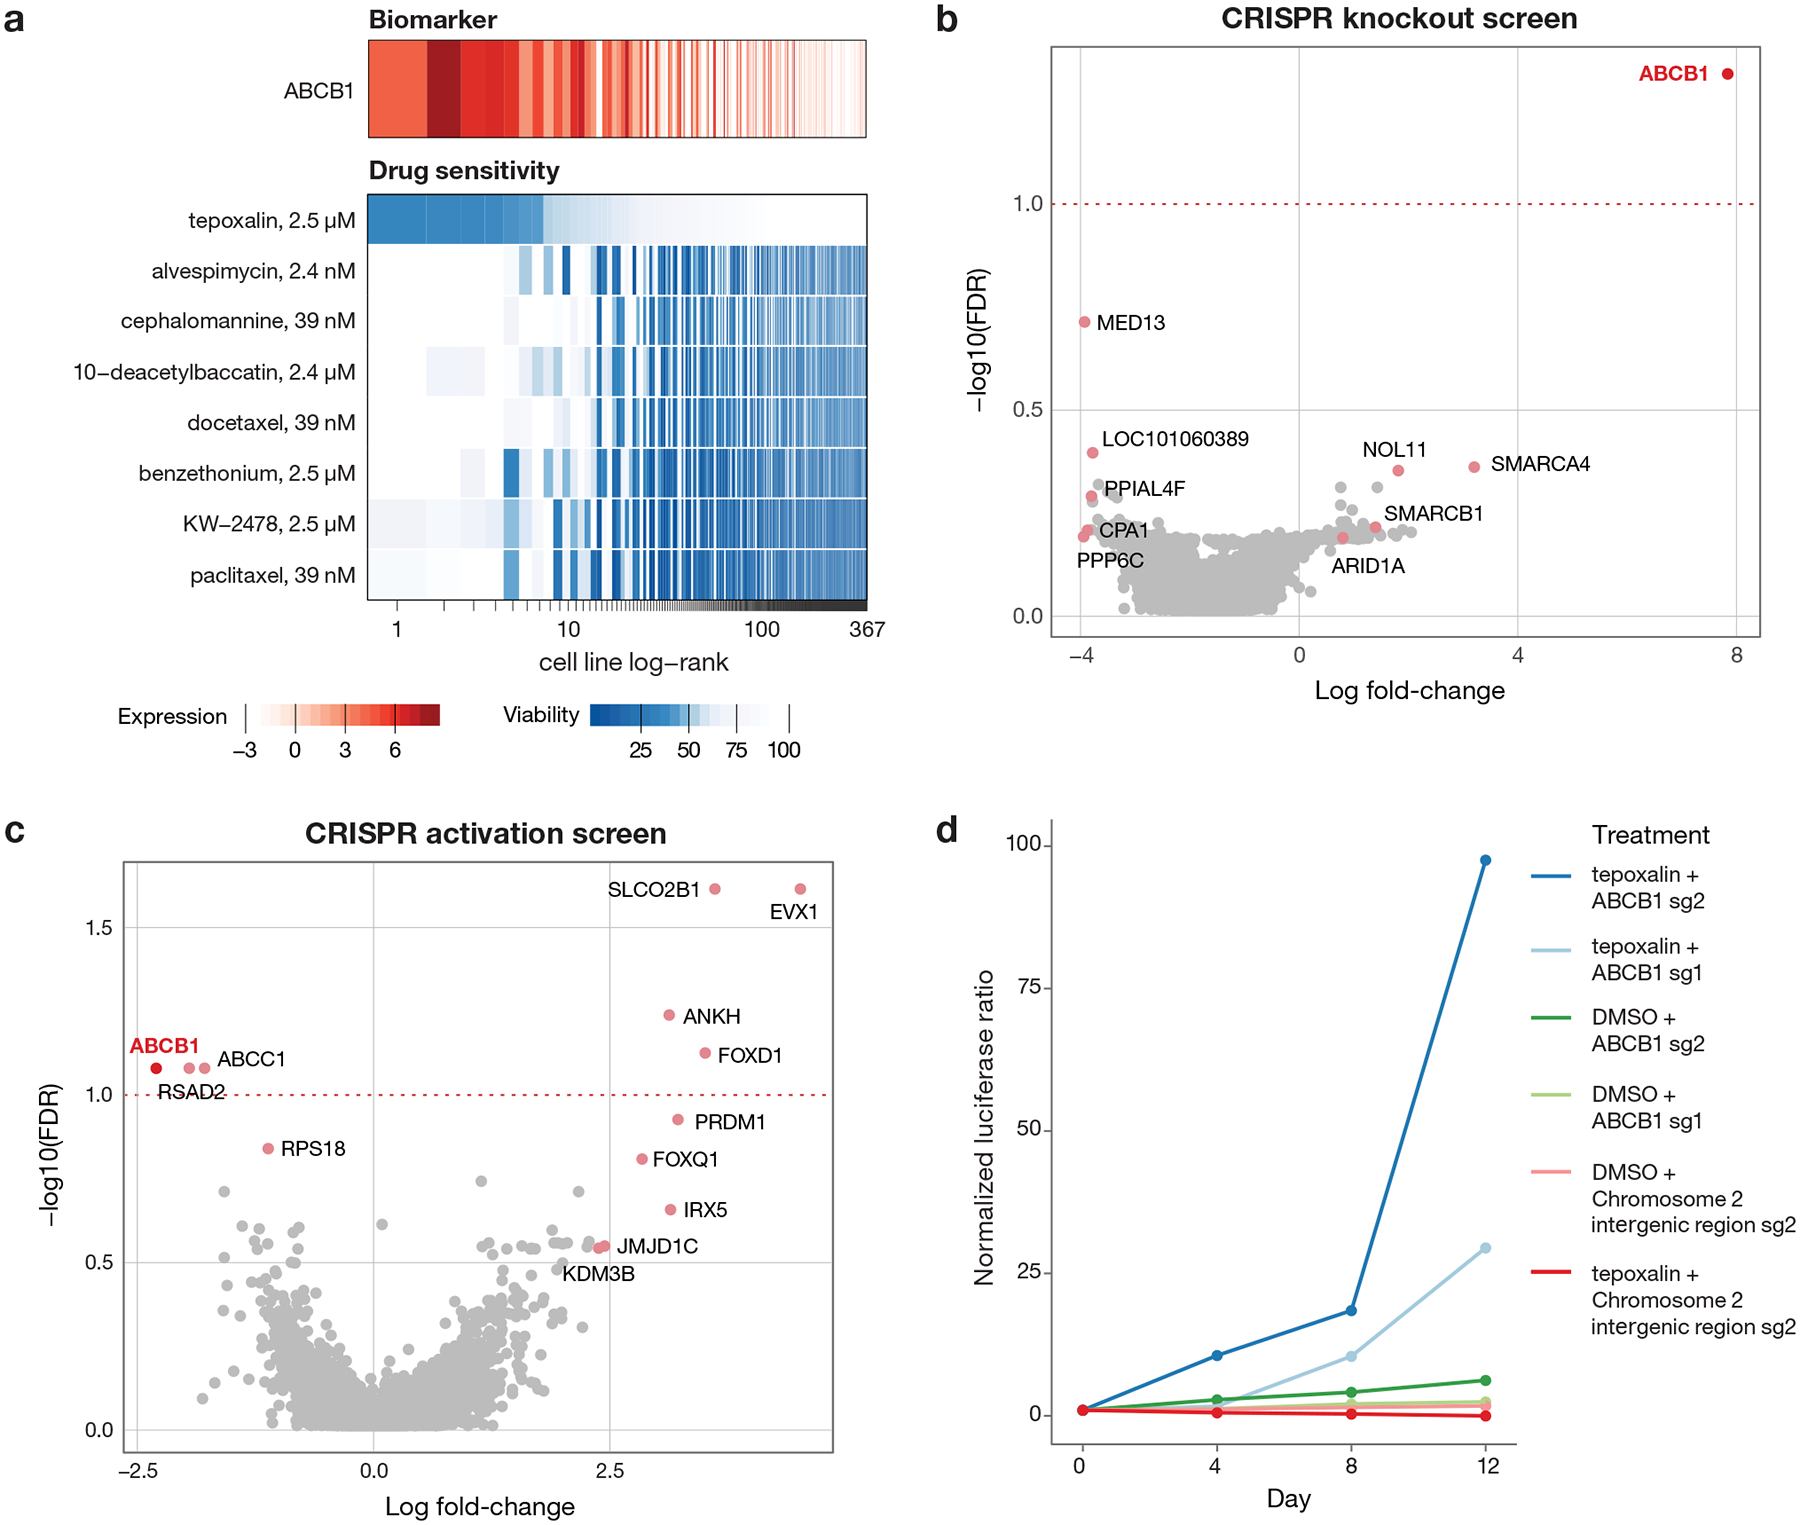
Anti-cancer uses of non-oncology drugs have occasionally been found, but such discoveries have been serendipitous. We sought to create a public resource containing the growth inhibitory activity of 4,518 drugs tested across 578 human cancer cell lines. We used PRISM, a molecular barcoding method, to screen drugs against cell lines in pools. An unexpectedly large number of non-oncology drugs selectively inhibited subsets of cancer cell lines in a manner predictable from the cell lines' molecular features. Our findings include compounds that killed by inducing PDE3A-SLFN12 complex formation; vanadium-containing compounds whose killing depended on the sulfate transporter SLC26A2; the alcohol dependence drug disulfiram, which killed cells with low expression of metallothioneins; and the anti-inflammatory drug tepoxalin, which killed via the multi-drug resistance protein ABCB1. The PRISM drug repurposing resource (https://depmap.org/repurposing) is a starting point to develop new oncology therapeutics, and more rarely, for potential direct clinical translation.


Conflict of interest statement

COMPETING INTERESTS S.M.C, X.W., H.G, M.M., A.S., and T.R.G receive research funding unrelated to this project from Bayer HealthCare. M.M receives research funding from Ono and serves as a scientific advisory board and consultant for OrigiMed. M.M. has patents licensed to LabCorp and Bayer. M.M. and T.R.G. were formerly consultants and equity holders in Foundation Medicine, acquired by Roche. J.A.B. is an employee and shareholder of Vertex Pharmaceuticals. J.G.D. and A.T. consult for Tango Therapeutics. T.R.G. is a consultant to GlaxoSmithKline and is a founder of Sherlock Biosciences. Patent applications for the drug uses detailed in this manuscript have been filed. Other authors declare no competing interests.

Figures

Extended Data Fig. 1
Extended Data Fig. 1. PRISM Repurposing assay and data processing overview
a, Lineage diversity of PRISM cell lines. The 489+ cancer cell lines tested span more than 23 tumor types. Lineages with fewer than 10 cell lines are listed on the right. b, Experimental protocol. Cell lines are grouped by doubling time into pools of approximately 25 cell lines. One pool is plated onto each assay plate. Compounds are transferred by pin transfer from a source compound plate (HTS and HTS002 screens), or cells are plated directly onto assay-ready plates generated by acoustic dispensing of compounds (MTS004, MTS005, and MTS006 screens). In either case, compound plates are shared by all replicates of each treatment condition. After incubation and lysis, all assay plates generated by a given compound plate are grouped and collapsed into 3 (HTS002, MTS005, and MTS006 screens) or 6 (HTS, MTS004 screens) detection plates so that each detection plate receives 1 or zero copies of each pool. Ten control barcodes are then spiked into each detection plate well (HTS002, MTS005, and MTS006 screens). Detection plates are amplified by PCR and detected using Luminex FLEXMAP 3D instruments. c, Data processing workflow. Median Fluorescence Intensity (MFI) values are calculated from fluorescence values for each replicate-condition-cell line combination and are log2-transformed. Assay plates wells are normalized, median-collapsed, and compared to the normalized medians of other assay plate wells in the same well position that have been dosed by the same compound plate. A robust z-score is calculated, and assay plate wells with a |z-score| > 5 are filtered. Strictly standardized mean differences (SSMD) are calculated between positive and negative control conditions for each cell line on each assay plate. Cell line-assay plate combinations with SSMD < 2 are filtered by a control-separation filter to generate the log MFI data matrix. In datasets with control barcodes added, data are normalized with respect to the median of control barcodes to generate the MFI normalized data matrix. Data are DMSO-normalized and pooling artifacts are corrected using ComBat to generate the log fold-change data matrix. Up to 3 independently treated plates (range 1–3 based QC filtering) in one screen are median-collapsed to generate the collapsed log fold-change data matrix.
Extended Data Fig. 2
Extended Data Fig. 2. Outlier pool QC filter to detect pool-level failures
a, Primary screen QC pass rate by pool. The fraction of treated assay plate-wells that pass the outlier filter is indicated. Cell line log MFI data are median-centered, and the medians of assay plate-wells are compared within each well-detection plate combination. Extreme outliers with |robust z-score| > 5 are filtered. b, Primary screen QC pass rate by detection plate. c, Primary screen QC pass rate of assay plates. Overall pass rate was high (median 98.6%, minimum 83.8%). d, Secondary screen QC pass rate by pool. e, Secondary screen QC pass rate by detection plate. The pass rate is above 95% for 81% of detection plates. f, Secondary screen QC pass rate by plate-pool combinations. 3 replicate plates are combined for visualization. Overall pass rate was high (median 99.1%, mean 94.3%), where failures are almost exclusively coming from 7 detection plates, implying failure at final detection step. Across the screen, 5.7% of the pools are filtered out as outliers.
Extended Data Fig. 3
Extended Data Fig. 3. Control-separation QC filter to detect cell line failures
aa, Primary screen QC pass rate by cell line. SSMD of log MFI values is calculated between positive control and negative control treatments for each cell line on each plate. Data from cell line-plates with SSMD < 2 are filtered. b, Primary screen QC pass rate by detection plate. c, Primary screen QC pass rate of assay plates. Overall pass rate was high (median 99.2%, mean 94.3%). Some detection plates show higher failure rates for specific detection pools, implying failure at final detection step. The bulk of the filtered data was from two detection plate-detection pools (PREP013_X2 and PREP003_X1 in detection pool 8). d, Secondary screen QC pass rate by cell line. SSMD of log MFI values is calculated between positive control and negative control treatments for each cell line on each assay plate. Data from cell line-plates with SSMD < 2 are filtered. e, Secondary screen QC pass rate by detection plate. f, Secondary screen QC pass rate of assay plates. Overall pass rate was lower than primary (median 99.88%, mean 79.1%). Similar to the primary screen, the main mode of failure is platewise failures.
Extended Data Fig. 4
Extended Data Fig. 4. Number of well replicates passing QC in the PRISM screens
a, Number of individual cell assay well replicates (max n = 3) that pass QC filters in the primary screen, grouped by compound plate and cell line quality. 86% (497 out of 578) of the cell lines have at least one passing replicate for all compound plates. Identity of cell lines with lower quality data are listed at the bottom. b, Number of individual cell assay well replicates (max n = 3) that pass QC filters in the secondary screen. 95% (463 out of 489) of cell lines have at least 1 passing replicate on at least 85% (30 out of 35) of the compound plates.
Extended Data Fig. 5
Extended Data Fig. 5. Comparison of PRISM viability data to reference datasets
a, Pairwise Pearson correlations between drug response AUCs of publicly available datasets. AUC values were recomputed for 84 compounds and 318 cell lines (median 236 cell lines per compound) over the same dose-range for each compound-cell line pair in all 3 datasets (GDSC, CTD2, REP), and capped at 1. The Pearson correlation across shared compound-cell line pairs of the datasets is above 0.6. 44.8% of cell line-compound pairs show inactivity (AUC > 0.8) in all three datasets (n = 16650 compound-cell line pairs). b, Pairwise Pearson correlations between drug response AUCs after removing inactive cell line-compound pairs. Pearson correlations were re-calculated after filtering out the inactive data points (AUC > 0.8 in at all three datasets) (n = 9188 compound-cell line pairs). c, Compound-wise correlation between publicly available datasets. Correlation between PRISM data and other datasets is similar to correlation between other datasets. Points represent Pearson correlations and error bars represent 95% confidence intervals computed using Fisher’s z-transform. GDSC vs. CTD2 is in blue and REP vs. GDSC/CTD2 is in red. The number of cell lines shared by all three datasets is shown after each drug name. Paired t-tests on compound-wise correlations show statistically significant (two-sided p-value: 0.012 and 0.014 for top and bottom, respectively) but small mean of differences (0.049 and 0.039 for top and bottom, respectively). The number of data points used to compute each correlation is given in the figure for each compound.
Extended Data Fig. 6
Extended Data Fig. 6. PRISM Repurposing noise quantification
a, Cell line standard error estimates across vehicle-treated wells on PRISM plates treated with DMSO (n = 489 cell lines). Log fold-change standard errors are estimated for each cell line using DMSO-only plates included in the MTS006 screen (n = 384 × 3 replicate wells for each cell line). b, Comparison of standard error estimates across screens. The error estimate calculation is repeated for each screen using DMSO wells on standard compound plates (n = 32 replicate wells per plate), except for MTS006, which uses DMSO-only plates (n = 384 replicate wells per plate). Higher noise levels are observed in the initial high-throughput screens HTS001 (n = 578 cell lines) and HTS002 (n = 489 cell lines) compared with the medium-throughput screens MTS004 (n = 578 cell lines), MTS005 (n = 489 cell lines), and MTS006 (n = 489 cell lines). Upper box limits, center lines, and lower box limits correspond to 75th, 50th, and 25th percentiles, respectively. Whiskers extend from the box limits to the most extreme value up to 1.5 IQR from the median. All cell lines are depicted as points, regardless of outlier status. c, Comparison of estimated standard error of vehicle control wells between high-throughput pharmacogenomic datasets. The average standard error across cell lines (n = 301 cell lines for PRISM versus CTD2 and n = 197 for PRISM versus GDSC) is indicated by dashed lines with standard deviation in parentheses. d, Relationship between drug selectivity and replicate reproducibility in PRISM. Average Pearson correlation between replicates for each compound, dose, and screen combination is stratified by mean bimodality coefficient. For comparison, the null distribution for randomly paired compounds is shown in blue.
Extended Data Fig. 7
Extended Data Fig. 7. Generation of knockout cell lines by CRISPR/Cas9 editing
a, SF295 cells were transduced with multiple guides targeting the MTF-1 gene. Following selection, genomic DNA was isolated, and the targeted region was amplified by PCR. Results from the NGS CRISPR assay are shown as percent indel formation. b, Differentially expressed genes in SF295 glioma cells following MTF-1 knockout by CRISPR/Cas9. Loss of MT1E, MT1X, and MT2A expression was observed upon MTF-1 knockout. Gene expression across three independent cell wells per cell line were measured by mRNA sequencing. Two-sided p-values for differential gene expression following MTF-1 knockout vs. parental cell line were calculated with DESeq2 and corrected for multiple hypothesis testing using the Benjamini-Hochberg method. c, Drug sensitivity of SF295 cells with and without MTF-1 knockout. MTF-1 does not alter sensitivity to control chemotherapeutic bortezomib. Mean viability across 3 independently treated wells is shown, with standard deviation indicated by error bars. d, Western immunoblot validation of SLC26A2 knockout in OVISE ovarian and A2058 melanoma cancer cell lines. The SLC26A2 protein is known to migrate across a range of molecular weights due to glycosylation. Results are representative of two independent experiments. e, OVISE cells were transduced with multiple guides targeting the SLC26A2 gene. Indel frequency at the SLC26A2 CRISPR Cas9 cut sites was assessed by NGS CRISPR assay. f, ABCB1 western blot with and without CRISPR knockout of ABCB1 in the LS1034 colon cancer cell line. Western blot was performed once. g, Percent indel formation at genomic cut site in LS1034 ABCB1 CRISPR knockout lines assessed by NGS CRISPR assay. h, Cellular viability of LS1034 CRISPR knockout lines after treatment with tepoxalin for 5 days. Mean viability across 3 independently treated wells is shown, with standard deviation indicated by error bars.
Extended Data Fig. 8
Extended Data Fig. 8. Tepoxalin mechanistic studies
a, ABCB1 western blot with and without overexpression of ABCB1 in the Kuramochi ovarian cancer cell line. Western blot was performed once with three independent samples. b, Cellular viability of Kuramochi wild type and ABCB1-overexpressing cells after treatment with tepoxalin for 8 days. Mean viability across 3 independently treated wells is shown, with standard deviation indicated by error bars. c, (Left) Single-agent dose-response curves for LS1034 cells treated with tepoxalin and zosuquidar for 5 days. Two replicates were averaged. (Middle) Dose response curves for tepoxalin in combination with varying doses of zosuquidar (indicated by different colors) for 5 days. Data are shown for tepoxalin doses above 470 nM (the range indicated by the vertical dashed lines above). (Right) Bliss synergy scores estimated for each dose combination, showing strong antagonism by zosuquidar at tepoxalin doses above ~5 μM. Two combinations were not tested (NT). d, Maximum synergy score is shown across several drug combinations measured in both LS1034 and REC1 cell lines. Both tariquidar and elacridar were strongly synergistic in combination with paclitaxel, while all MDR1 inhibitors tested were antagonistic in combination with tepoxalin. e, Cellular permeability study of tepoxalin and RWJ20142 in LS1034 colon cancer cell lines with and without ABCB1 knockout. Each indicated cell line or media-only control was treated with 20 μM tepoxalin or RWJ20142 for 3 hours. Tepoxalin and RWJ20142 concentrations in cell lysate or medium were determined by liquid chromatography-mass spectrometry. Mean viability across 3 independently treated wells is shown, with standard deviation indicated by error bars. Shaded dots indicate underlying data. f, Stability study of tepoxalin in three different vehicles over 72 hours. Percent of tepoxalin remaining is indicated at each timepoint. g, ABCB1 antagonism assay using calcein AM fluorescence. MDCKII cells were treated with indicated concentration of tepoxalin or RWJ20142. Mean percent ABCB1 inhibition across 3 replicates is shown. h, ABCB1 transport-based activity assay. Basolateral transport of the ABCB1 substrate loperamide was assessed using a monolayer of MDCK-ABCB1 cells in the presence of tepoxalin or verapamil. Mean percent ABCB1 inhibition across 2 replicates is shown.
Fig 1.
Fig 1.. Generation of the PRISM Repurposing dataset
a, Dimensionality of publicly available pharmacogenomic drug screening experiments. The PRISM Repurposing dataset contains approximately ten-fold more compounds than CTD2 and approximately ten-fold more cell lines than NCI-60. b, PRISM method overview. Barcoded cell lines are pooled in groups of 25 and treated with chemical perturbagens. Pools are lysed 5days after perturbation and the relative abundance of mRNA barcodes is measured using Luminex MagPlex Microspheres to estimate cell viability. c, Repurposing screen workflow. A primary screen of 4,518 drugs was performed at 2.5 μM, followed by retesting of 1,448 active drugs at 8 doses. Compounds were annotated as chemotherapy drugs, targeted cancer drugs, or non-oncology drugs based on approved indications and prior clinical trial disease areas. d, Drug category representation in the primary and secondary screens. The secondary screen was enriched for chemotherapies and targeted cancer therapies.
Fig 2.
Fig 2.. Drug response landscape of human cancer cell lines
a, Two-dimensional UMAP projection of 990 drug killing profiles by cosine similarity. Compounds with shared annotated mechanism of action are labeled by color (n = 640 compounds). Compounds with average Pearson correlation below 0.25 across 3 independent plates in one PRISM screen are not shown. b, Secondary screen drug activity by dose. Complementary cumulative distribution functions for the percent of cell lines killed in each drug category (chemotherapy: n = 90 compounds, targeted cancer: n = 584 compounds, non-oncology: n = 774 compounds) at each dose of the secondary screen are shown. c, Selective compound activity by drug category. The global distribution of secondary screen bimodality coefficients is shown. Dosewise bimodality coefficients are calculated from log fold-change viability data; the maximum bimodality coefficient is shown for each compound. Violin plot lines correspond to the 5th, 10th, 50th, 90th, and 95th quantiles. d, Most selective sensitivity profiles by drug category. The number of drugs (y-axis) from each drug category with a bimodality coefficient at any dose greater than a given threshold (x-axis) are shown. For visualization purposes, only drugs with bimodality coefficient ≥ 0.4 are included. e, Predictability of compound activity by drug category. (chemotherapy: n = 90, targeted cancer: n = 584, non-oncology: n = 774). Global distribution of secondary screen Pearson scores is shown. ATLANTIS random forest models are trained to predict PRISM log fold-change values using cell line baseline omics and genomic perturbation profiles. The global distribution of secondary screen Pearson scores, defined as the correlation between actual and predicted PRISM profiles, is shown. The maximum Pearson score across all models is used for each compound. Violin plot lines correspond to the 5th, 10th, 50th, 90th, and 95th quantiles. f, Most predictable sensitivity profiles by drug category. The number of drugs (y-axis) from each drug category with a predictive model with a Pearson score greater than a given threshold (x-axis) are shown. For visualization purposes, only drugs with a maximum Pearson score ≥ 0.2 are included.
Fig 3.
Fig 3.. Predictors of drug sensitivity and comparison with genetic dependencies.
a, Contributions of different genomic feature types to strong predictive models. A weighted set of genomic features predictive of drug activity is determined using the ATLANTIS implementation of random forest. Models with a Pearson score ≥ 0.4 are included. b, Relationship between bimodality coefficient of PRISM viability profile and correlation with CRISPR knockout of annotated gene target (oncology: n = 885 compounds, non-oncology: n = 2361 compounds). Pearson correlations are computed between the primary screen log fold-change profile of each compound and the DepMap Avana CRISPR/Cas9 gene knockout scores (CERES) of its annotated targets. For compounds with multiple target annotations, the maximum correlation is shown. Bimodality coefficients are calculated over cell lines shared by each compound and target shown. Linear regression lines are shown.
Fig 4.
Fig 4.. Predictive biomarker discovery using the PRISM Repurposing dataset
Prioritization of compounds based on strength of predictive models (Pearson score) and cell line selectivity (bimodality coefficient). Both known oncology (n = 997 compounds) and non-oncology (n = 3,443 compounds) sets contain compounds with high selectivity and predictability (strong model performance; upper right quadrant).
Fig 5.
Fig 5.. Multiple existing drugs selectively kill cancer cell lines by stimulating PDE3A-SLFN12 interaction
a, Drug sensitivity profiles associated with high PDE3A RNA expression (n = 489 cell lines, n = 11 compounds). PDE3A gene expression from CCLE RNAseq data (log2 RPKM; red) and cell line viability (blue) are indicated by color. Compounds where PDE3A expression was the top predictive biomarker by ATLANTIS from the PRISM 2.5 μM primary screen are shown. Cell lines are ranked by mean viability of indicated compounds with a ceiling at 1 (100%). b, Thermal shift assay performed with recombinant PDE3A. Stabilization of PDE3A protein is seen for a subset of hit compounds. DNMDP is included as established positive control for strong PDE3A binding. Full ΔTm results are shown in Supplementary Table 9. Results are representative of two independent experiments. c, HeLa cell line dose response curves with PDE3A genetic loss or pharmacologic inhibition. Knockout of PDE3A was performed by CRISPR/Cas9. Parental HeLa cell killing was rescued by co-treatment with 100 nM of the non-cytotoxic PDE3A inhibitor trequinsin. Mean viability across two independently treated wells in one experiment is shown. d, Co-immunoprecipitation of V5-tagged SLFN12. PDE3A-modulating compounds induce complex formation between PDE3A and SLFN12. Anti-V5 western blot shown using lysates from HeLa cells treated with the indicated compound at 10 μM for 8 hours. The anagrelide and DNMDP lanes were run on the same gel as all other samples and were cropped for figure purposes. Anagrelide and DNMDP results are consistent across three independent experiments. All other compounds were tested twice, with the exception of norethindrone (tested once with the expected results).
Fig. 6.
Fig. 6.. Anti-cancer activity of disulfiram and vanadium
a, Disulfiram sensitivity of PRISM cell lines grouped by 16q copy number status (n= 447 cell lines). PRISM secondary data are shown as AUCs. Arm-level copy number data was obtained using published TCGA methods and manually reviewed to ensure consistency with copy number at the 16q13 locus. Two-sided p-values were calculated using Wilcoxon signed-rank tests between each pair of groups. Upper box limits, center lines, and lower box limits correspond to 75th, 50th, and 25th percentiles, respectively. Whiskers extend from the box limits to the most extreme value up to 1.5 IQR from the median. All cell lines are depicted as points, regardless of outlier status. b, MTF1 loss sensitizes to disulfiram. Drug sensitivity of SF295 cells with and without MTF1 knockout, with sgRNA against GFP included as a non-targeting control. Co-treatment with 1 μM TTM is included. Mean viability across three independently treated wells is shown, with standard deviation indicated by error bars. c, Scatter plot of BMOV sensitivity versus SLC26A2 gene expression (n = 538 cell lines). Correlation between PRISM viability data at 2.5 μM and SLC26A2 gene expression from CCLE RNAseq (log2 RPKM). Pearson’s r is shown. d, SLC26A2 knockout confers resistance. Dose-response curves for BMOV and BEOV in OVISE cells with and without CRISPR/Cas9-mediated knockout of SLC26A2. sgRNA against GFP was included as a non-targeting control. Mean viability across three independently treated wells is shown with standard deviation indicated by error bars. e, Dose-response curves for related vanadium-containing compounds, N,N’-Bis(salicylidene)-o-phenylenediamine vanadium(IV) oxide and vanadyl sulfate, in OVISE cells with and without SLC26A2 knockout. Mean viability across three independently treated wells is shown, with standard deviation indicated by error bars.
Fig 7.
Fig 7.. Tepoxalin is active against ABCB1-high cancer cell lines via an ABCB1-mediated mechanism
a, Drug sensitivity profiles of tepoxalin and seven additional compounds where ABCB1 RNA expression was the top predictive genomic feature of the PRISM activity profile (n = 489 cell lines). Tepoxalin was the only compound tested where high ABCB1 expression was associated with sensitivity rather than resistance to tepoxalin. Cell line viability is depicted with ABCB1 gene expression from CCLE RNAseq log2 RPKM data. Cell lines are ranked by mean viability with a ceiling at 100%. b, ABCB1 knockout is the top hit that rescues tepoxalin activity in a genome-wide CRISPR/Cas9 gene knockout screen. LS1034-Cas9 cells (pXPR_311) were infected with the Brunello sgRNA library, selected with puromycin, and treated with 16 μM tepoxalin versus vehicle control with two replicates in independent flasks. Cells were passaged every 3–4 days over a 30-day period. Two-sided p-values are computed using MAGeCK-MLE and shown versus gene-level log fold-changes. c, ABCB1 overexpression sensitizes to tepoxalin activity in a genome-wide CRISPR/dCas9 gene activation screen. LS1034-dCas9 cells (pXPR_109) were infected with the Calabrese sgRNA library, selected with puromycin, and treated with 16 μM tepoxalin versus vehicle control with two replicates in independent flasks. Cells were passaged every 3–4 days over a 14-day period. Two-sided p-values are computed using MAGeCK-MLE and shown versus gene-level log fold-changes. d, Tepoxalin cellular competition assay following ABCB1 knockout. LS1034-Cas9 cells (pXPR_311) were stably infected with Firefly luciferase and parental LS1034 cells (without Cas9) were stably infected with Renilla luciferase. Cells were mixed in 1:1 ratio an infected with the indicated sgRNA construct against ABCB1 or an intergenic region on chromosome 2 (negative control). Following puromycin selection, cell mixtures were treated with 16 μM tepoxalin. Firefly to Renilla luminescence ratio is plotted as log fold-change over time. Mean of three technical replicates is shown and results are representative of three independent experiments.

Comment in

  • Old drugs with new tricks.
    Beijersbergen RL. Beijersbergen RL. Nat Cancer. 2020 Feb;1(2):153-155. doi: 10.1038/s43018-020-0024-8. Nat Cancer. 2020. PMID: 35122006 No abstract available.

References

    1. Alley MC et al. Feasibility of drug screening with panels of human tumor cell lines using a microculture tetrazolium assay. Cancer Res. 48, 589–601 (1988). - PubMed
    1. Garnett MJ et al. Systematic identification of genomic markers of drug sensitivity in cancer cells. Nature 483, 570–575 (2012). - PMC - PubMed
    1. Basu A et al. An Interactive Resource to Identify Cancer Genetic and Lineage Dependencies Targeted by Small Molecules. Cell 154, 1151–1161 (2013). - PMC - PubMed
    1. Yu C et al. High-throughput identification of genotype-specific cancer vulnerabilities in mixtures of barcoded tumor cell lines. Nat. Biotechnol 34, 419–423 (2016). - PMC - PubMed
    1. Corsello SM et al. The Drug Repurposing Hub: a next-generation drug library and information resource. Nat. Med 23, 405–408 (2017). - PMC - PubMed

Publication types