. 2020 Sep 1;92(17):11573-11581.
doi: 10.1021/acs.analchem.0c00985. Epub 2020 Aug 12.

Improved Annotation of Untargeted Metabolomics Data through Buffer Modifications That Shift Adduct Mass and Intensity

Affiliations

Improved Annotation of Untargeted Metabolomics Data through Buffer Modifications That Shift Adduct Mass and Intensity

Wenyun Lu et al. Anal Chem. .

Abstract

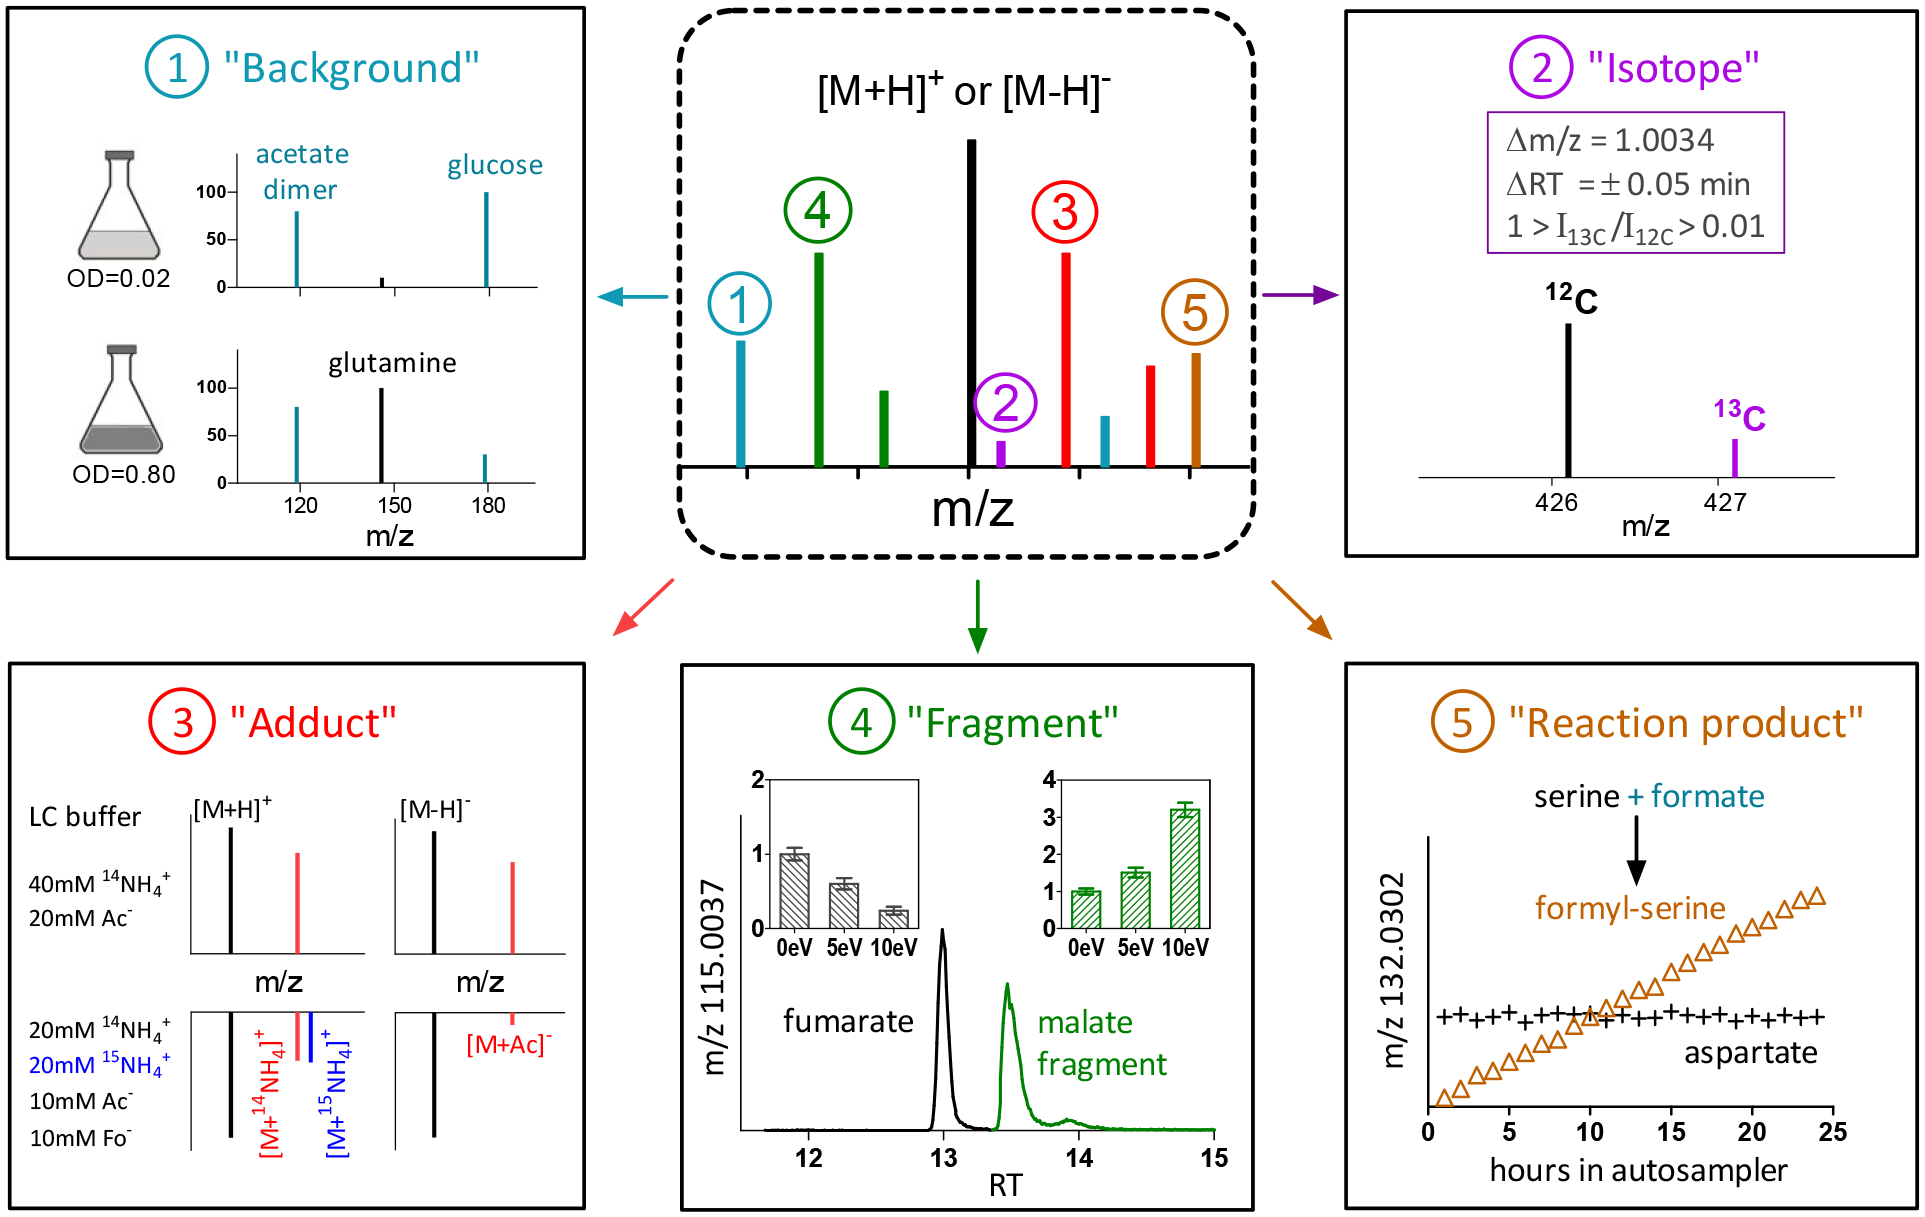
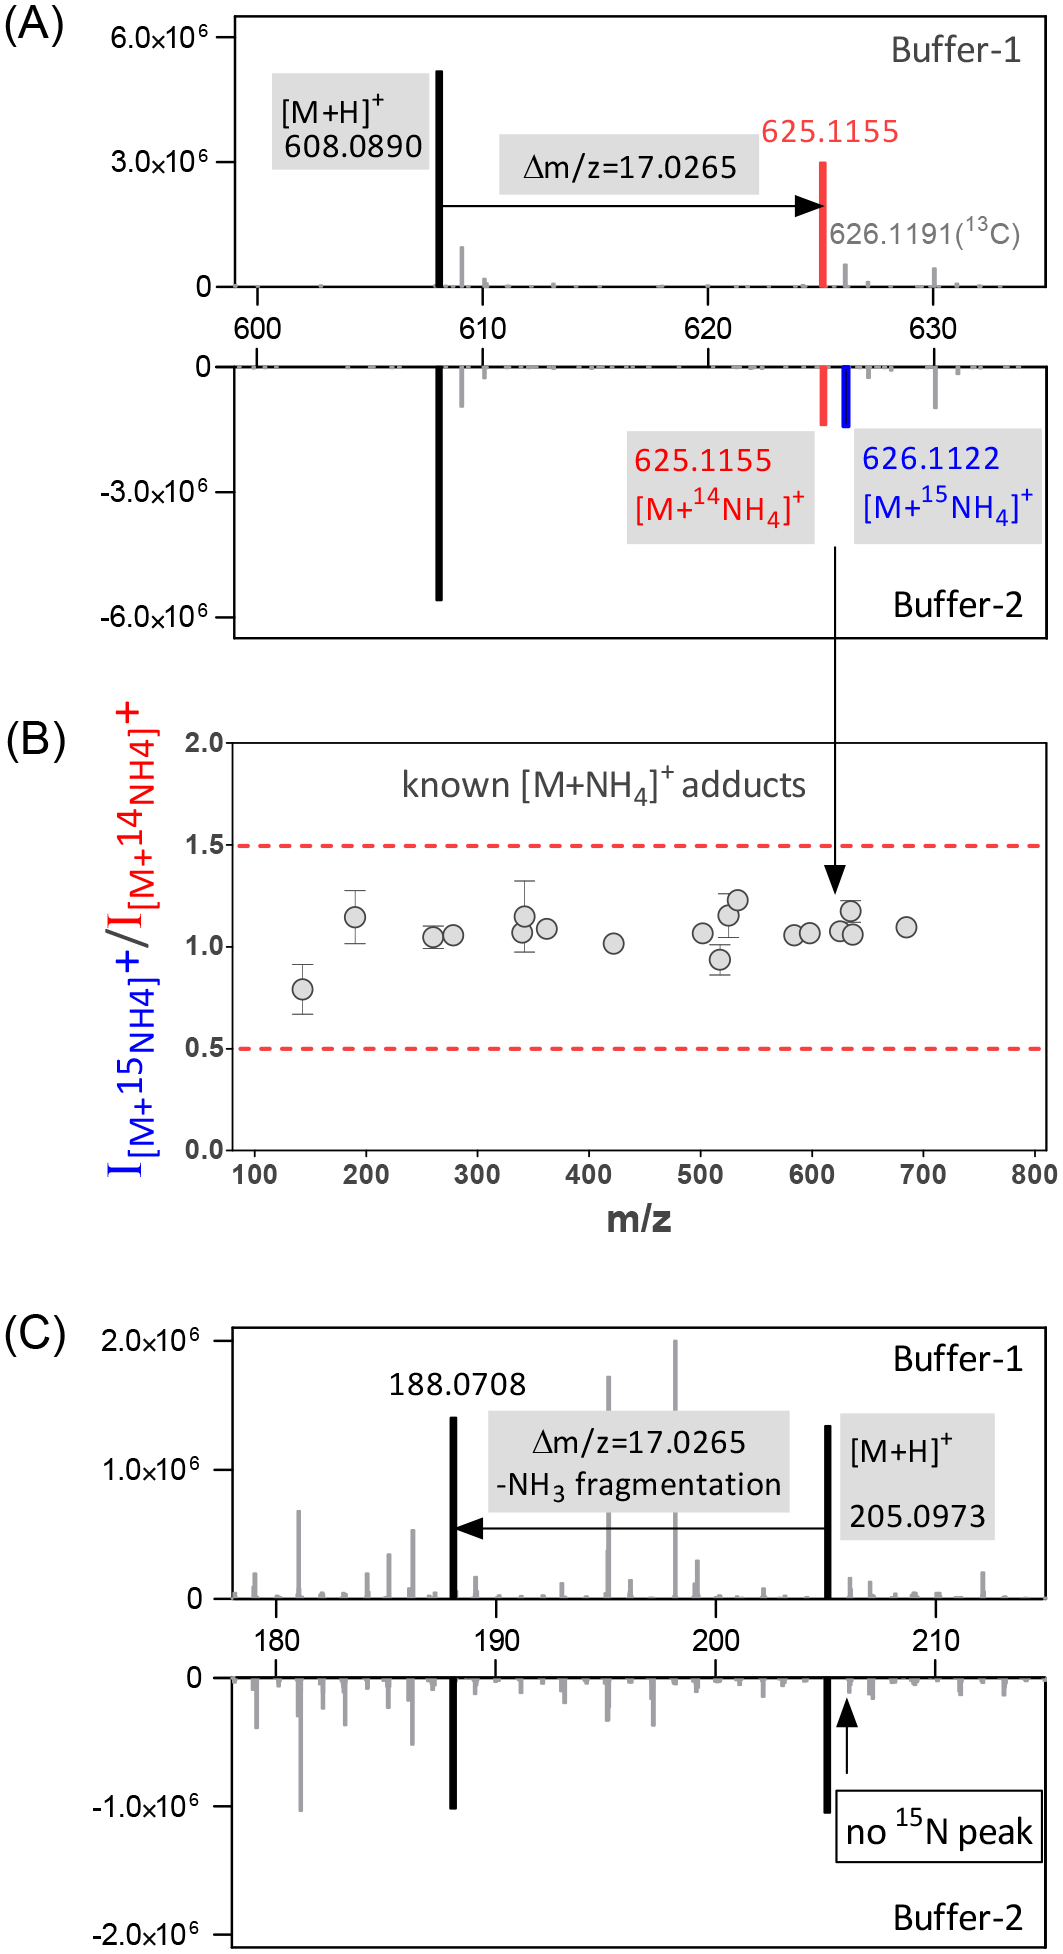
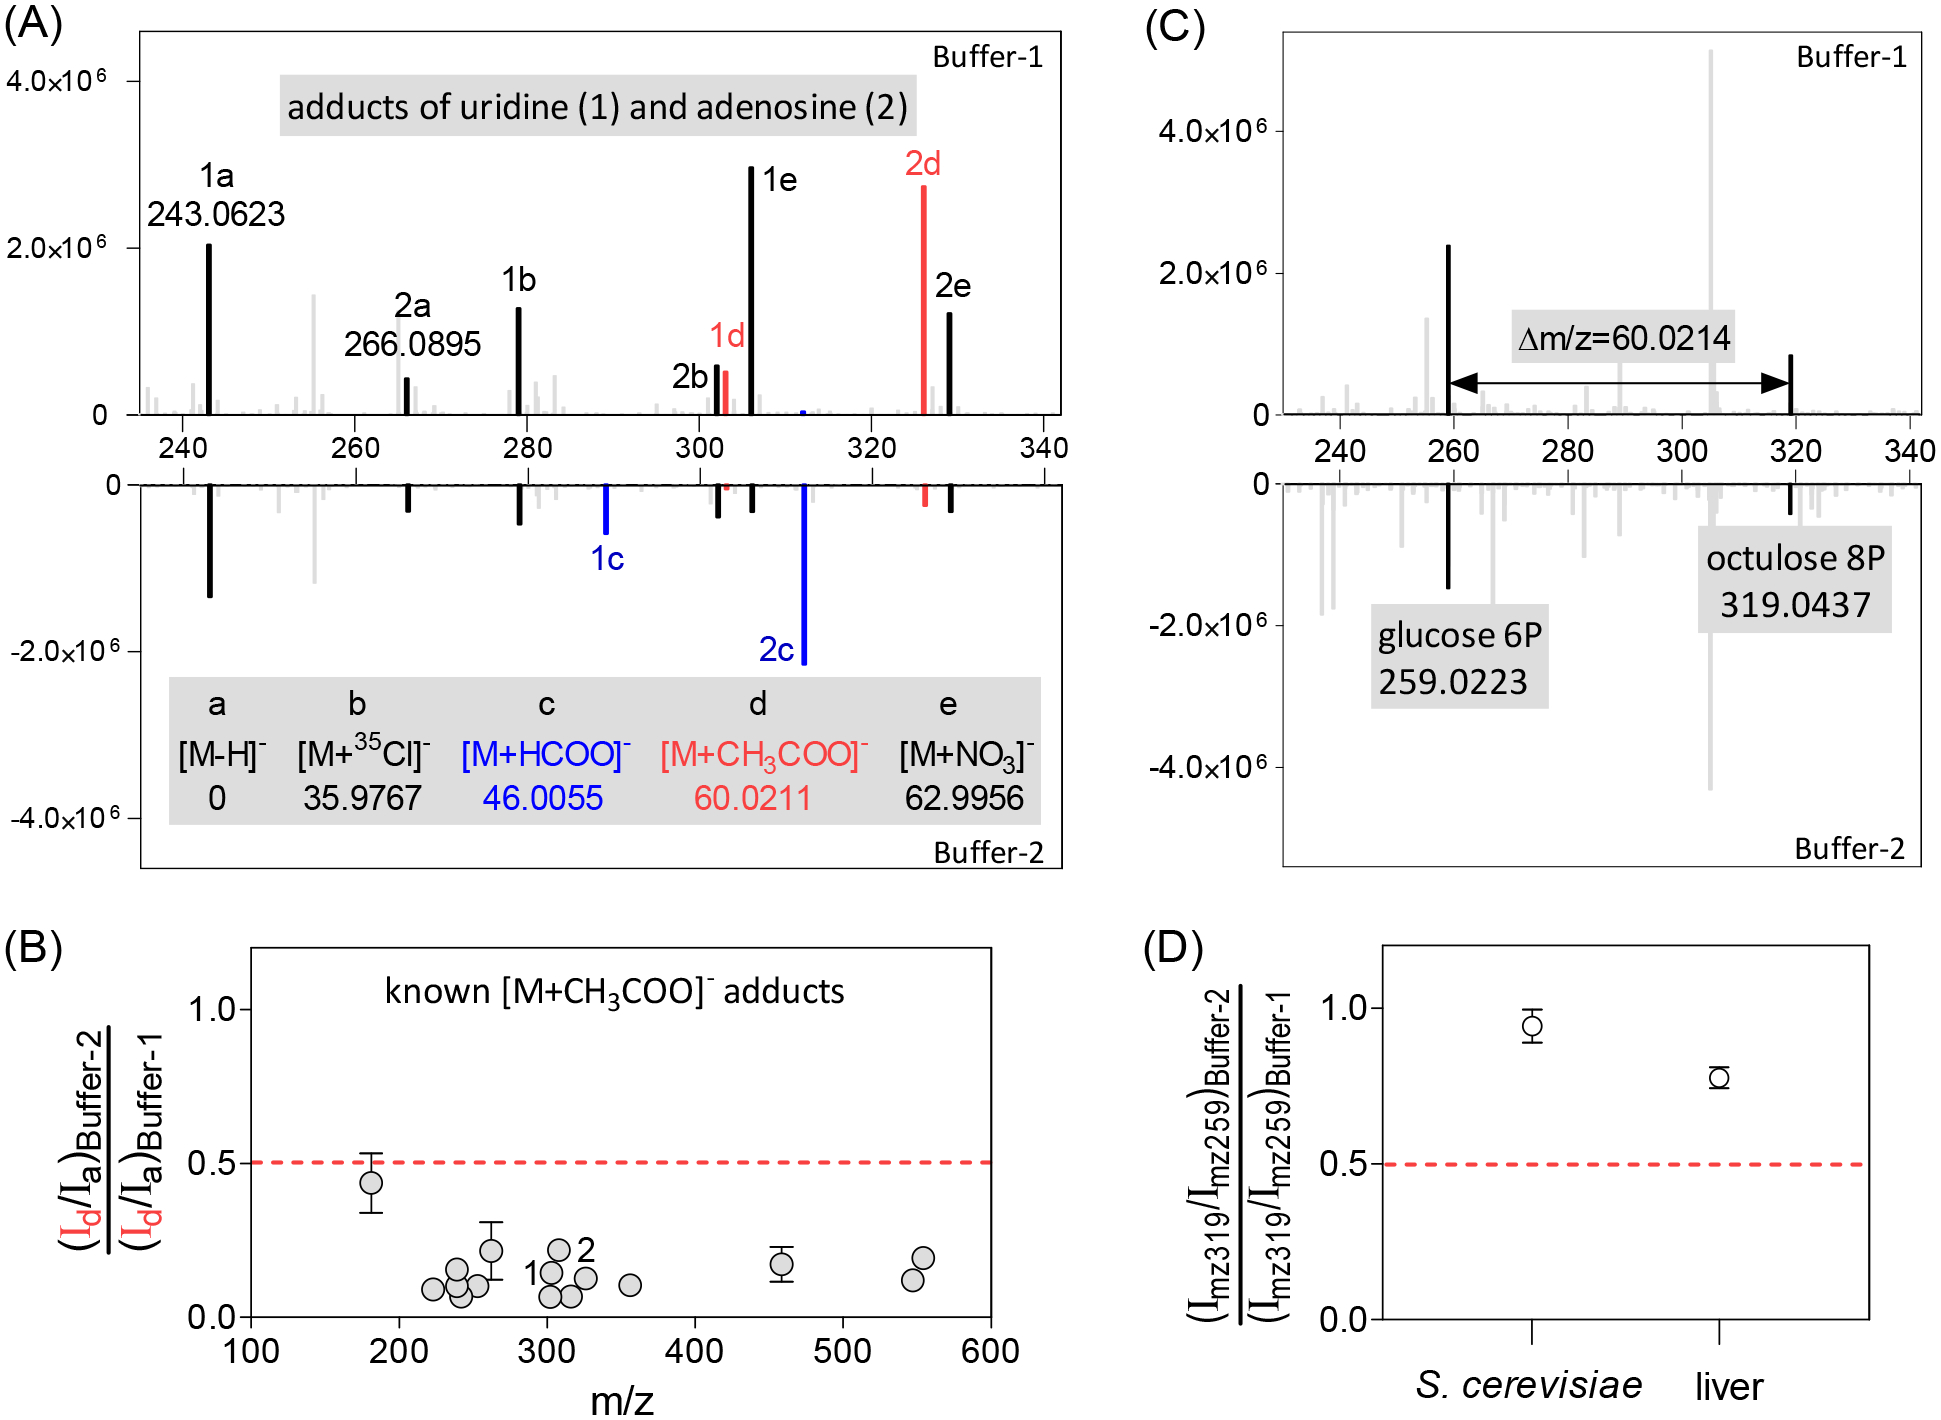
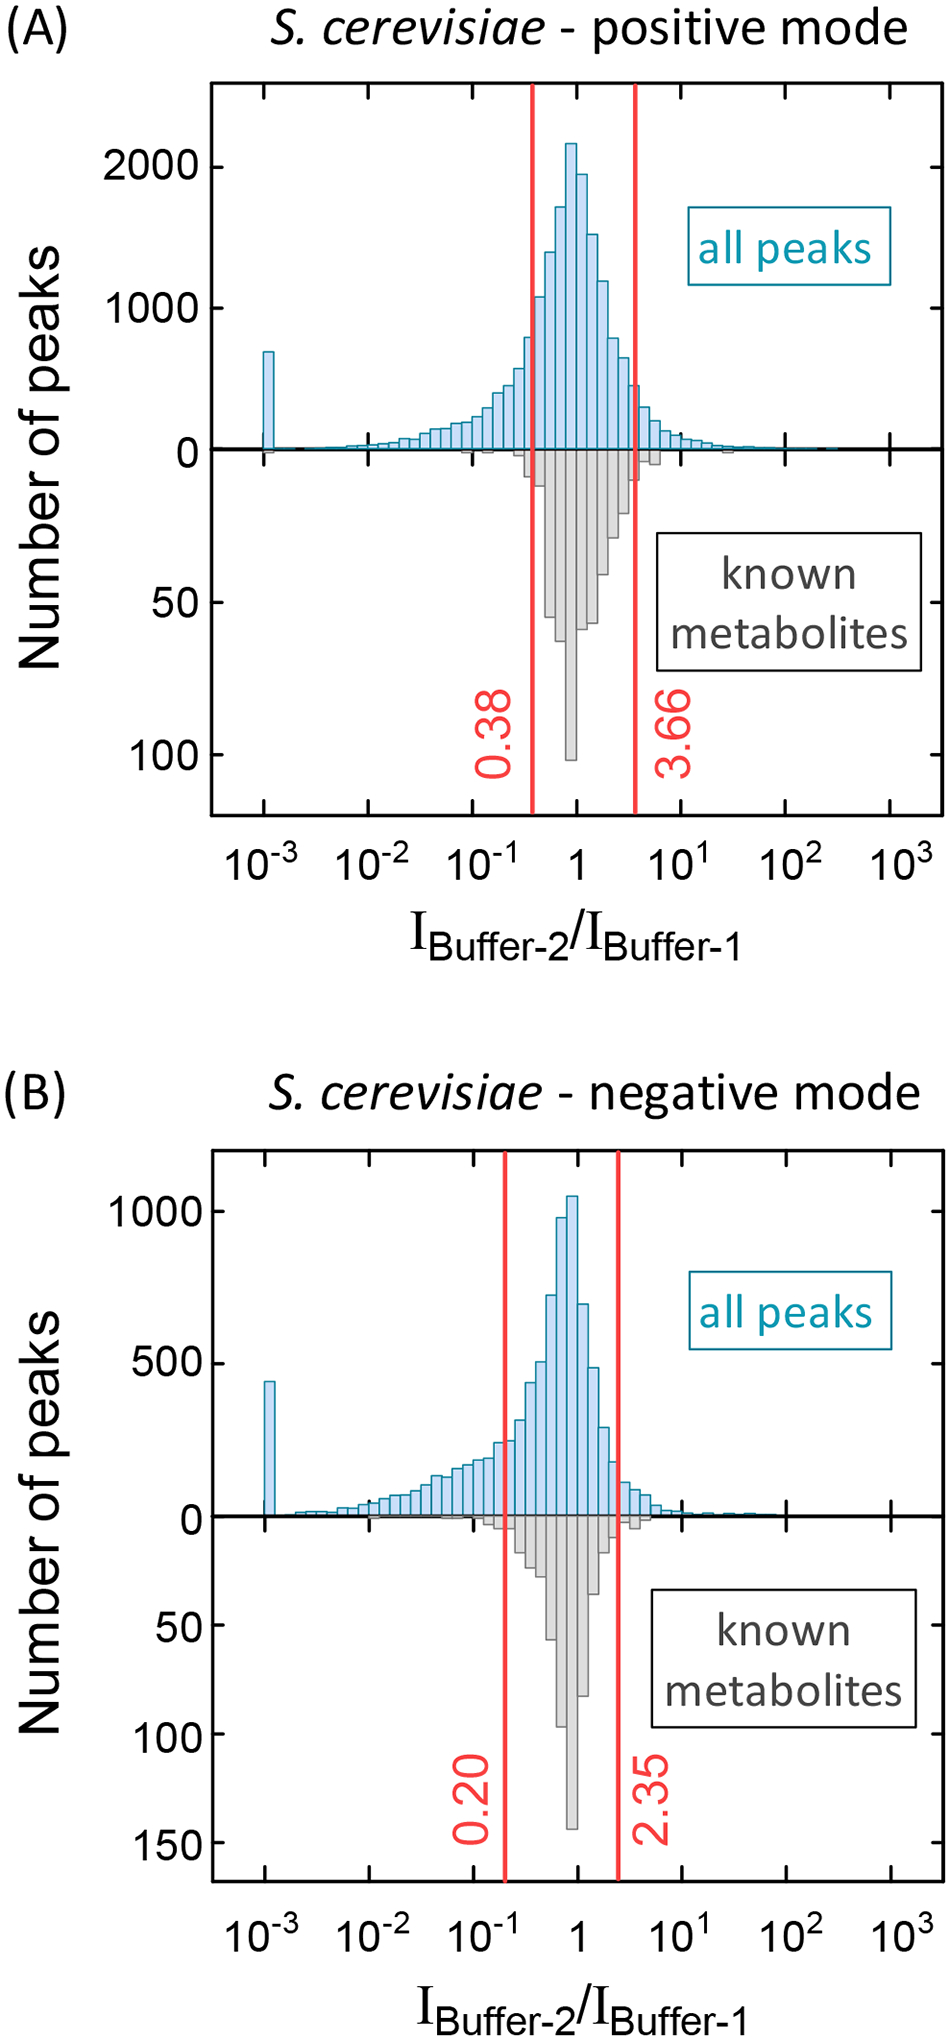
Annotation of untargeted high-resolution full-scan LC-MS metabolomics data remains challenging due to individual metabolites generating multiple LC-MS peaks arising from isotopes, adducts, and fragments. Adduct annotation is a particular challenge, as the same mass difference between peaks can arise from adduct formation, fragmentation, or different biological species. To address this, here we describe a buffer modification workflow (BMW) in which the same sample is run by LC-MS in both liquid chromatography solvent with 14NH3-acetate buffer and in solvent with the buffer modified with 15NH3-formate. Buffer switching results in characteristic mass and signal intensity changes for adduct peaks, facilitating their annotation. This relatively simple and convenient chromatography modification annotated yeast metabolomics data with similar effectiveness to growing the yeast in isotope-labeled media. Application to mouse liver data annotated both known metabolite and known adduct peaks with 95% accuracy. Overall, it identified 26% of ∼27 000 liver LC-MS features as putative metabolites, of which ∼2600 showed HMDB or KEGG database formula match. This workflow is well suited to biological samples that cannot be readily isotope labeled, including plants, mammalian tissues, and tumors.


Figures

Fig 1.
Fig 1.
Five major peak annotation categories. (1) “Background” ions were annotated based on whether the peak intensity is < 2-fold of that in procedure blank. (2) “Isotope” peaks were annotated based on Δm/z match, RT match and intensity ratio within set range. (3) “Adduct” peaks were annotated similar to “Isotope”, with use of buffer modification to annotate accurately [M+NH4]+ and [M+CH3COO] adducts. See Fig 2 and Fig 3 for more details. Ac: CH COO. Fo: HCOO.(4) “Fragment” peaks were annotated based on whether the peak intensity increases with 5 or 10 eV of in-source CID compared to 0 eV. The chromatogram of fumarate shows the peak of fumarate itself (13.0 min) (which falls in intensity with increasing CID) and a fragment from malate (13.5 min), which rises. (5) “Reaction product” refers to peaks that increase after extraction as sample sits inside the autosampler at 5 °C. These peaks can arise from the reactions between endogenous metabolites and the extraction buffer.
Fig 2.
Fig 2.
Annotation of ammonium adducts in positive mode is achieved by running the same sample in LC Buffer-1 which contains 40 mM 14NH4+, and Buffer-2 which contains 20mM 14NH4+ and 15NH4+. (A) For ammonium adducts, under Buffer-2, there is a pair of peaks of [M+14NH4]+ and [M+15NH4]+ with similar intensity (shown here for the metabolite UDP-N-acetylglucosamine). (B) In Buffer-2, the relative intensity of the 15N and 14N ammonia adduct peaks is consistently within 0.5 −1.5 (shown here for 18 known ammonium adducts). (C) Fragmentation with a loss of NH3 can be distinguished from adduct formation based on the absence of the 15N peak under Buffer-2 (shown here for the metabolite tryptophan).
Fig 3.
Fig 3.
Annotation of acetate adducts in negative mode is achieved by running the same sample in LC Buffer-1 which contains 20 mM acetate, and Buffer-2 which contains 10 mM acetate and 10 mM formate. (A, B) For acetate adducts, peak intensity decreases >2-fold when switching buffer, after normalizing to the deprotonated peak intensity, as seen for 16 acetate adducts of known metabolites including uridine and adenosine. (C) The molecular formula of acetate (C2H4O2) is the same as two carbon units in a carbohydrate molecule (2 × CHOH). Acetate adducts can be distinguished from larger carbohydrates based on their response to Buffer-2. For example, at the retention time of glucose-6-phosphate (m/z 259.0223), there is an ion at m/z of 319.0437. (D) After normalizing to m/z 259 peak, the intensity of the m/z 319 peak does not decrease >2-fold. This indicates that the ion at m/z 319.0437 is not the acetate adduct of glucose-6-phosphate. Instead, it corresponds to the larger phosphorylated carbohydrate octulose-8-phosphate.
Fig 4.
Fig 4.
Peaks showing greater intensity changes in response to buffer switching than 95% of known metabolites are categorized by BMW as “Buffer sensitive.” Buffer sensitive peaks are likely to be unknown adducts, rather than metabolite [M+H]+ or [M−H] ions. There is a cluster of peaks that essentially disappear with buffer switching (intensity ratio around 0.001). (A) Positive mode yeast data for all peaks versus known metabolites. (B) Negative mode data.
Fig 5.
Fig 5.
Chemicals can be made by reaction of extraction buffer components with metabolites. (A) The ion-specific chromatogram at aspartate m/z (132.0302 ± 10ppm) in negative mode from S. cerevisiae extract shows two prominent peaks. Both match a formula of C4H6NO4. MS2 spectra shows that the 13.6 min peak is aspartate, while the 11.3 min peak is an unknown (Figure S6A). Labeling experiments show that the aspartate peak as expected has 4 carbons that label, while the 11.3 min peak has only 3, implying non-biological assimilation of one unlabeled carbon (Figure S6B). (B) Both peaks were also detected in liver extract. (C) The intensity for the 11.3 min peak increases as sample sits in the autosampler, while the aspartate peak is steady. (D) The 11.3 min peak is formyl-serine, and appears upon adding pure serine to the extraction solvent (40:40:20 acetonitrile:methanol:H2O with 0.5% formic acid).

References

    1. Uppal K; Walker DI; Liu K; Li S; Go YM; Jones DP Computational Metabolomics: A Framework for the Million Metabolome. Chem Res Toxicol 2016, 29, 1956–1975. - PMC - PubMed
    1. Lu W; Su X; Klein MS; Lewis IA; Fiehn O; Rabinowitz JD Metabolite Measurement: Pitfalls to Avoid and Practices to Follow. Annu Rev Biochem 2017, 86, 277–304. - PMC - PubMed
    1. Blazenovic I; Kind T; Ji J; Fiehn O Software Tools and Approaches for Compound Identification of LC-MS/MS Data in Metabolomics. Metabolites 2018, 8, 31. - PMC - PubMed
    1. Guo X; Bruins AP; Covey TR Characterization of typical chemical background interferences in atmospheric pressure ionization liquid chromatography-mass spectrometry. Rapid Commun Mass Spectrom 2006, 20, 3145–3150. - PubMed
    1. Xu YF; Lu W; Rabinowitz JD Avoiding Misannotation of In-Source Fragmentation Products as Cellular Metabolites in Liquid Chromatography-Mass Spectrometry-Based Metabolomics. Analytical Chemistry 2015, 87, 2273–2281. - PMC - PubMed

Publication types

LinkOut - more resources