

Estimation of country-level basic reproductive ratios for novel Coronavirus (SARS-CoV-2/COVID-19) using synthetic contact matrices
- PMID: 32614817
- PMCID: PMC7363110
- DOI: 10.1371/journal.pcbi.1008031
Estimation of country-level basic reproductive ratios for novel Coronavirus (SARS-CoV-2/COVID-19) using synthetic contact matrices
Abstract
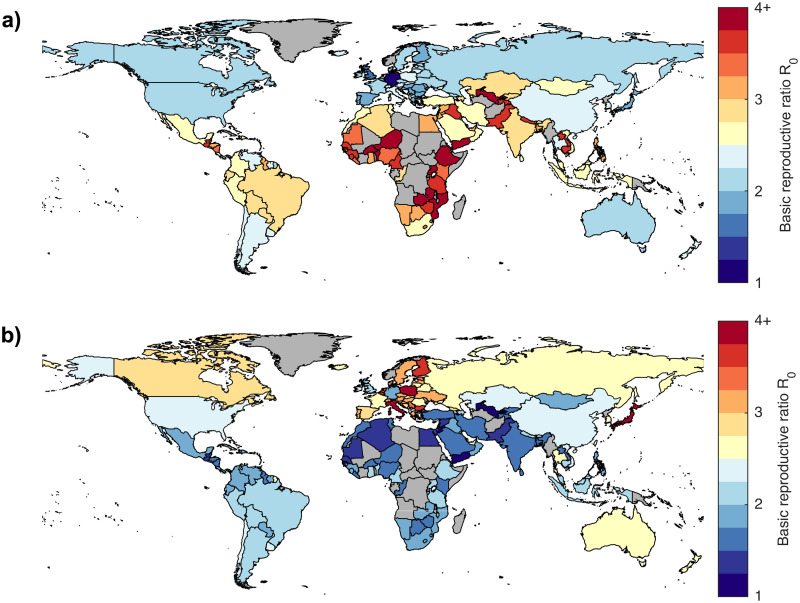
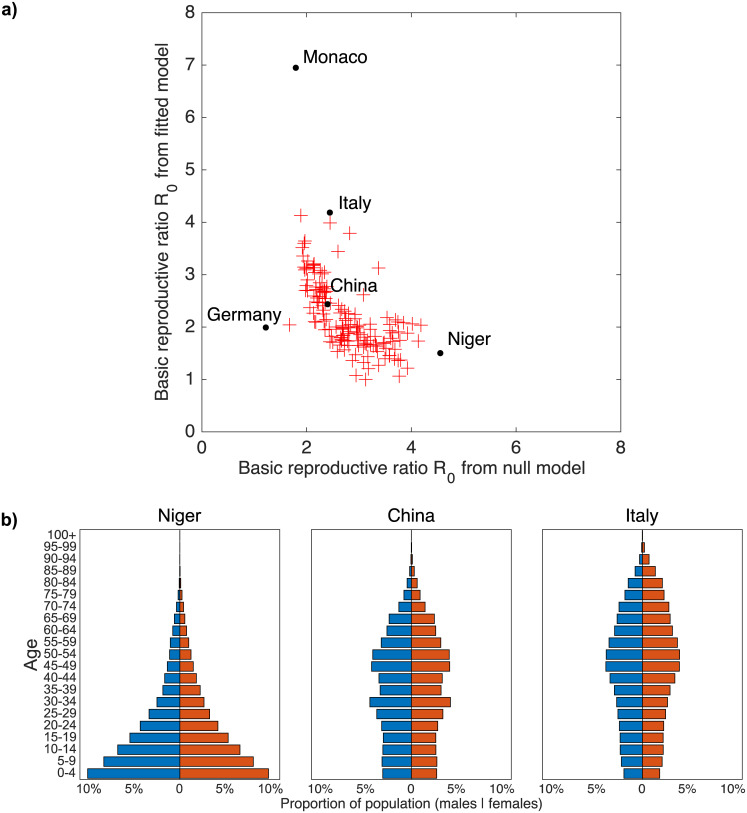
The 2019-2020 pandemic of atypical pneumonia (COVID-19) caused by the virus SARS-CoV-2 has spread globally and has the potential to infect large numbers of people in every country. Estimating the country-specific basic reproductive ratio is a vital first step in public-health planning. The basic reproductive ratio (R0) is determined by both the nature of pathogen and the network of human contacts through which the disease can spread, which is itself dependent on population age structure and household composition. Here we introduce a transmission model combining age-stratified contact frequencies with age-dependent susceptibility, probability of clinical symptoms, and transmission from asymptomatic (or mild) cases, which we use to estimate the country-specific basic reproductive ratio of COVID-19 for 152 countries. Using early outbreak data from China and a synthetic contact matrix, we estimate an age-stratified transmission structure which can then be extrapolated to 151 other countries for which synthetic contact matrices also exist. This defines a set of country-specific transmission structures from which we can calculate the basic reproductive ratio for each country. Our predicted R0 is critically sensitive to the intensity of transmission from asymptomatic cases; with low asymptomatic transmission the highest values are predicted across Eastern Europe and Japan and the lowest across Africa, Central America and South-Western Asia. This pattern is largely driven by the ratio of children to older adults in each country and the observed propensity of clinical cases in the elderly. If asymptomatic cases have comparable transmission to detected cases, the pattern is reversed. Our results demonstrate the importance of age-specific heterogeneities going beyond contact structure to the spread of COVID-19. These heterogeneities give COVID-19 the capacity to spread particularly quickly in countries with older populations, and that intensive control measures are likely to be necessary to impede its progress in these countries.
Conflict of interest statement
The authors have declared that no competing interests exist.
Figures
References
-
- World Health Organisation. Coronavirus disease (COVID-19) Pandemic; 2020. https://web.archive.org/web/20200529095724/https://www.who.int/emergenci....
-
- Keeling MJ, Rohani P. Modeling infectious diseases in humans and animals Princeton University Press; 2011.
Publication types
MeSH terms
LinkOut - more resources
Full Text Sources
Miscellaneous
