. 2020 Jul 2;16(7):e1008671.
doi: 10.1371/journal.ppat.1008671. eCollection 2020 Jul.

Single cell heterogeneity in influenza A virus gene expression shapes the innate antiviral response to infection

Affiliations

Single cell heterogeneity in influenza A virus gene expression shapes the innate antiviral response to infection

Jiayi Sun et al. PLoS Pathog. .

Abstract

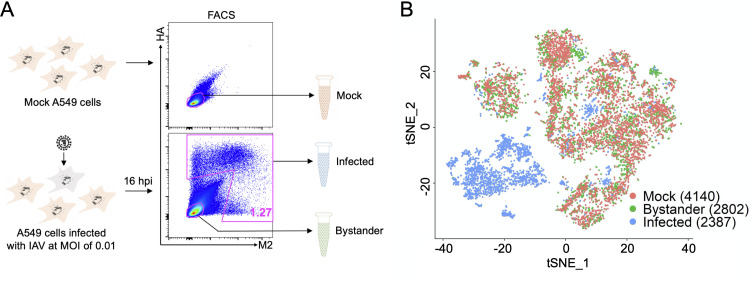
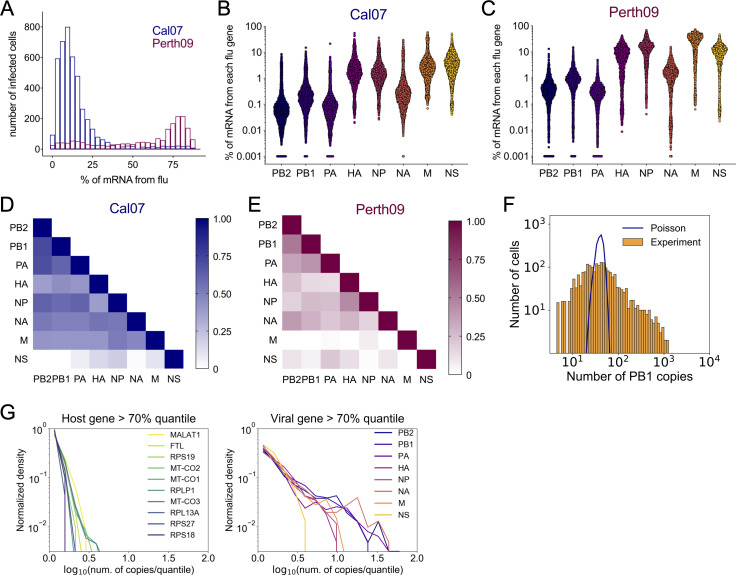
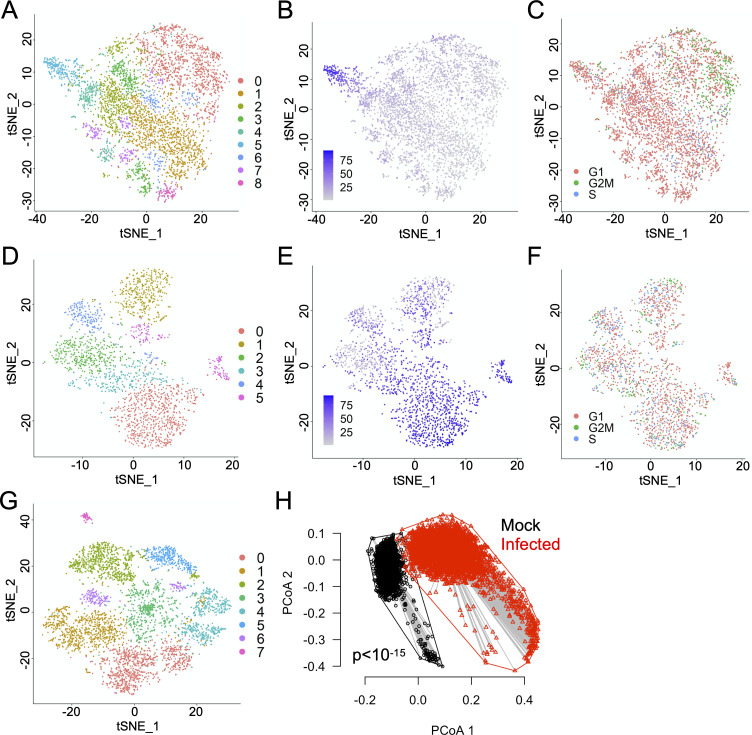
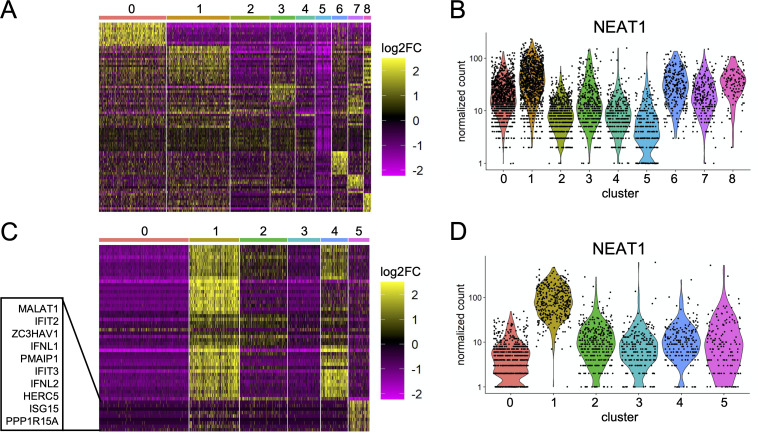
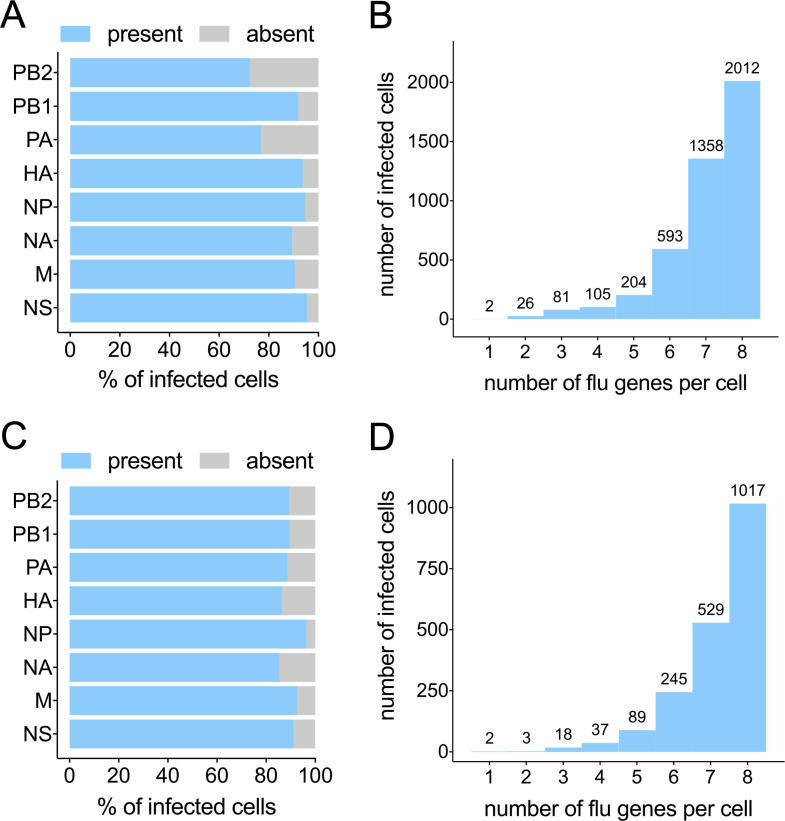
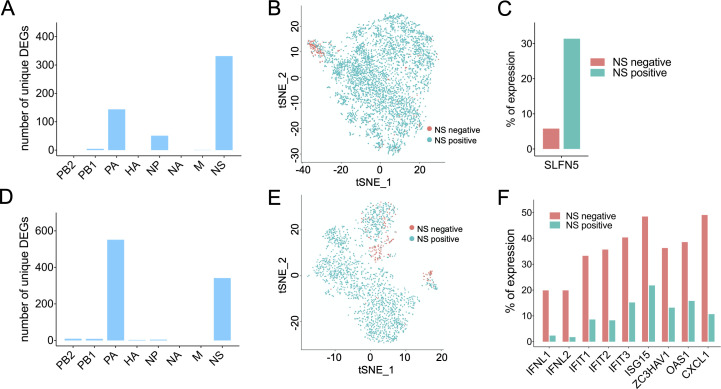
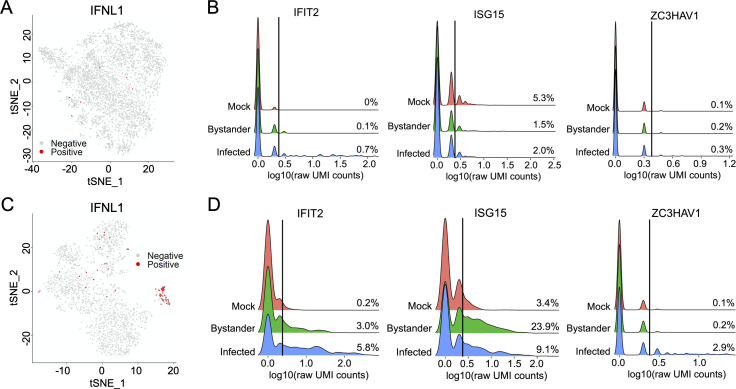
Viral infection outcomes are governed by the complex and dynamic interplay between the infecting virus population and the host response. It is increasingly clear that both viral and host cell populations are highly heterogeneous, but little is known about how this heterogeneity influences infection dynamics or viral pathogenicity. To dissect the interactions between influenza A virus (IAV) and host cell heterogeneity, we examined the combined host and viral transcriptomes of thousands of individual cells, each infected with a single IAV virion. We observed complex patterns of viral gene expression and the existence of multiple distinct host transcriptional responses to infection at the single cell level. We show that human H1N1 and H3N2 strains differ significantly in patterns of both viral and host anti-viral gene transcriptional heterogeneity at the single cell level. Our analyses also reveal that semi-infectious particles that fail to express the viral NS can play a dominant role in triggering the innate anti-viral response to infection. Altogether, these data reveal how patterns of viral population heterogeneity can serve as a major determinant of antiviral gene activation.


Conflict of interest statement

The authors have declared that no competing interests exist.

Figures

Fig 1
Fig 1. Generation of viral and host transcriptional data for thousands of singly infected cells.
(A) Schematic depicting our strategy for generating single cell RNAseq libraries from thousands of cells infected at low MOI. In brief, we infect A549 cells with Cal07 or Perth09 at MOI = 0.01 to ensure that infected cells are infected with a single virion. We then block secondary spread with NH4Cl treatment to make sure infection timing is uniform across all infected cells. Finally, we sort “infected” and “bystander” cells based on surface expression of HA and/or M2 and immediately generate single cell RNAseq libraries from these sorted cell populations using the 10X Chromium device. In parallel, mock cells are sorted and used as uninfected controls. (B) tSNE dimensionality reduction plot showing the extent of overlap between 3 indicated cell populations from Perth09 experiment clustered based on transcriptional similarity.
Fig 2
Fig 2. Enormous heterogeneity in viral gene expression patterns.
(A) Distributions of Cal07 and Perth09-infected A549 cells, binned by the fraction of total cellular poly(A) RNA that is viral in origin. (B) Plots show the fraction of total poly(A) RNA per cell that maps to the indicated viral gene segment of Cal07. Each dot represents a single cell, cells with no detectable reads mapping to the indicated segment were arbitrarily assigned a value of 0.001 to show up on the log10 scale. (C) Same figure as (B) for Perth09. (D) R2 correlation values plotted as heat map for all pairwise comparisons of Cal07 viral transcripts within infected cells positive for all viral genes. (E) Same figure as (D) for Perth09. (F) Distribution of normalized Cal07-PB1-derived reads per cell (orange) compared with a Poisson distribution of equal mean (blue line) on a log-log scale. (G) Distributions of top 10 most abundant host transcripts (left panel) and Cal07 viral gene expression (right panel) normalized by the 70th quantile on a log-log scale.
Fig 3
Fig 3. Significant heterogeneity in the host transcriptional response to infection.
(A) tSNE dimensionality reduction plot showing all Cal07-infected A549 cells clustered based on similarity of host transcription patterns. (B) Same tSNE plot of Cal07-infected cells shown in (A) with each cell colored by the percentage of total cellular poly(A) RNA that is viral in origin. (C) Same tSNE plot of Cal07-infected cells shown in (A) with each cell colored by predicted cell cycle stage, as determined by the Scran package. (D) Same figure as (A) for Perth09. (E) Same figure as (B) for Perth09. (F) Same figure as (C) for Perth09. (G) tSNE dimensionality reduction plot showing mock A549 cells from Cal07 experiment clustered based on similarity of host transcriptional patterns. (H) Principle coordinate axes (PCoA) plot comparing the multivariate dispersions for mock (black) and Cal07-infected (red) A549 cells. The first two axes (PCoA 1 and PCoA 2) in the multivariate homogeneity of group dispersions analysis are used.
Fig 4
Fig 4. Substantial virus strain-specific variation in the expression patterns of critical determinants of IAV infection outcome.
(A) Heat map showing differential expression of the top 10 characteristic host genes for each cluster of Cal07-infected cells (from Fig 3A). Individual cells are each represented by a column, grouped by cluster, with individual rows representing relative expression of the top 10 specific host transcripts most significantly (lowest p values) associated with each cluster. (B) Comparison of normalized per cell counts of NEAT1 between clusters of Cal07-infected cells shown in (A). (C) Same heat map as (A) for each cluster from Perth09-infected cells (From Fig 3D), with the top 10 genes defining cluster 5 highlighted. (D) Comparison of normalized per cell counts of NEAT1 between clusters of Perth09-infected cells shown in (C).
Fig 5
Fig 5. Many infected cells have undetectable levels of one or more viral transcripts.
(A) The percentage of all Cal07-infected cells called as positive for the indicated gene segments (B) All Cal07-infected cells binned by the total number of viral gene segments that were called positive, with the actual numbers of cells in each group detailed above. (C) Same figure as (A) for Perth09. (D) Same figure as (B) for Perth09.
Fig 6
Fig 6. Dissection of the effects of individual viral gene expression on the host transcriptional response to infection.
(A) The number of host transcripts for which expression levels significantly differ depending on whether the indicated Cal07 gene segment is present or not, according to both MAST and NBID (host genes that are differentially regulated by the expression status of more than one viral segment are excluded). (B) tSNE plot of all Cal07-infected A549 cells colored based on whether NS segment-derived transcripts are detected (Cyan) or not detected (Salmon). (C) Percentages of NS negative and NS positive Cal07-infected A549 cells that have detectable levels of SLFN5. (D) Same figure as (A) for Perth09. (E) Same figure as (B) for Perth09. (F) Percentages of NS negative and NS positive Perth09-infected A549 cells that have detectable levels of the indicated host transcripts.
Fig 7
Fig 7. H1N1 and H3N2 strains differ significantly in single cell patterns of IFN and ISG transcription.
(A) tSNE plots of all Cal07-infected A549 cells with cells that have detectable level of IFNL1 colored in red. (B) Histograms comparing distributions of per-cell UMI counts in log10 scale for the indicated host transcripts across the three libraries (mock, bystander, and infected) for Cal07 experiment. Cells with zero count excluded to avoid dominating the y-scale. Vertical lines indicate cutoff thresholds of 3 UMI counts, with percentages of all cells (including cells with zero count) in each library above the threshold shown on right. (C) Same figure as (A) for Perth09. (D) Same figure as (B) for Perth09.

Comment in

  • Influenza virus hedges its bets.
    York A. York A. Nat Rev Microbiol. 2020 Sep;18(9):475. doi: 10.1038/s41579-020-0422-z. Nat Rev Microbiol. 2020. PMID: 32669680 No abstract available.

References

    1. Andino R, Domingo E. Viral quasispecies. Virology. 2015;479–480: 46–51. 10.1016/j.virol.2015.03.022 - DOI - PMC - PubMed
    1. Bordería AV, Isakov O, Moratorio G, Henningsson R, Agüera-González S, Organtini L, et al. Group Selection and Contribution of Minority Variants during Virus Adaptation Determines Virus Fitness and Phenotype. PLoS Pathog. 2015;11: e1004838 10.1371/journal.ppat.1004838 - DOI - PMC - PubMed
    1. Domingo-Calap P, Segredo-Otero E, Durán-Moreno M, Sanjuán R. Social evolution of innate immunity evasion in a virus. Nat Microbiol. 2019;4: 1006–1013. 10.1038/s41564-019-0379-8 - DOI - PMC - PubMed
    1. Xiao Y, Dolan PT, Goldstein EF, Li M, Farkov M, Brodsky L, et al. Poliovirus intrahost evolution is required to overcome tissue-specific innate immune responses. Nat Commun. 2017;8: 375 10.1038/s41467-017-00354-5 - DOI - PMC - PubMed
    1. Brooke CB. Population Diversity and Collective Interactions during Influenza Virus Infection. J Virol. 2017;91 10.1128/JVI.01164-17 - DOI - PMC - PubMed

Publication types

MeSH terms

Substances