. 2020 Jul 14;4(13):3000-3010.
doi: 10.1182/bloodadvances.2019001292.

Inflammation-driven activation of JAK/STAT signaling reversibly accelerates acute myeloid leukemia in vitro

Affiliations

Inflammation-driven activation of JAK/STAT signaling reversibly accelerates acute myeloid leukemia in vitro

Jan Habbel et al. Blood Adv. .

Abstract

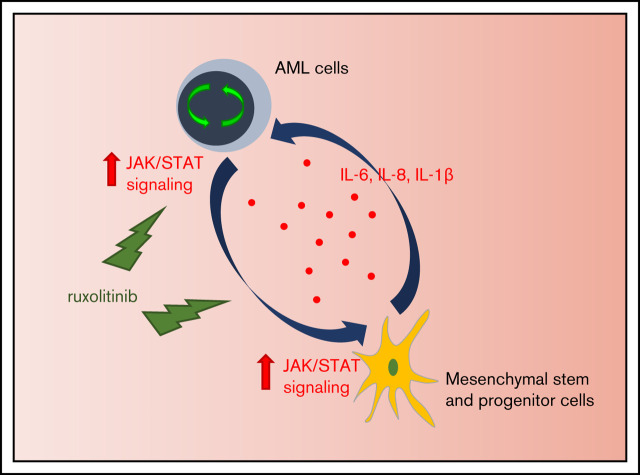
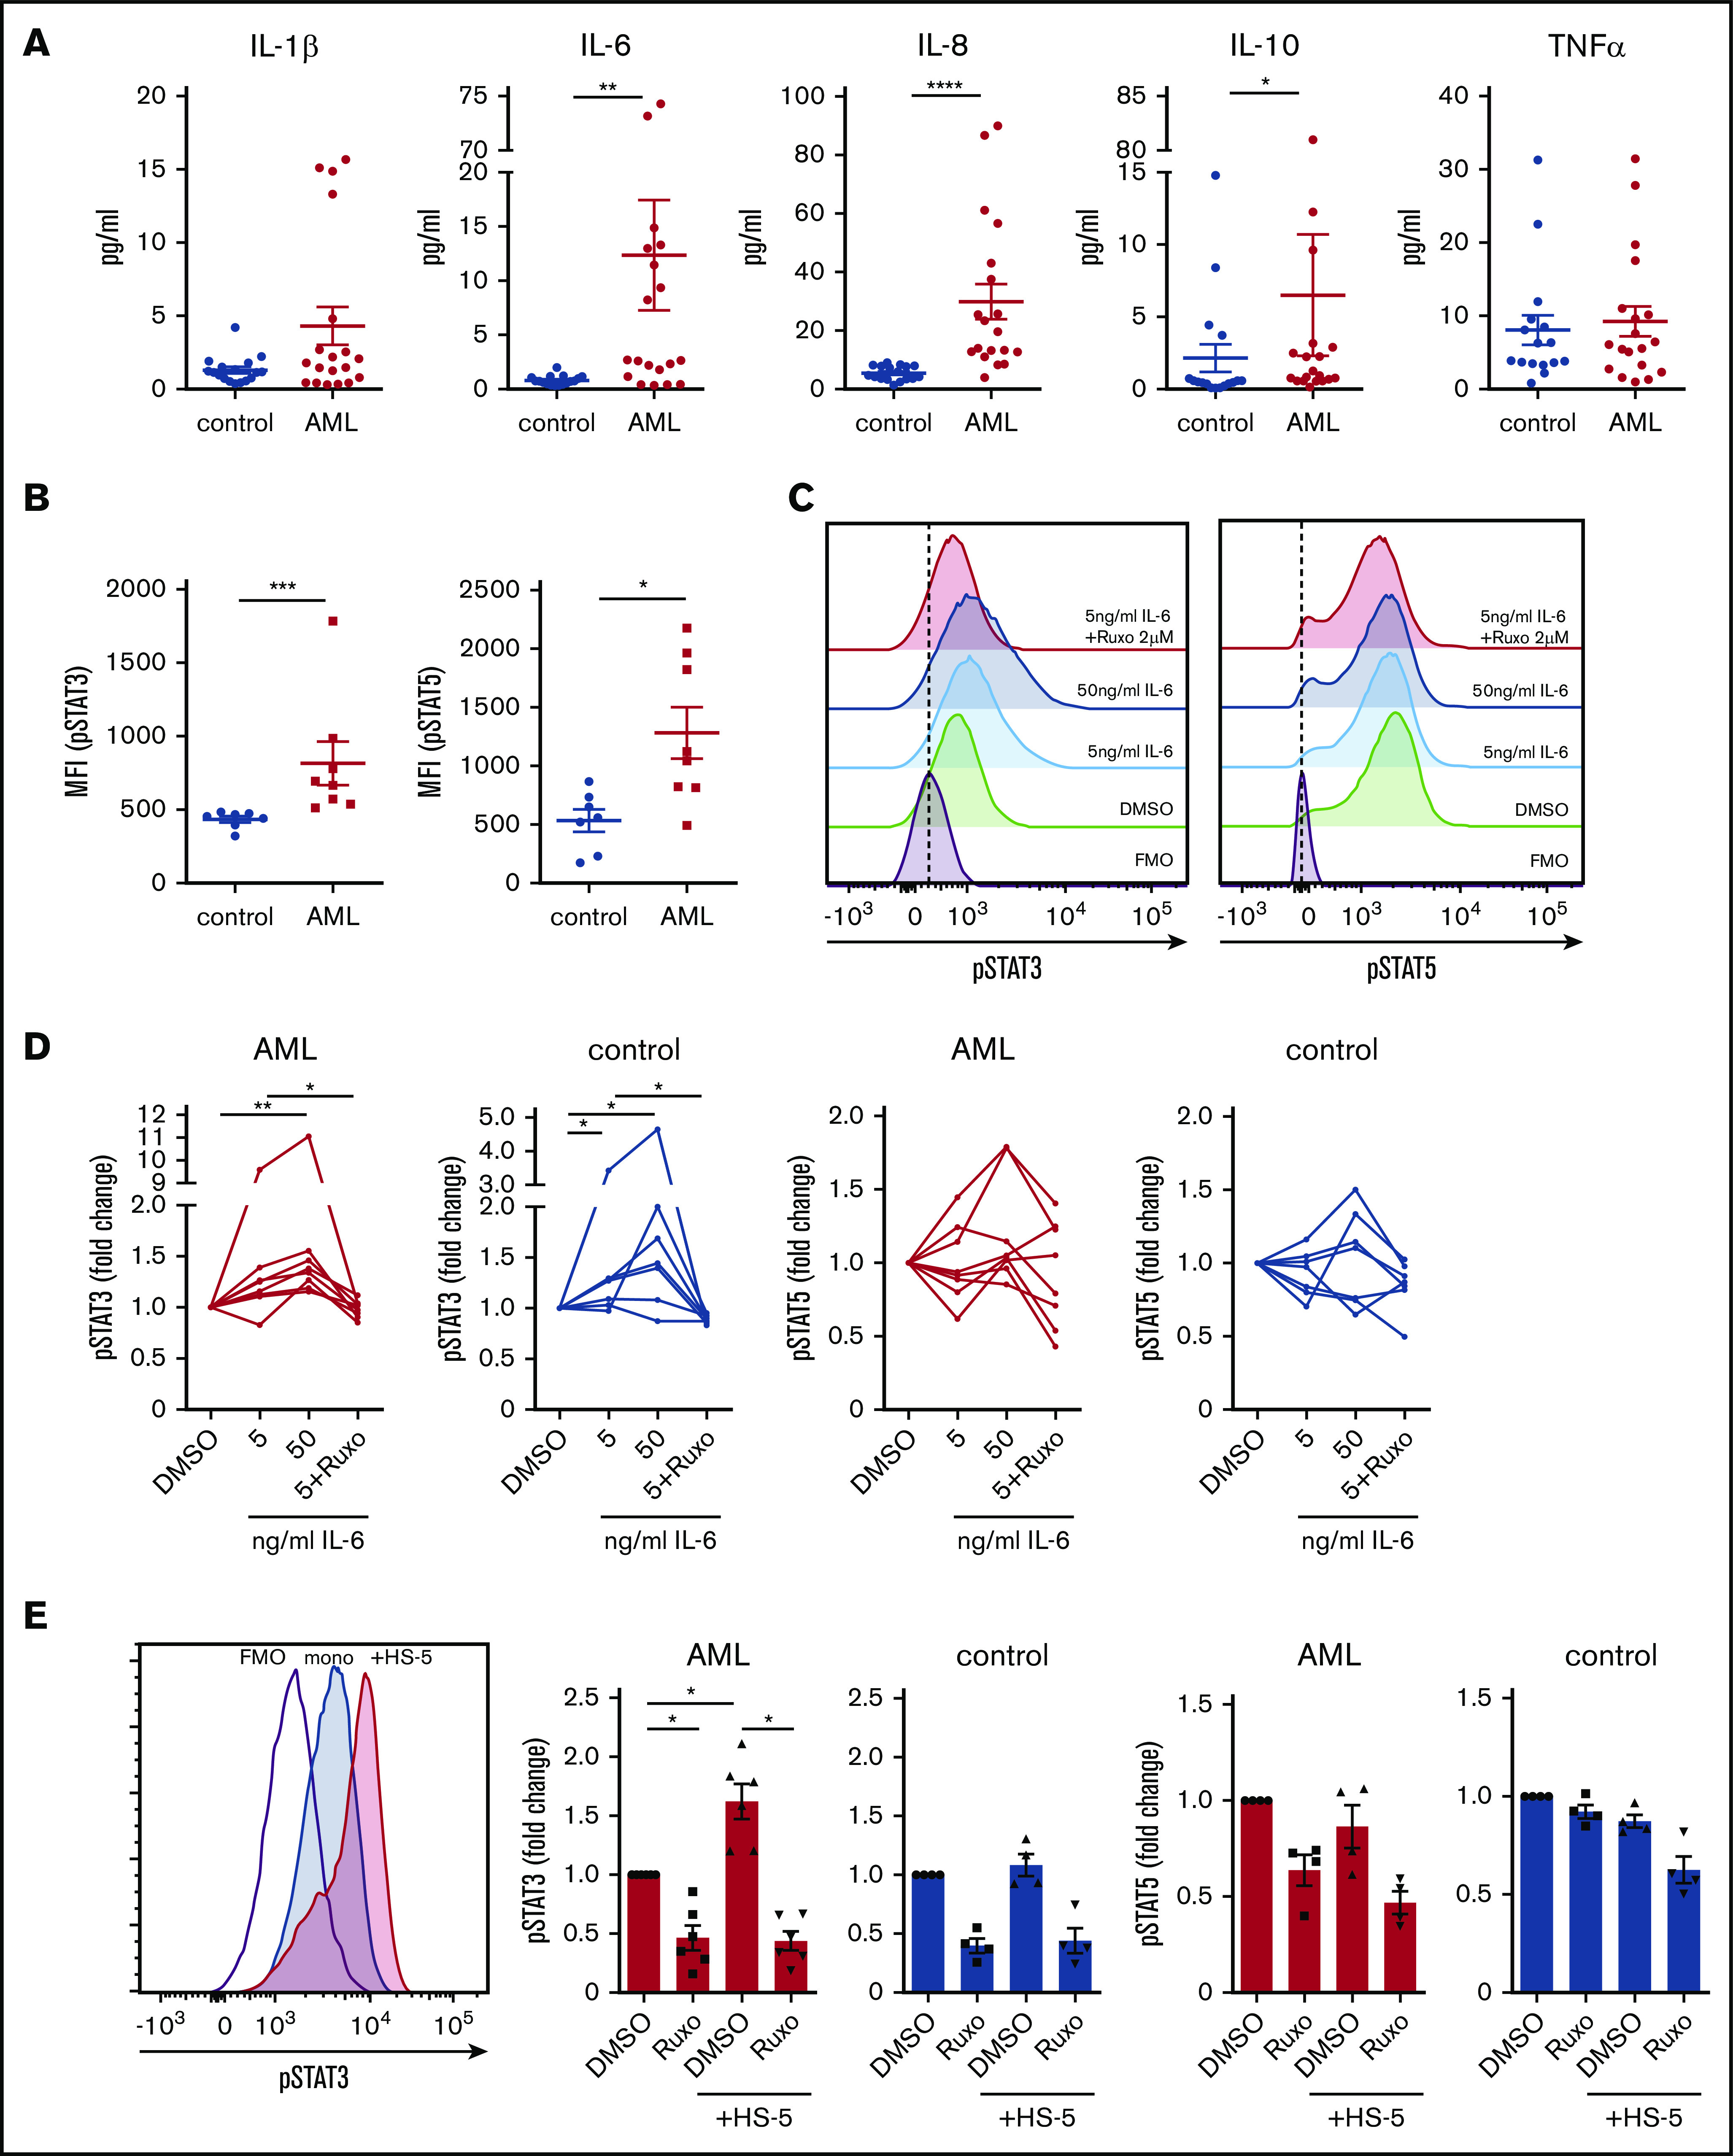
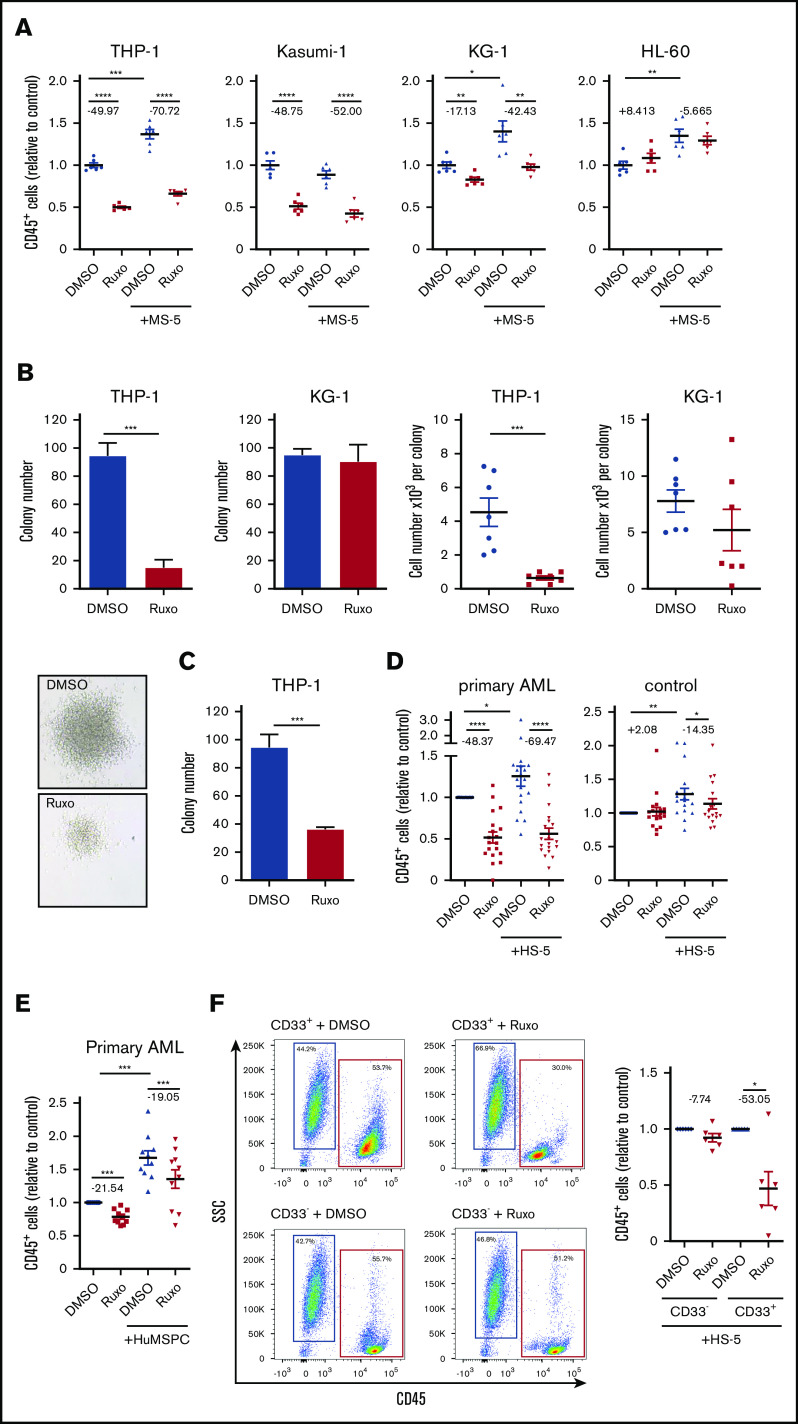
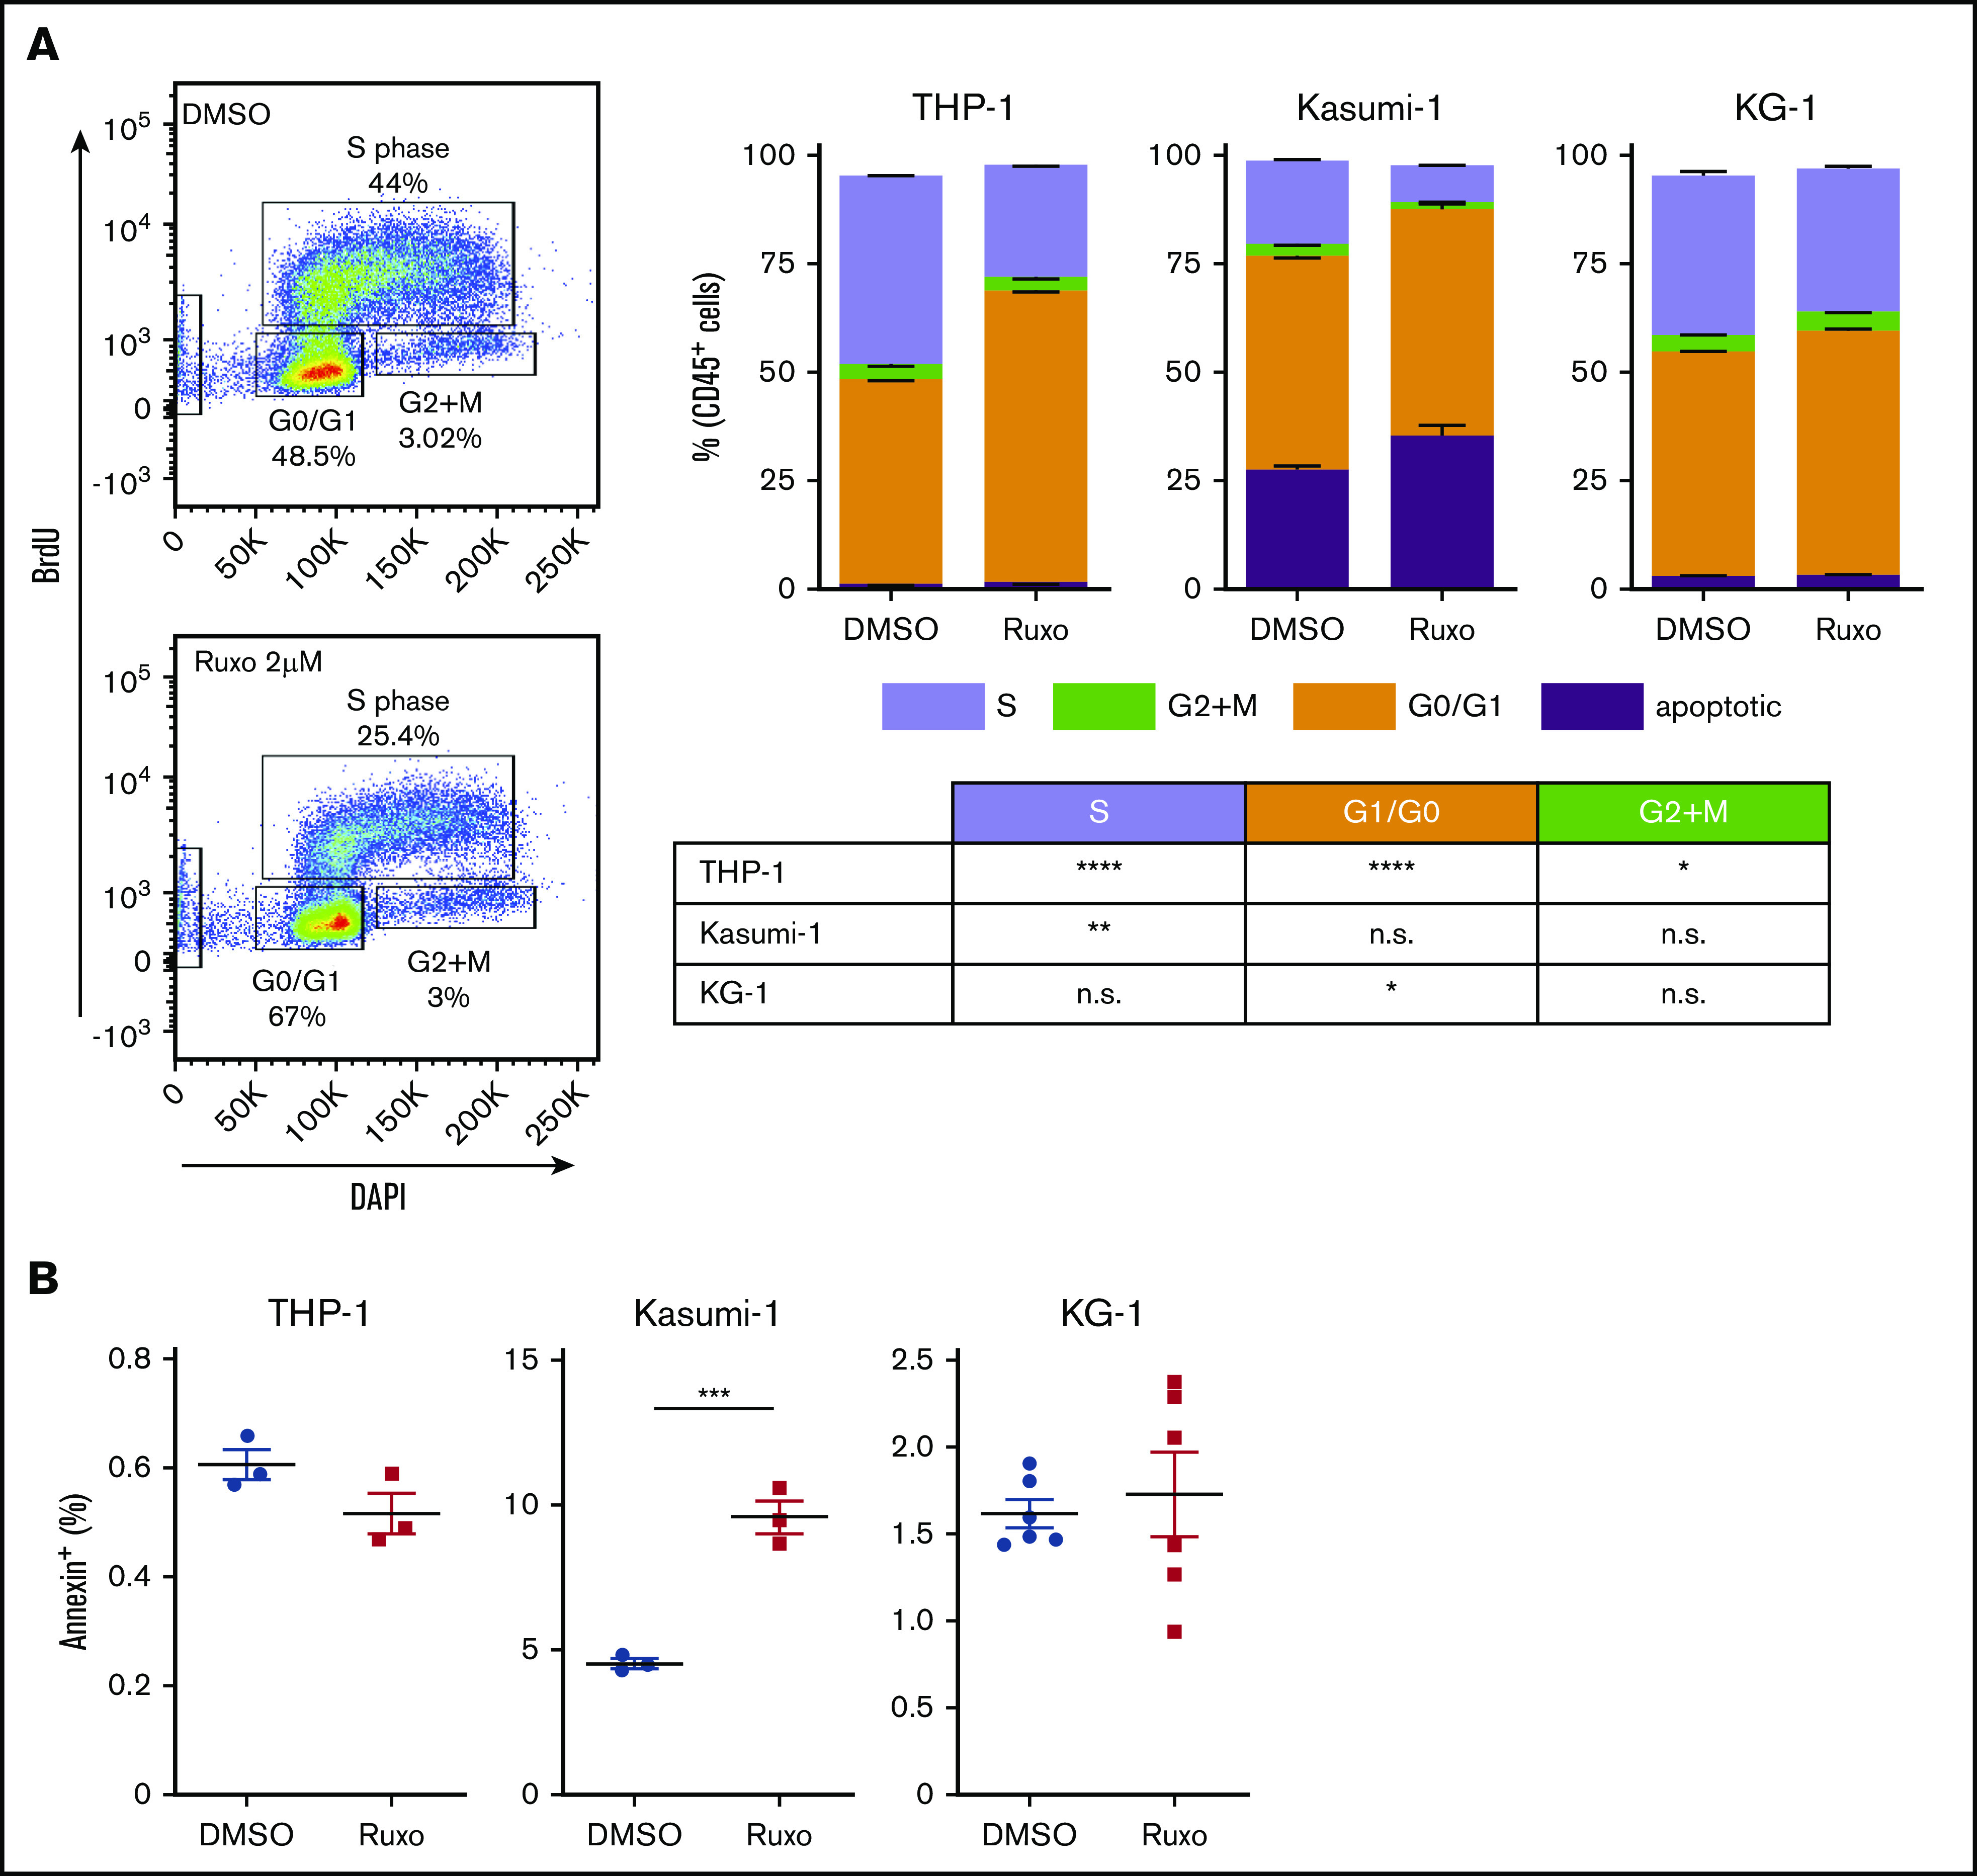
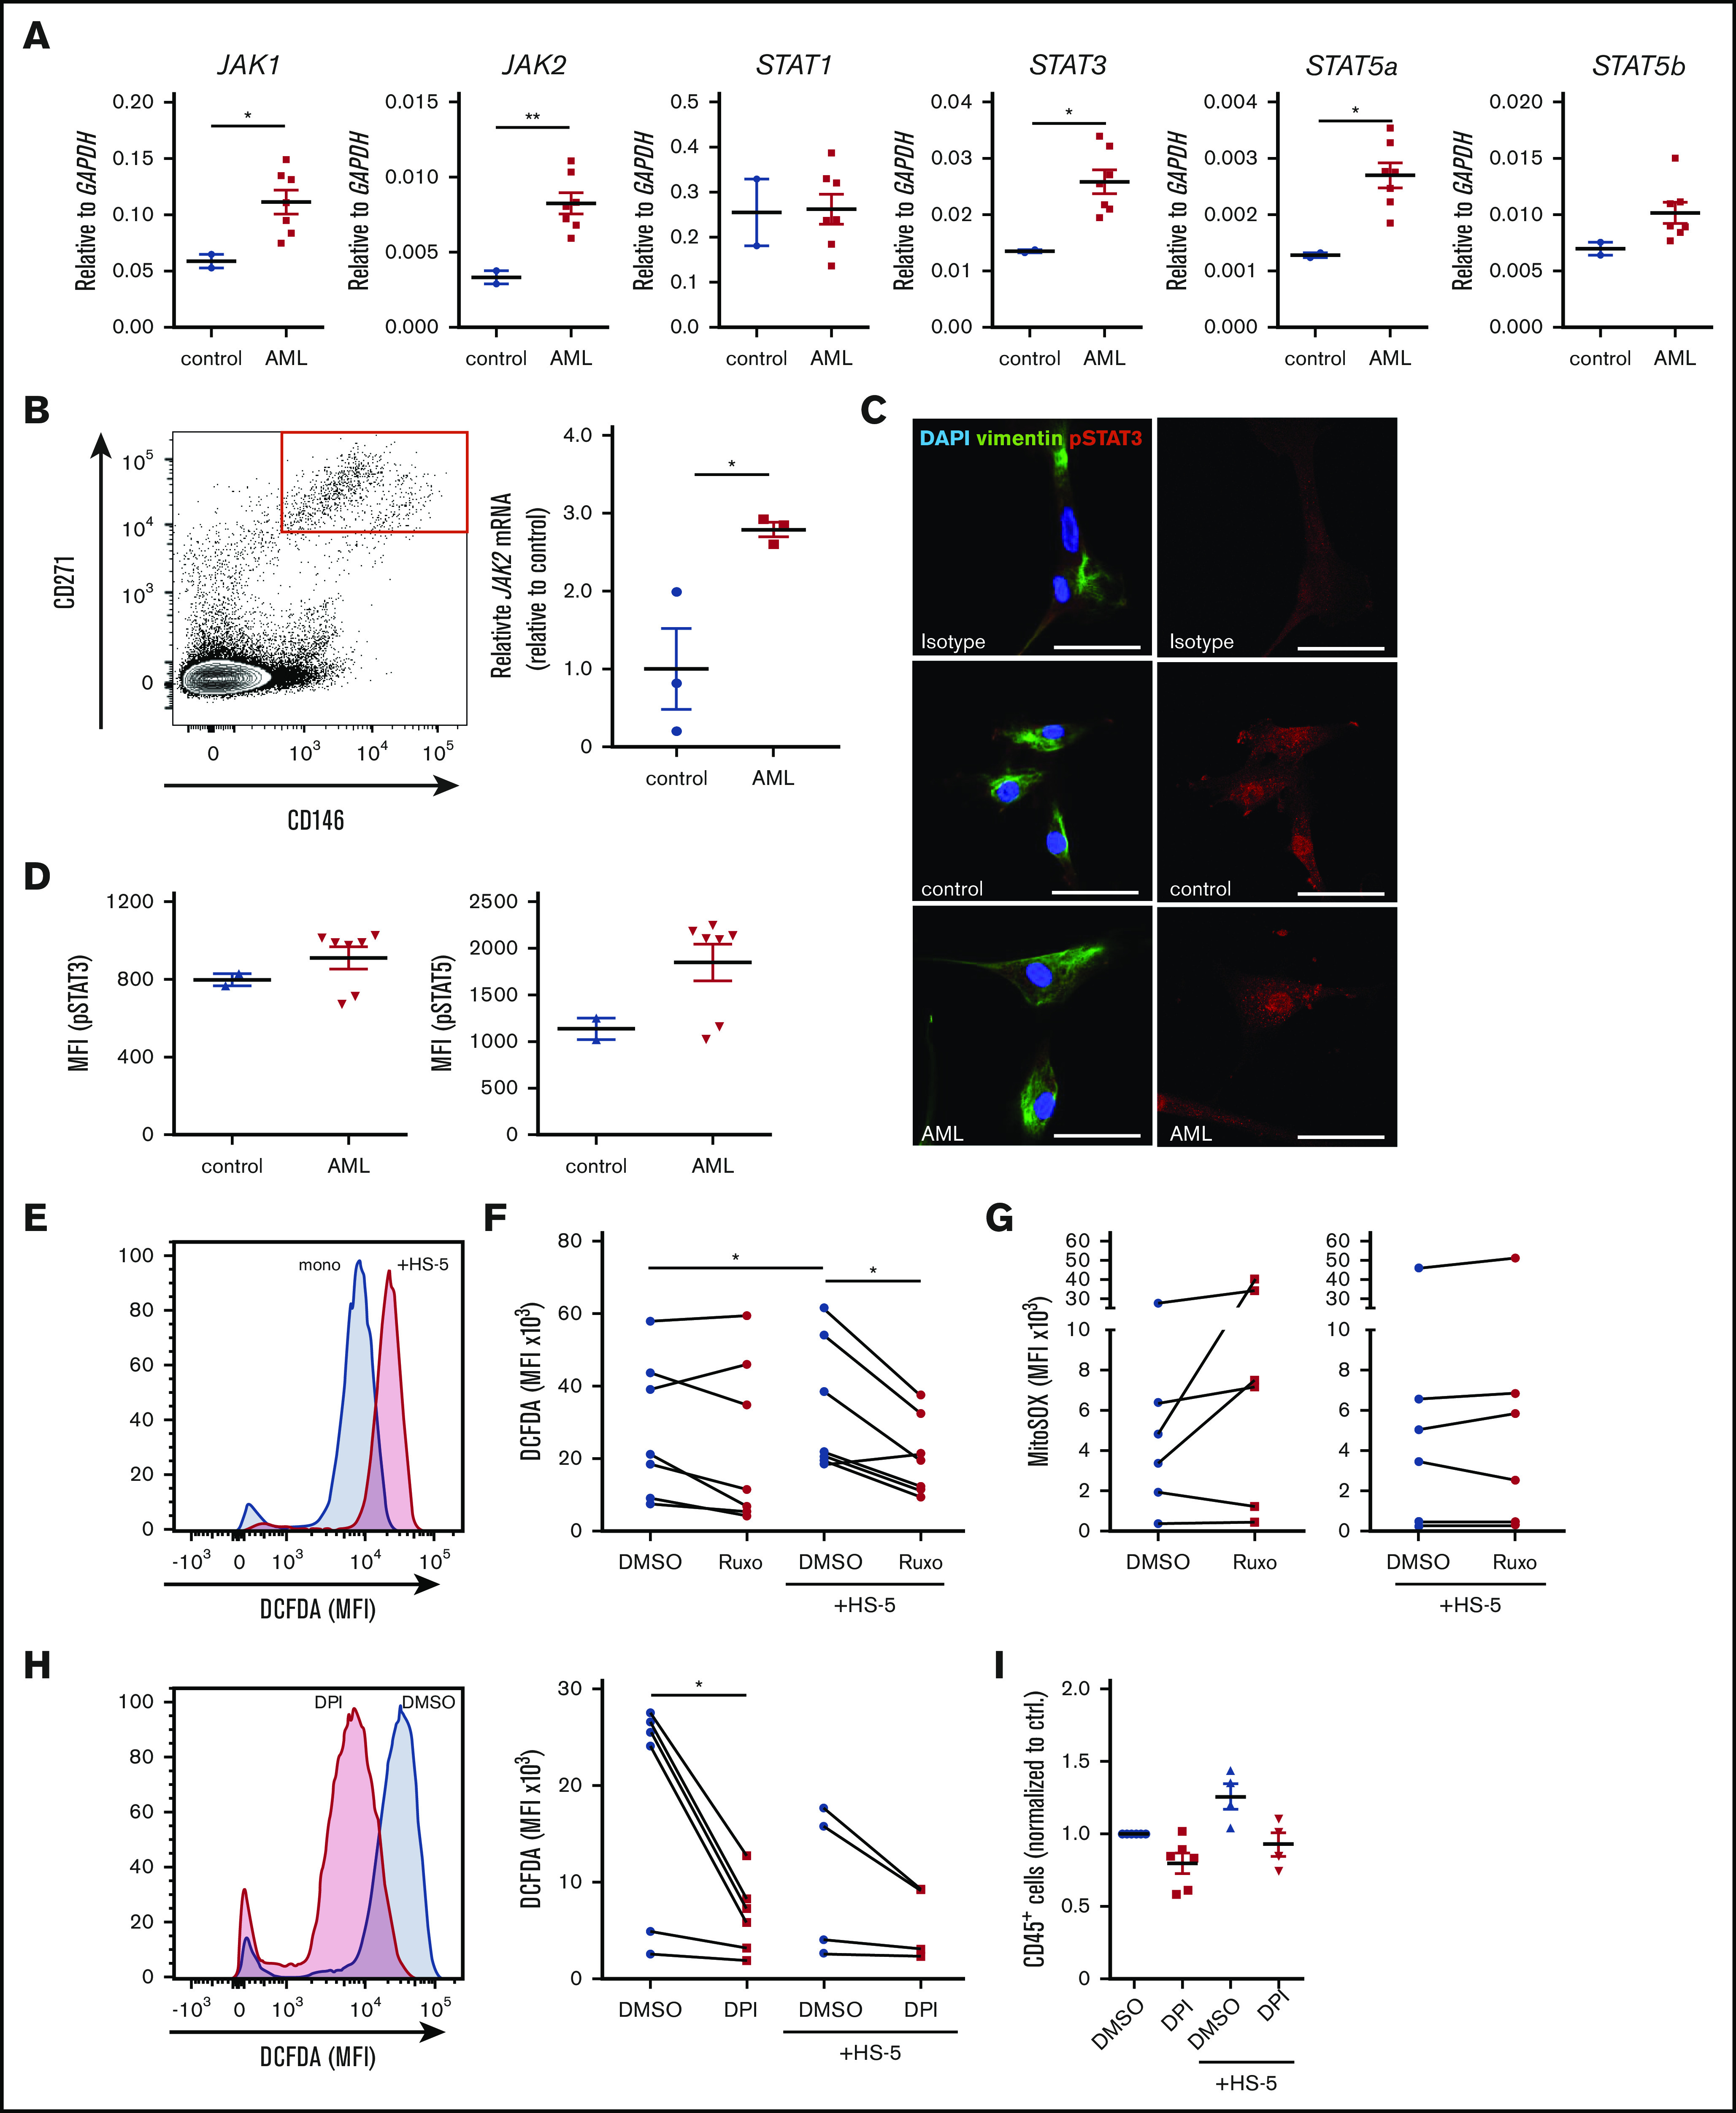
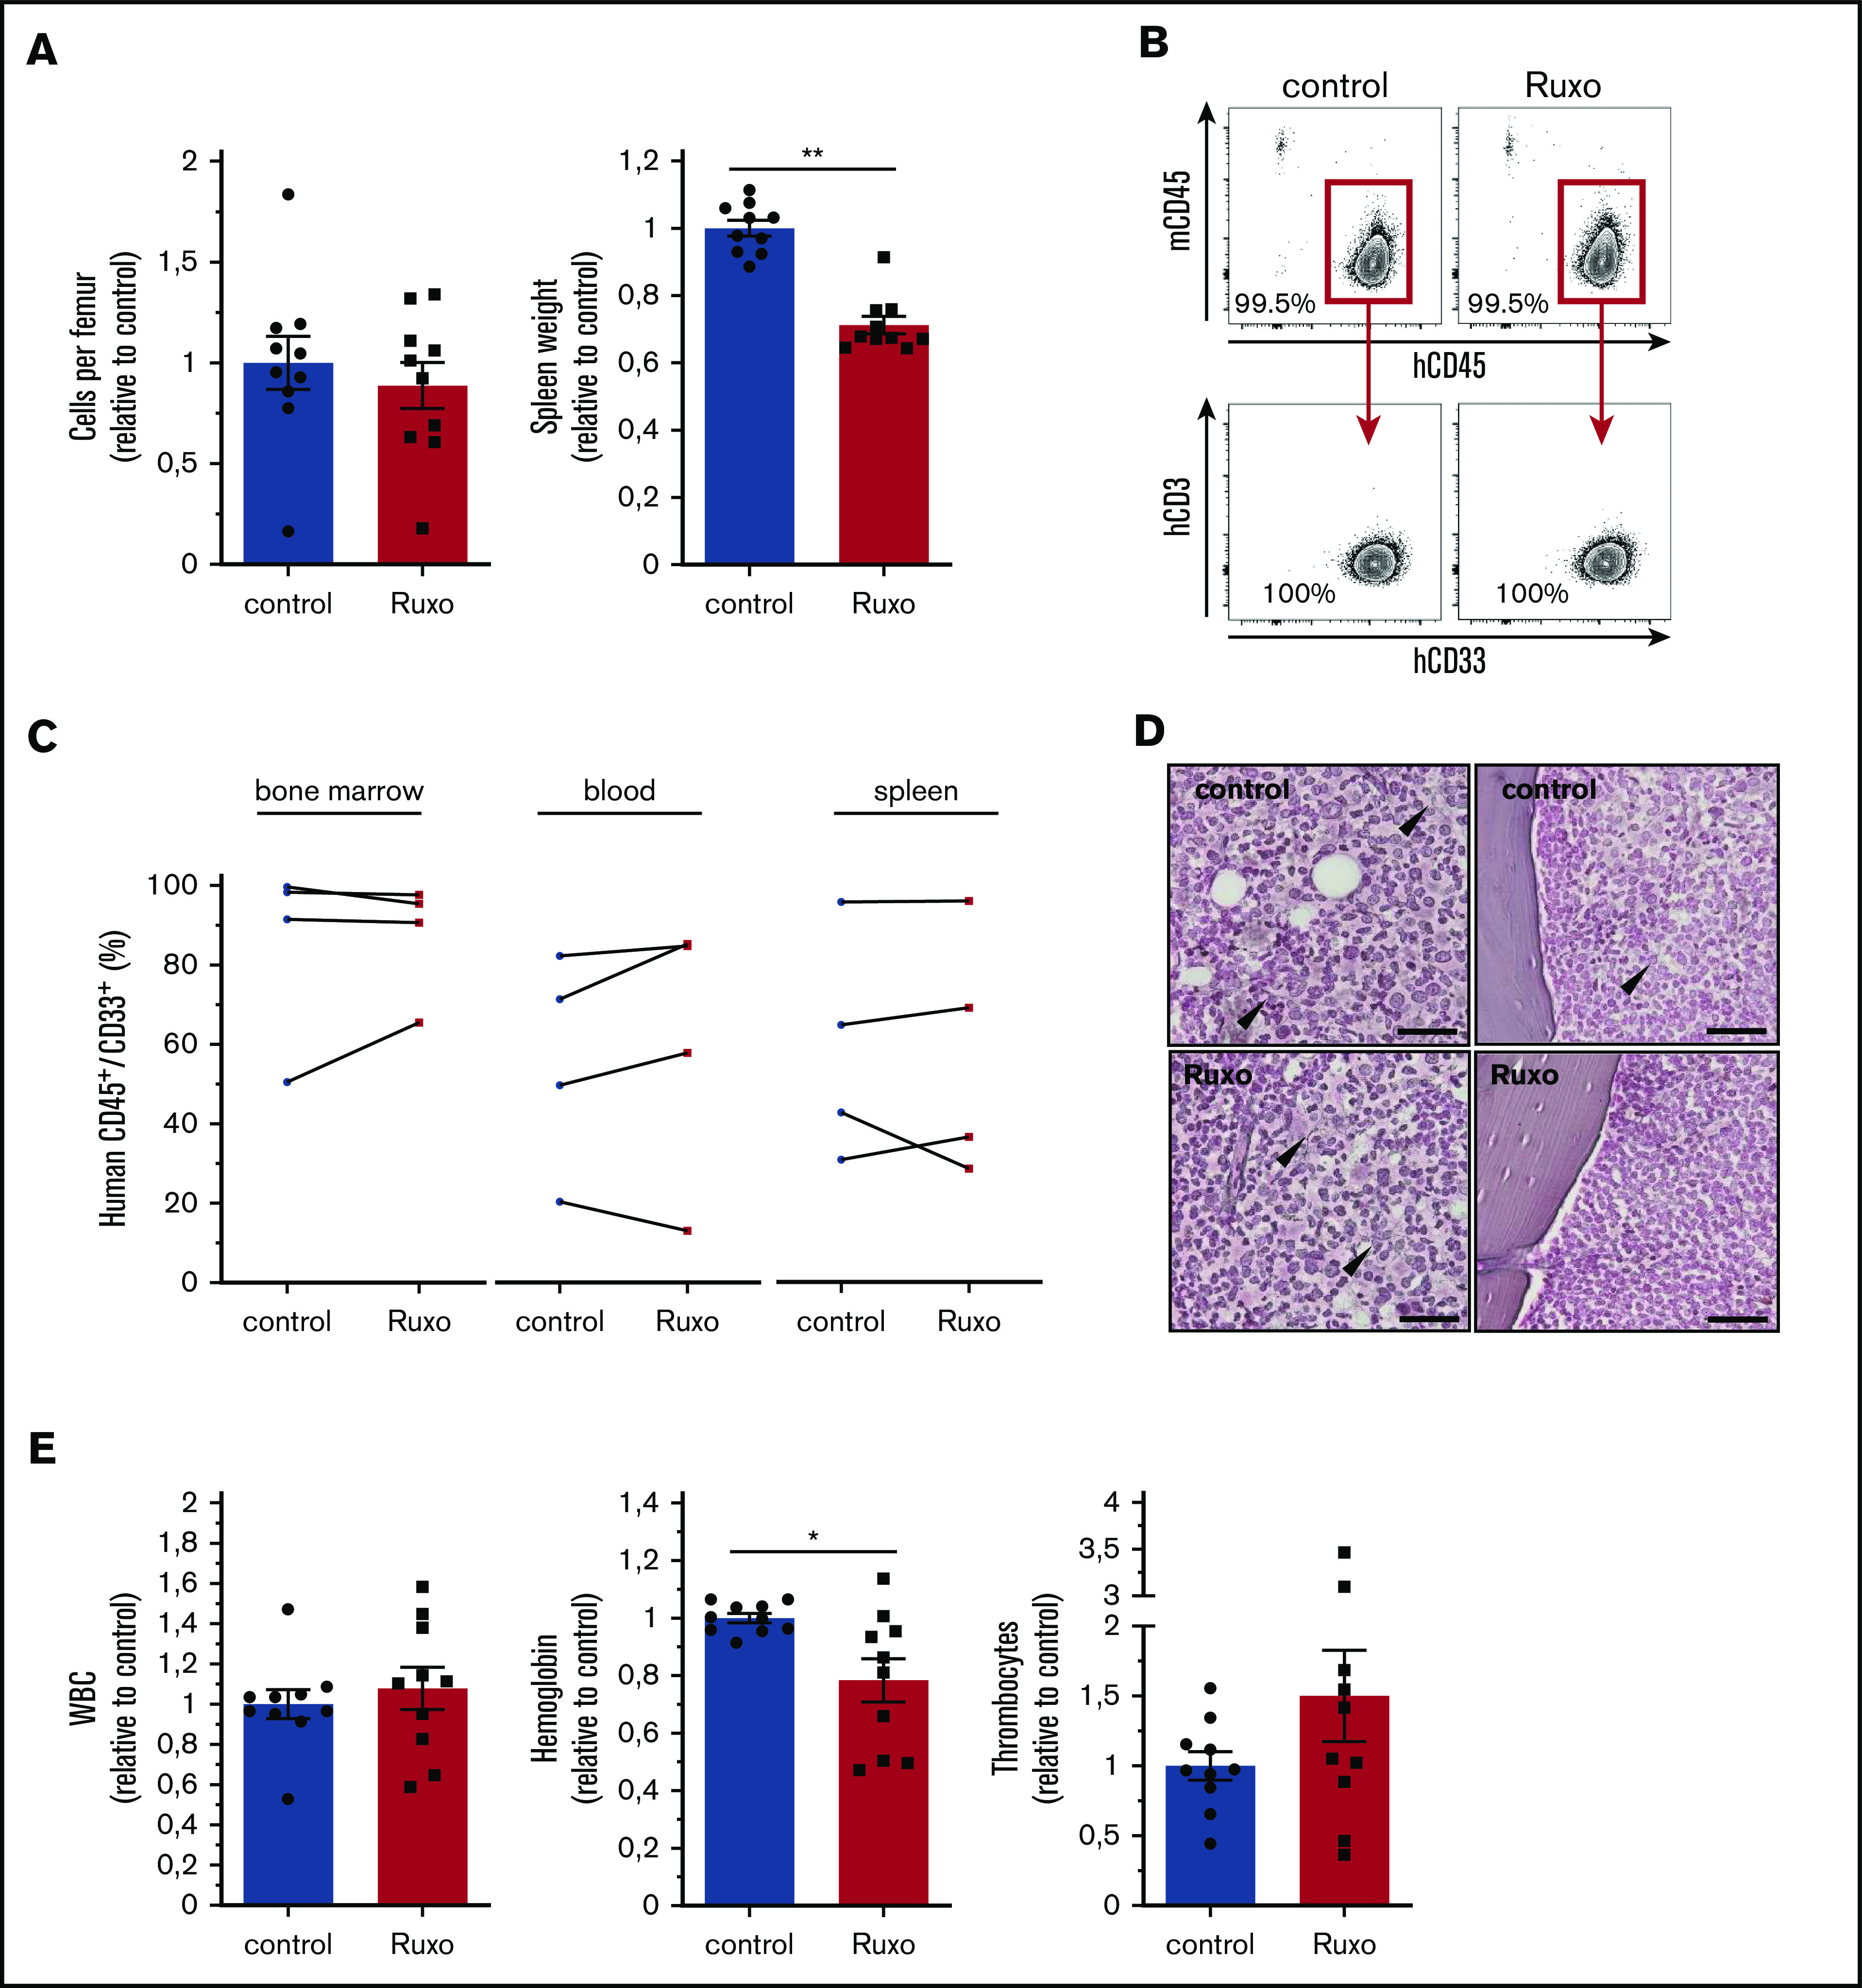
Acute myeloid leukemia (AML) is characterized by a high relapse rate and dismal long-term overall survival which is related to persistence of leukemia-initiating cells in their niche. Different animal models of myeloid malignancies reveal how neoplastic cells alter the structural and functional characteristics of the hematopoietic stem cell niche to reinforce malignancy. Understanding and disruption of the microenvironmental interactions with AML cells are a vital need. Malignant niches frequently go along with inflammatory responses, but their impact on cancerogenesis often remains unexplored. Here, we uncovered an aberrant production of inflammatory cytokines in untreated AML bone marrow that was proved to promote the proliferation of leukemia cells. This inflammatory response induced an activation of the Janus kinase/signal transducer and activator of transcription (JAK/STAT) signaling pathway in AML blasts as well as bone marrow stromal cells that also fostered leukemia proliferation. Inhibition of JAK/STAT signaling using the selective JAK1/2 inhibitor ruxolitinib resulted in significant antileukemic activity in AML in vitro which is mediated through both cell-autonomous and microenvironment-mediated mechanisms. However, in a xenograft transplantation model, monotherapy with ruxolitinib did not achieve substantial antileukemic activity, possibly suggesting a complementary function of JAK1/2 inhibition in AML.


Conflict of interest statement

Conflict-of-interest disclosure: The authors declare no competing financial interests.

Figures

None
Graphical abstract
Figure 1.
Figure 1.
AML induces an inflammatory response in the human bone marrow niche linked to an activation of JAK/STAT signaling. (A) Cytokine concentrations in the extracellular bone marrow fluid of AML patients (n = 19; mean age, 62.1 years ± standard deviation [SD] 12.1) and controls (n = 19; mean age, 58.2 years ± 15.7) quantified by Magnetic Luminex Performance Assay. Corresponding P values are given for each cytokine tested. (B) Median fluorescence intensity (MFI) of pSTAT3 and pSTAT5 in unstimulated peripheral blood mononuclear cells (PBMCs) from AML patients (n = 8) and controls (n = 7) assessed by BD Phosflow technology. (C) Representative flow cytometry plots showing fluorescence intensity of pSTAT3 (left) and pSTAT5 (right) of 1 AML patient sample under indicated conditions. (D) MFI of pSTAT3 (left) and pSTAT5 (right) in PBMCs from AML patients and controls after incubation with either IL-6 at the indicated concentrations or in combination with 2 µM ruxolitinib (Ruxo) for 15 minutes. MFI is given in relation to the unstimulated control condition; linked dots represent 1 patient sample under indicated conditions. (E) Primary human AML cells and controls were cocultured with HS-5 cells and treated with 2 µM ruxolitinib. Left, representative fluorescence intensity of 1 AML patient sample after mono- and coculture compared with fluorescence minus one (FMO) control. Right, MFI of pSTAT3 and pSTAT5 (normalized to monocultured control [n = 4-6]; each primary sample was tested in duplicate). DMSO, dimethyl sulfoxide. Data are shown as mean ± standard error of the mean (SEM). See also supplemental Figure 1. *P < .05; **P < .01; ***P < .001; ****P < .0001 as determined by Mann-Whitney U test or Wilcoxon signed-rank test.
Figure 2.
Figure 2.
Inhibition of JAK/STAT signaling has strong antileukemic efficacy in AML in vitro. (A) Human AML cell lines were either mono- or cocultured with MS-5 stromal cells and treated with 2 µM ruxolitinib or vehicle for 4 days. Absolute numbers of CD45+ cells were normalized to monocultured control (n = 6); for each pair, the mean change in cell count is given in percentage points. (B) In all, 5 × 10⁴ THP-1 or KG-1 cells were treated with 2 µM ruxolitinib or vehicle for 4 days, and then 200 cells were transferred to methylcellulose medium (n = 4). Number of colonies and cell numbers of single colonies were determined after 10 days. Representative colonies of THP-1 cells are shown below. (C) Primary colony formation of equal numbers of viable THP-1 cells after treatment with ruxolitinib or vehicle (n = 4). (D) Primary human AML cells or PBMCs as controls were either mono- or cocultured with HS-5 cells and treated with 2 µM ruxolitinib or vehicle for 4 days. Absolute numbers of CD45+ cells were normalized to monocultured control (n = 18-19 different AML or control donors; each primary sample was tested in triplicate); for each pair the change in cell count is given in percentage points. (E) Primary human AML cells were either mono- or cocultured with bone marrow–derived primary human mesenchymal stem and progenitor cells (HuMSPCs) and treated with 2 µM ruxolitinib or vehicle. Absolute numbers of CD45+ cells were normalized to monocultured control (n = 10 different AML and 2 different HuMSPC donors; each primary AML sample was tested in triplicate); for each pair, the change in cell count is given in percentage points. (F) CD33+ and CD33 PBMCs from an individual AML patient were separated by FACS and treated with 2 µM ruxolitinib or vehicle in coculture with HS-5 stromal cells for 4 days. Left, representative flow cytometry plots gated on 4′,6-diamidino-2-phenylindole (DAPI) single cells after treatment with 2 µM ruxolitinib or vehicle. Right, absolute cell numbers of isolated CD33+ and CD33 cells after ruxolitinib or vehicle treatment normalized to control (n = 6 different AML donors; each primary sample was tested in triplicate); for each pair, the change in cell count is given in percentage points. Data are shown as mean ± SEM. See also supplemental Figure 2. *P < .05; **P < .01; ***P < .001; ****P < .0001 determined by Student t test or Wilcoxon signed-rank test. SSC, side scatter.
Figure 3.
Figure 3.
Ruxolitinib inhibits proliferation of AML cells. (A) Cell proliferation analysis by FACS using BD bromodeoxyuridine (BrdU) flow assay. Left, representative plots; right quantification for different AML cell lines treated with 2 µM ruxolitinib or vehicle for 2 days (n = 3-6). (B) Quantification of apoptotic cells by Annexin V assay in different AML cell lines after treatment with 2 µM ruxolitinib or vehicle for 3 days (n = 3-6). Data are shown as mean ± SEM. See also supplemental Figure 3.  *P < .05; **P < .01; ***P < .001; ****P < .0001 as determined by Student t test. n.s., not significant.
Figure 4.
Figure 4.
Ruxolitinib targets inflammation-induced JAK/STAT signaling in leukemia microenvironment and ROS production. (A) JAK1/2, STAT1/3/5a/5b gene expression analysis in sorted bone marrow-derived primary human mesenchymal stem and progenitor cells after coculture with primary human AML cells (n = 7) or healthy controls (n = 2) for 4 days by real-time polymerase chain reaction (PCR) (each primary sample was tested in triplicate). (B) Left, representative FACS plot of CD271+CD146+ primary human bone marrow mesenchymal stem and progenitor cells, gated on CD45CD235CD31 cells. Right, JAK2 gene expression analysis in sorted bone marrow mesenchymal stem and progenitor cells from AML patients or nonleukemic controls at first diagnosis by real-time PCR (n = 3, data normalized to control). (C) Confocal images from primary human mesenchymal stem and progenitor cells after coculture with nonleukemic mononuclear cells (control) or primary human AML cells stained for vimentin and pSTAT3. The scale bars, 50 µm. (D) primary human AML cells (n = 7) and controls (n = 2) were cocultured with bone marrow–derived primary human mesenchymal stem and progenitor cells. MFI of pSTAT3 and pSTAT5 of stromal cells assessed by BD Phosflow technology (each sample was tested in duplicate). (E-F) Intracellular ROS production detected by measuring 2′,7′-dichlorofluorescin diacetate (DCFDA) in primary human AML cells in mono- or coculture with HS-5 stromal cells. (E) Exemplary FACS plot showing the MFI of DCFDA in 1 DMSO-treated AML patient sample mono- or cocultured with HS-5 stromal cells. (F) Intracellular ROS production in mono- or cocultured primary human AML cells after treatment with 2 µM ruxolitinib for 4 days (n = 7-9 different primary AML samples; each primary sample was tested in triplicate; connecting lines represent 1 patient sample). (G) Mitochondrial superoxide (MitoSOX) production in mono- or cocultured primary human AML cells after treatment with 2 µM ruxolitinib or vehicle using MitoSOX Red reagent (n = 6 different primary AML samples; each primary sample was tested in triplicate, connecting lines represent 1 patient sample). (H) Intracellular ROS production was detected by measuring DCFDA in mono- or cocultured primary human AML cells treated with 0.5 µM diphenyleneiodonium (DPI) or vehicle for 2 days. Left, representative FACS plot showing the MFI of DCFDA in 1 AML patient sample treated with DPI or vehicle. Right, quantification of intracellular ROS production in primary human AML cells in mono- or coculture with HS-5 stromal cells (n = 4-6 different primary AML samples; each primary sample was tested in triplicate; connecting lines represent 1 patient sample). (I) Primary human AML cells were either mono- or cocultured with HS5 cells and treated with 0.5 µM DPI or vehicle for 2 days. Absolute numbers of CD45+ cells were normalized to monocultured control (n = 4-6 different AML donors; each primary sample was tested in triplicate). Data are shown as mean ± SEM. See also supplemental Figure 4. *P < .05; **P < .01 determined by Student t test, Wilcoxon signed-rank test, or Mann-Whitney U test.
Figure 5.
Figure 5.
Ruxolitinib reduces spleen size but lacks antileukemic activity in vivo. (A) cells per femur and wet spleen weight (data normalized to control). (B) Flow cytometry gating strategy for bone marrow analysis of human hematopoietic engraftment by gating on human hCD45+ cells, detecting exclusively myeloid hCD33+ cells, and excluding hCD3+ cells for each experimental condition. (C) Human AML engraftment in bone marrow, peripheral blood, and spleen (n = 4 different primary AML samples; 2-4 mice per group per sample. Data normalized to control). (D) Representative images of reticulum staining on femur sections. Arrowheads indicate reticular fibers. Scale bars, 50 µm. (E) Peripheral blood counts of ruxolitinib- or vehicle-treated leukemic NSG mice (data normalized to control). Data are shown as mean ± SEM. See also supplemental Figure 5. *P < .05; **P < .01 determined by Wilcoxon signed-rank test.

References

    1. Döhner H, Estey E, Grimwade D, et al. Diagnosis and management of AML in adults: 2017 ELN recommendations from an international expert panel. Blood. 2017;129(4):424-447. - PMC - PubMed
    1. Hanoun M, Zhang D, Mizoguchi T, et al. Acute myelogenous leukemia-induced sympathetic neuropathy promotes malignancy in an altered hematopoietic stem cell niche. Cell Stem Cell. 2014;15(3):365-375. - PMC - PubMed
    1. Duarte D, Hawkins ED, Akinduro O, et al. Inhibition of endosteal vascular niche remodeling rescues hematopoietic stem cell loss in AML. Cell Stem Cell. 2018;22(1):64-77.e6. - PMC - PubMed
    1. Pinho S, Frenette PS. Haematopoietic stem cell activity and interactions with the niche. Nat Rev Mol Cell Biol. 2019;20(5):303-320. - PMC - PubMed
    1. Medyouf H, Mossner M, Jann JC, et al. Myelodysplastic cells in patients reprogram mesenchymal stromal cells to establish a transplantable stem cell niche disease unit. Cell Stem Cell. 2014;14(6):824-837. - PubMed

Publication types