

Quantitative proteomic analysis of the frontal cortex in Alzheimer's disease
- PMID: 32614981
- PMCID: PMC7775912
- DOI: 10.1111/jnc.15116
Quantitative proteomic analysis of the frontal cortex in Alzheimer's disease
Abstract
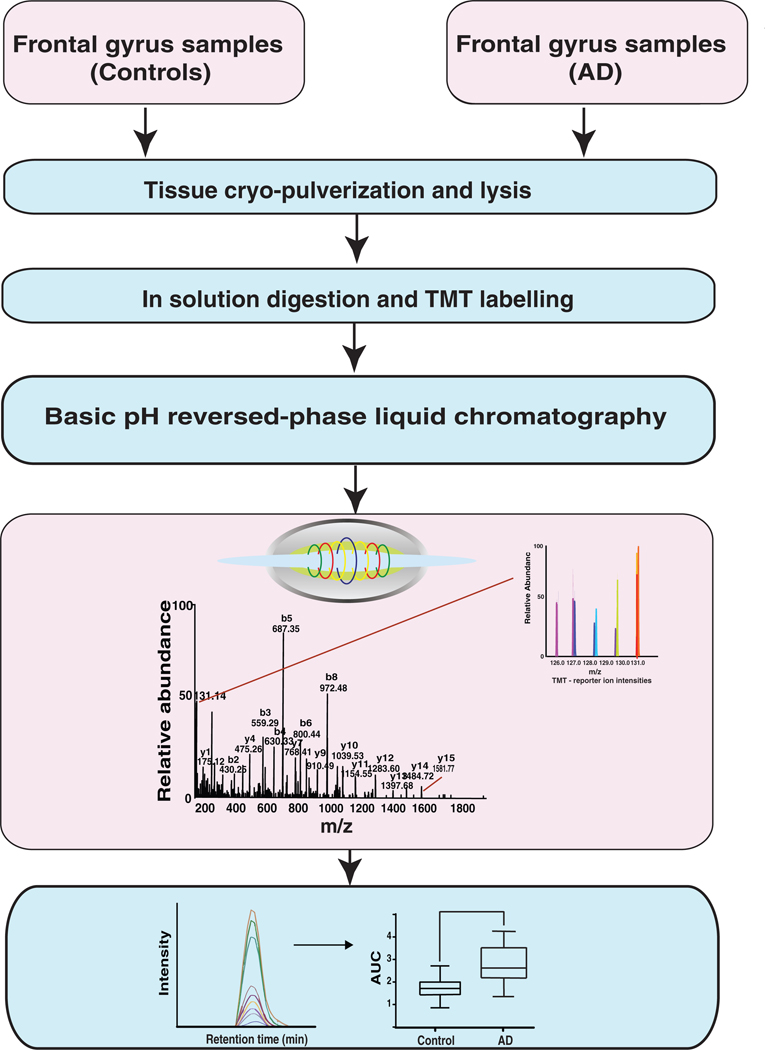
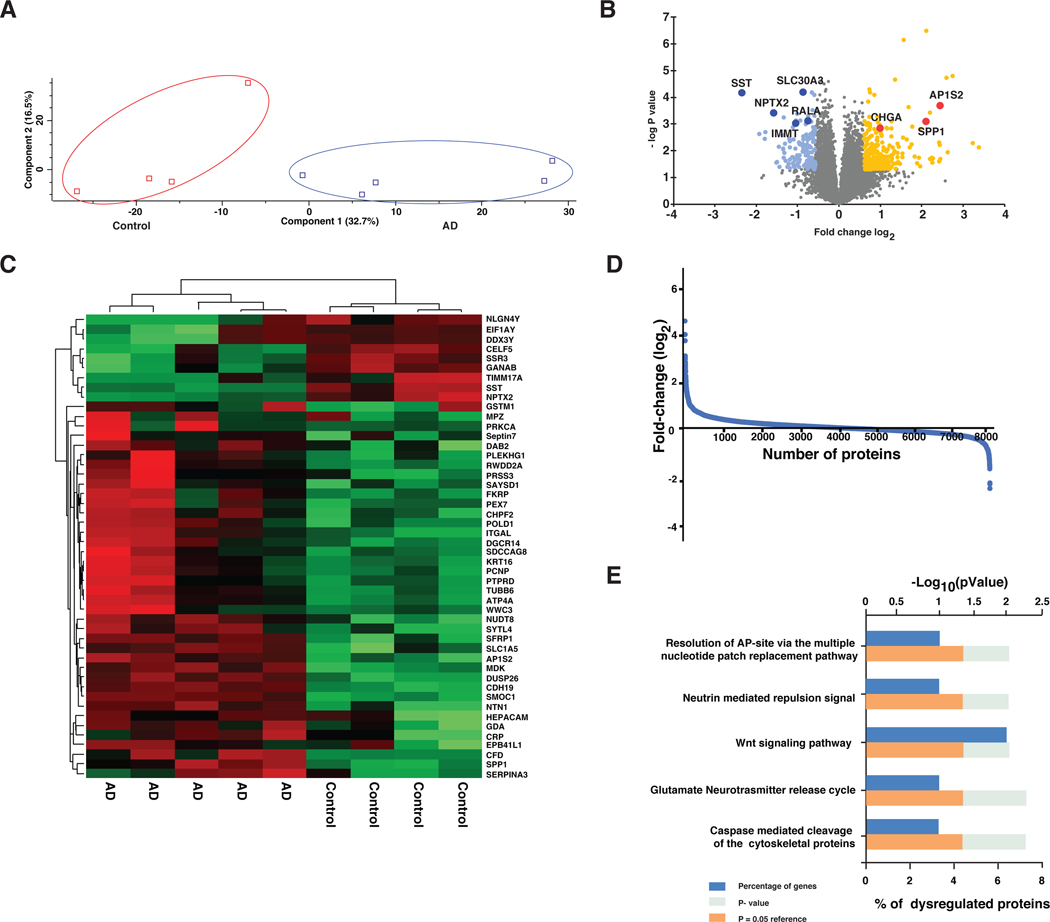
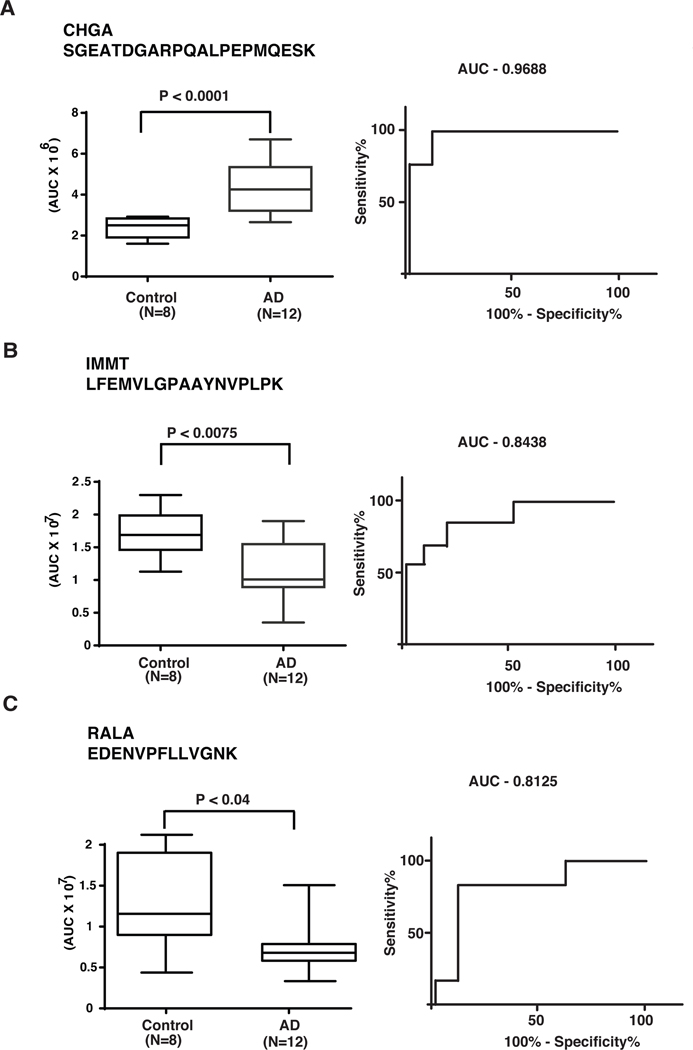
Alzheimer's disease (AD) is a chronic neurodegenerative disease characterized by intracellular formation of neurofibrillary tangles and extracellular deposition of β-amyloid protein (Aβ) in the extracellular matrix. The pathogenesis of AD has not yet been fully elucidated and little is known about global alterations in the brain proteome that are related to AD. To identify and quantify such AD-related changes in the brain, we employed a tandem mass tags approach coupled to high-resolution mass spectrometry. We compared the proteomes of frontal cortex from AD patients with corresponding age-matched brain samples. Liquid chromatography-mass spectrometry/MS analysis carried out on an Orbitrap Fusion Lumos Tribrid mass spectrometer led to identification of 8,066 proteins. Of these, 432 proteins were observed to be significantly altered (>1.5 fold) in their expression in AD brains. Proteins whose abundance was previously known to be altered in AD were identified including secreted phosphoprotein 1 (SPP1), somatostatin (SST), SPARC-related modular calcium binding 1 (SMOC1), dual specificity phosphatase 26 (DUSP26), and neuronal pentraxin 2 (NPTX2). In addition, we identified several novel candidates whose association with AD has not been previously described. Of the novel molecules, we validated chromogranin A (CHGA), inner membrane mitochondrial protein (IMMT) and RAS like proto-oncogene A (RALA) in an additional set of 20 independent brain samples using targeted parallel reaction monitoring mass spectrometry assays. The differentially expressed proteins discovered in our study, once validated in larger cohorts, should help discern the pathogenesis of AD.
Keywords: AD; TMT; neurodegeneration; proteome.
© 2020 International Society for Neurochemistry.
Figures

Similar articles
-
Multiplexed Phosphoproteomic Study of Brain in Patients with Alzheimer's Disease and Age-Matched Cognitively Healthy Controls.OMICS. 2020 Apr;24(4):216-227. doi: 10.1089/omi.2019.0191. Epub 2020 Mar 17. OMICS. 2020. PMID: 32182160 Free PMC article.
-
Integrated analysis of ultra-deep proteomes in cortex, cerebrospinal fluid and serum reveals a mitochondrial signature in Alzheimer's disease.Mol Neurodegener. 2020 Jul 25;15(1):43. doi: 10.1186/s13024-020-00384-6. Mol Neurodegener. 2020. PMID: 32711556 Free PMC article.
-
Proteomics analysis of prefrontal cortex of Alzheimer's disease patients revealed dysregulated proteins in the disease and novel proteins associated with amyloid-β pathology.Cell Mol Life Sci. 2023 May 7;80(6):141. doi: 10.1007/s00018-023-04791-y. Cell Mol Life Sci. 2023. PMID: 37149819 Free PMC article.
-
Exploring the Role of Aggregated Proteomes in the Pathogenesis of Alzheimer's Disease.Curr Protein Pept Sci. 2020;21(12):1164-1173. doi: 10.2174/1389203721666200921152246. Curr Protein Pept Sci. 2020. PMID: 32957903 Review.
-
Molecular and Cellular Basis of Neurodegeneration in Alzheimer's Disease.Mol Cells. 2017 Sep 30;40(9):613-620. doi: 10.14348/molcells.2017.0096. Epub 2017 Sep 20. Mol Cells. 2017. PMID: 28927263 Free PMC article. Review.
Cited by
-
Biomarker Genes Discovery of Alzheimer's Disease by Multi-Omics-Based Gene Regulatory Network Construction of Microglia.Brain Sci. 2022 Sep 5;12(9):1196. doi: 10.3390/brainsci12091196. Brain Sci. 2022. PMID: 36138932 Free PMC article.
-
SMOC1 colocalizes with Alzheimer's disease neuropathology and delays Aβ aggregation.Acta Neuropathol. 2024 Nov 25;148(1):72. doi: 10.1007/s00401-024-02819-6. Acta Neuropathol. 2024. PMID: 39585417 Free PMC article.
-
Midkine Attenuates Aβ Fibril Assembly and AmyloidPlaque Formation.Res Sq [Preprint]. 2024 Jun 7:rs.3.rs-4361125. doi: 10.21203/rs.3.rs-4361125/v1. Res Sq. 2024. Update in: Nat Struct Mol Biol. 2025 Aug 21. doi: 10.1038/s41594-025-01657-8. PMID: 38883748 Free PMC article. Updated. Preprint.
-
Midkine Attenuates Aβ Fibril Assembly and Amyloid Plaque Formation.bioRxiv [Preprint]. 2025 Mar 20:2025.03.20.644383. doi: 10.1101/2025.03.20.644383. bioRxiv. 2025. Update in: Nat Struct Mol Biol. 2025 Aug 21. doi: 10.1038/s41594-025-01657-8. PMID: 40166321 Free PMC article. Updated. Preprint.
-
Multiomics from Alzheimer's Brains and Mesenchymal Stem Cell-Derived Extracellular Vesicles Identifies Therapeutic Potential of Specific Subpopulations to Target Mitochondrial Proteostasis.J Cent Nerv Syst Dis. 2025 Apr 23;17:11795735251336302. doi: 10.1177/11795735251336302. eCollection 2025. J Cent Nerv Syst Dis. 2025. PMID: 40297324 Free PMC article.
References
-
- Albert MS, DeKosky ST, Dickson D. et al. (2011) The diagnosis of mild cognitive impairment due to Alzheimer’s disease: recommendations from the National Institute on Aging-Alzheimer’s Association workgroups on diagnostic guidelines for Alzheimer’s disease. Alzheimers Dement 7, 270–279. - PMC - PubMed
Publication types
MeSH terms
Substances
Grants and funding
LinkOut - more resources
Full Text Sources
Medical
Molecular Biology Databases
Research Materials
Miscellaneous
