. 2020 Aug 6;182(3):563-577.e20.
doi: 10.1016/j.cell.2020.06.021. Epub 2020 Jul 1.

CD81 Controls Beige Fat Progenitor Cell Growth and Energy Balance via FAK Signaling

Affiliations

CD81 Controls Beige Fat Progenitor Cell Growth and Energy Balance via FAK Signaling

Yasuo Oguri et al. Cell. .

Abstract

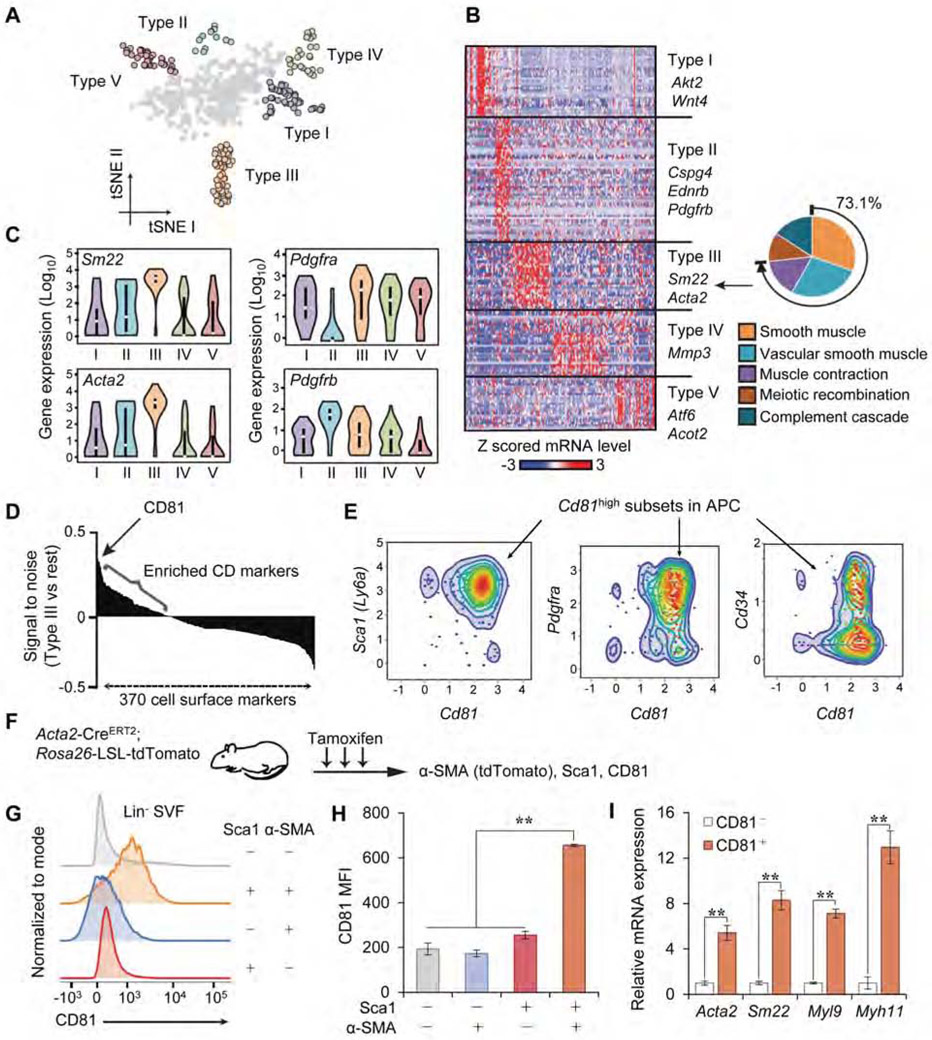
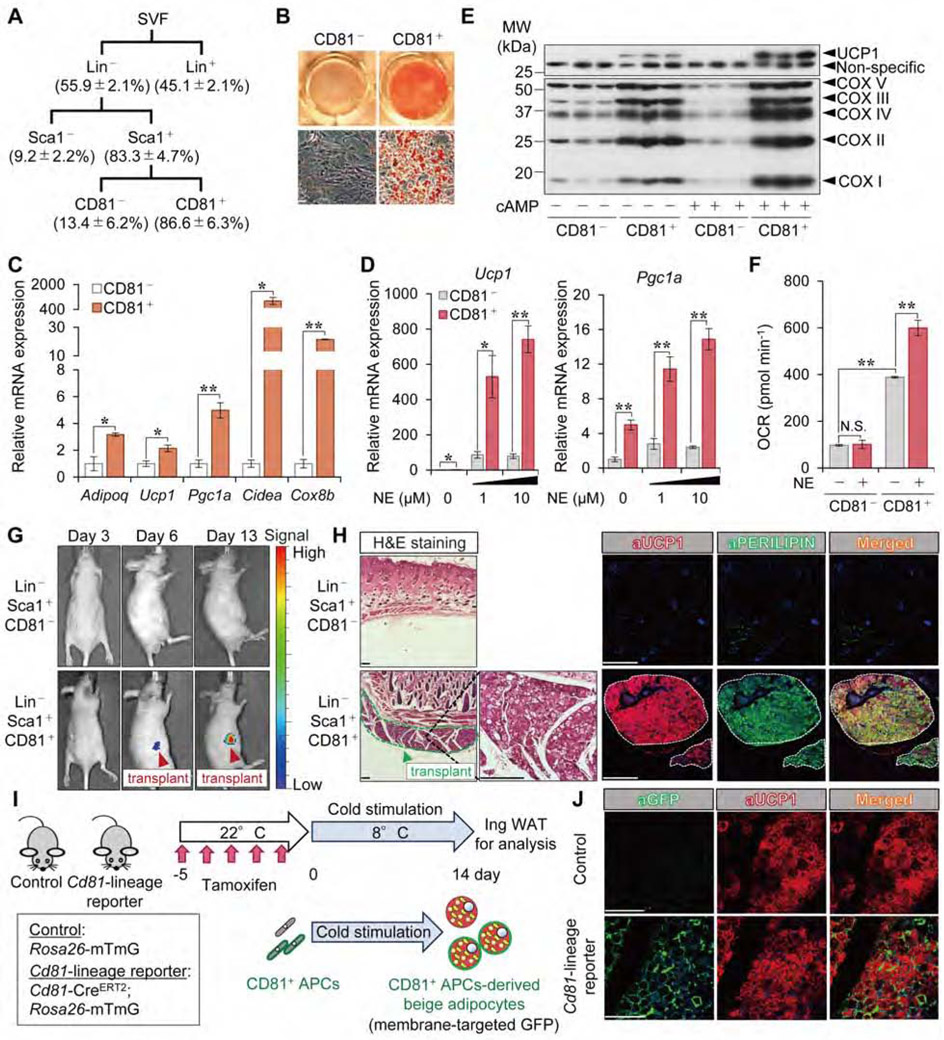
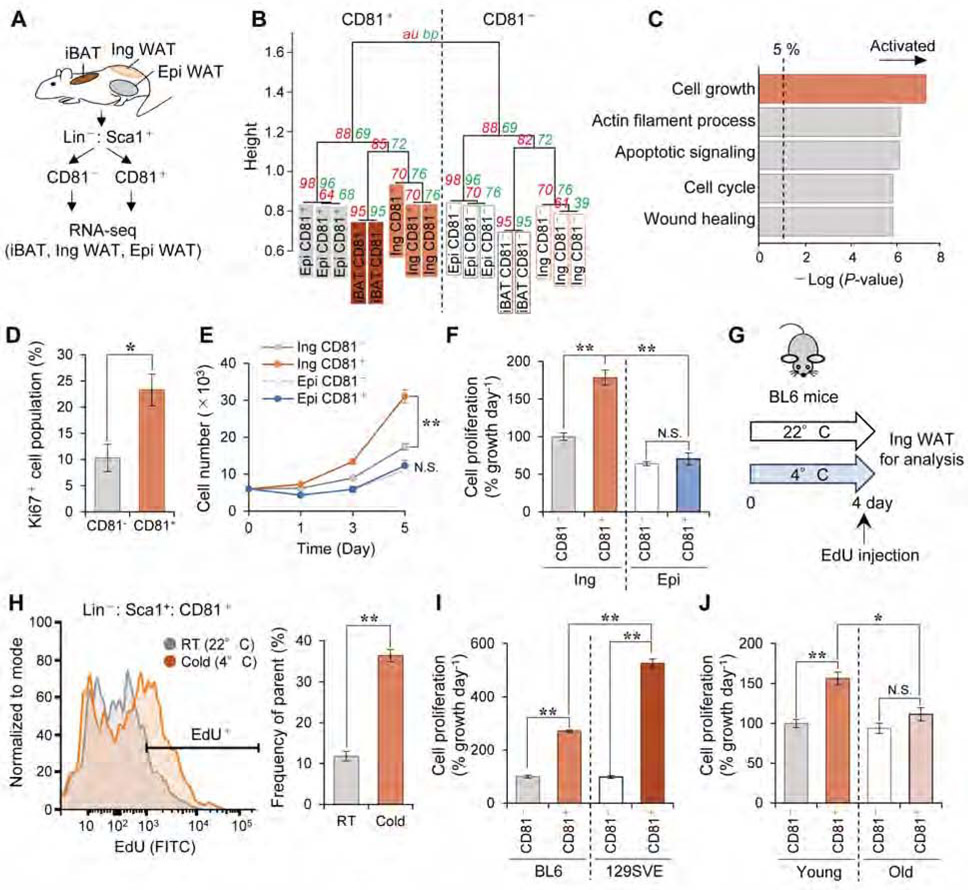
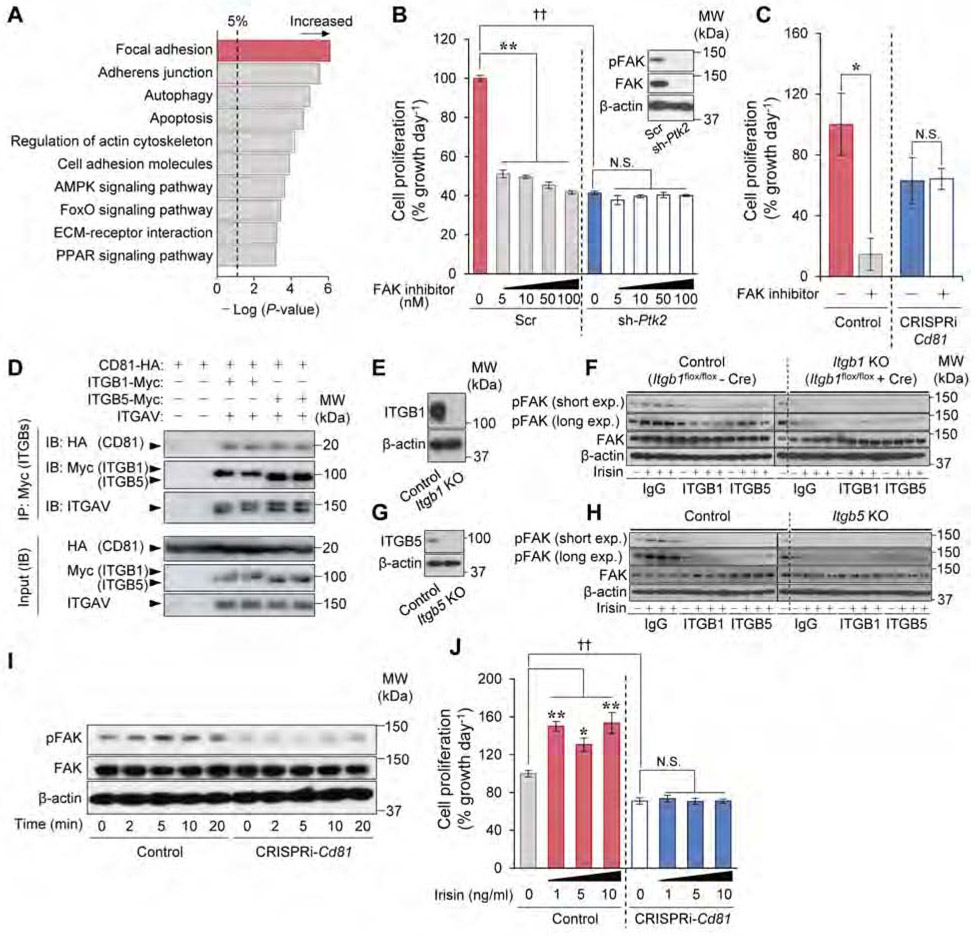
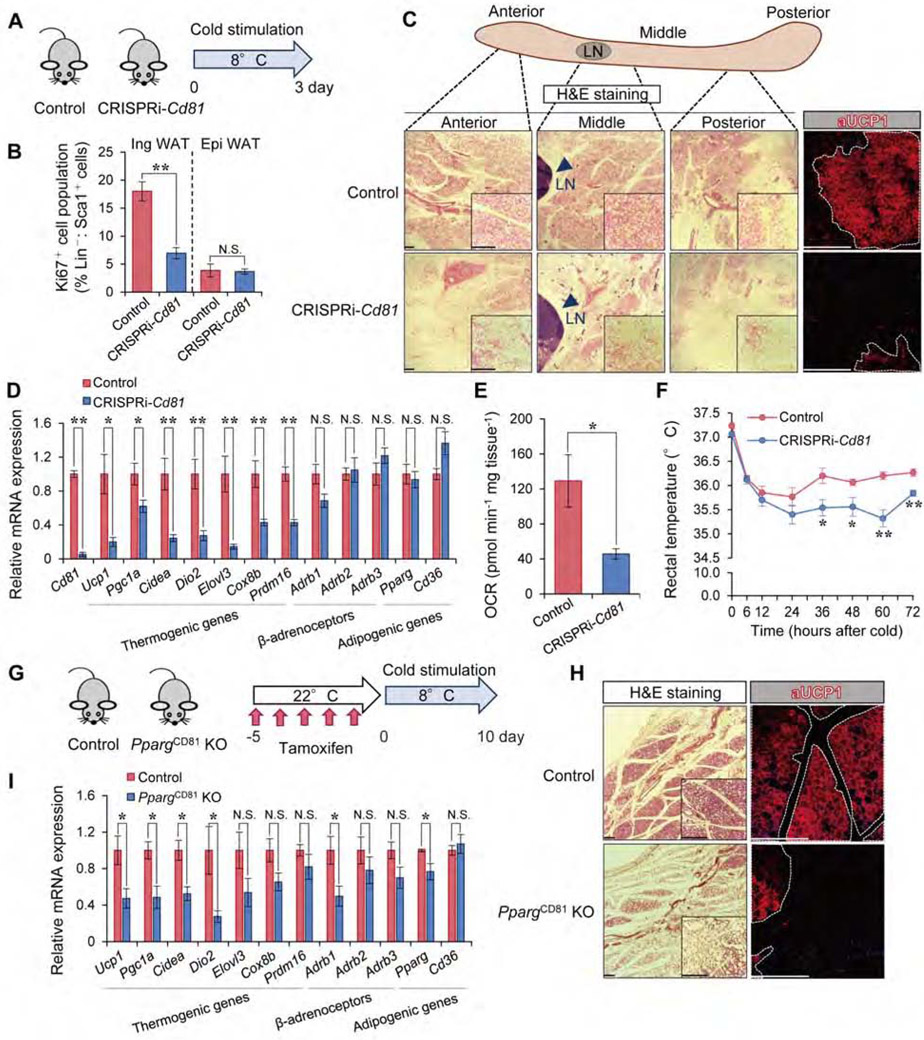
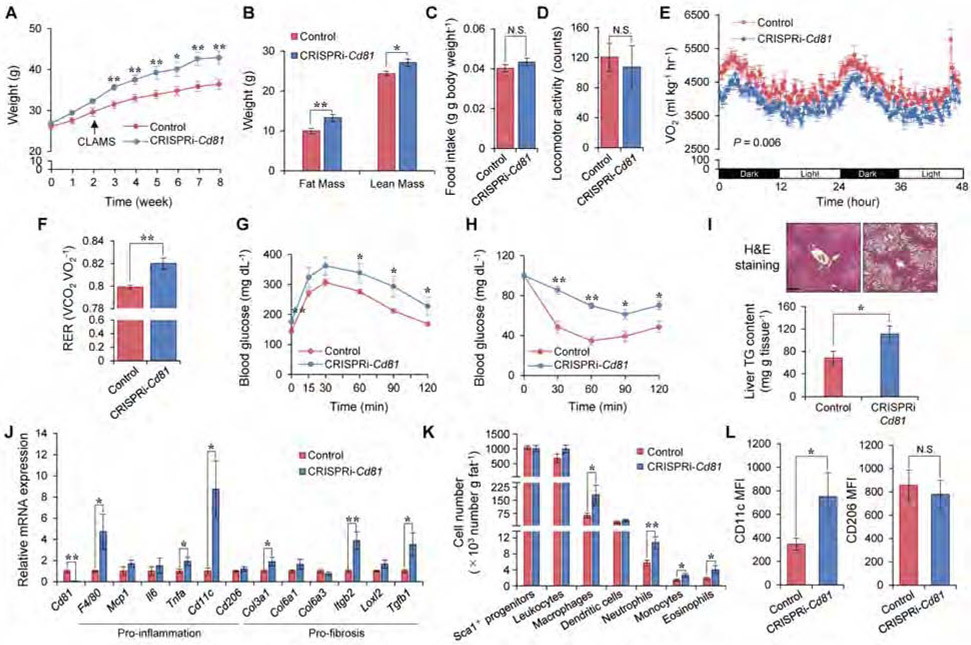
Adipose tissues dynamically remodel their cellular composition in response to external cues by stimulating beige adipocyte biogenesis; however, the developmental origin and pathways regulating this process remain insufficiently understood owing to adipose tissue heterogeneity. Here, we employed single-cell RNA-seq and identified a unique subset of adipocyte progenitor cells (APCs) that possessed the cell-intrinsic plasticity to give rise to beige fat. This beige APC population is proliferative and marked by cell-surface proteins, including PDGFRα, Sca1, and CD81. Notably, CD81 is not only a beige APC marker but also required for de novo beige fat biogenesis following cold exposure. CD81 forms a complex with αV/β1 and αV/β5 integrins and mediates the activation of integrin-FAK signaling in response to irisin. Importantly, CD81 loss causes diet-induced obesity, insulin resistance, and adipose tissue inflammation. These results suggest that CD81 functions as a key sensor of external inputs and controls beige APC proliferation and whole-body energy homeostasis.

Keywords: adipocyte progenitors; adipogenesis; beige fat; brown fat; diabetes; metabolic adaptation; metabolic disease; metabolism; obesity; tissue remodeling.


Conflict of interest statement

Declaration of Interests The authors declare no competing interests.

Figures

Figure 1.
Figure 1.. CD81 marks a subset of APC.
A) Classification of Lin stromal cells in mouse adipose tissues (Type I-V clusters) on a tSNE map. B) Heat map of transcriptome in indicated cell clusters with representative genes. Right diagram:73.1% of the Type III cluster-enriched genes are involved in smooth muscle development and function. C) Violin plots showing mRNA levels of indicated genes in Type I to V cell clusters. D) Expression of cell surface genes, including CD81, that are enriched in Type III cluster. E) Scatter plots showing the distribution of Cd81+ cells in Sca1+, Pdgfra+, or Cd34+ cells. F) Illustration of the experiments in (G) and (H). G) Distribution of CD81+ cells among Lin: Sca1+: tdTomato+ cells from the Ing WAT of Acta2 reporter mice. n=3. H) CD81 expression (mean fluorescence intensity, MFI) in indicated cells from mice in (G). **P < 0.01 by one-way ANOVA followed by Bonferroni’s post hoc test. I) mRNA expression of smooth muscle-enriched genes in indicated cells from Ing WAT. CD81 cells, n=6; CD81+ cells, n=4. **P < 0.01 by unpaired Student’s t-test. Data in (H, I) are represented as mean ± SEM.
Figure 2.
Figure 2.. CD81+ stromal cells give rise to beige adipocytes.
A) The scheme for the FACS analysis to isolate indicated cells from mouse inguinal WAT. The percentage yield of each population is based on the Ing WAT-derived SVFs after overnight culture. n=4. B) Oil-Red-O staining of differentiated CD81 and CD81+ cells. Cells from the Ing WAT of BL6 mice were differentiated for 6 days under an adipogenic condition. Low (top) and high magnification (bottom) are shown. Scale bars = 50 μm. C) mRNA expression of indicated genes in differentiated cells in (B). n=3. D) mRNA expression of Ucp1 and Pgc1a in differentiated cells stimulated with or without NE for 4 hours. (C, D) *P < 0.05, **P < 0.01 by unpaired Student’s t-test. E) Immunoblotting for UCP1 and indicated mitochondrial proteins in differentiated cells stimulated with or without forskolin (cAMP, 10 μM) for 6 hours. F) OCR (pmol min−1) in differentiated cells treated with or without NE (10 μM). n=10. **P < 0.01 by one-way ANOVA followed by Bonferroni’s post hoc test. G) Luciferase activity of transplants at indicated days after transplantation. Arrowhead indicates luciferase+ (UCP1+) transplants. H) H&E staining and immunofluorescent staining for UCP1 and PERILIPIN in the transplants in (G). DAPI for counterstaining of immunofluorescent staining. Scale bars = 200 μm. I) Illustration of the experiments in Cd81-lineage reporter mice. J) Immunofluorescent staining for GFP and UCP1 in the Ing WAT from indicated mice. Scale bars = 100 μm. Data in (A, C, D, F) are represented as mean ± SEM.
Figure 3.
Figure 3.. CD81+ APC in the inguinal WAT is a proliferative stromal population.
A) Schematic illustration of the experiment. CD81+ cells (Lin: Sca1+: CD81+) and CD81 cells (Lin: Sca1+: CD81) were isolated from indicated fat depots of 10-week-old BL6 mice. B) Hierarchical clustering of transcriptomics. The horizontal distance represents similarities among each cluster as visualized by pvclust in R. Approximately Unbiased (au; red) P-value and Bootstrap Probability (bp; green) values as measures of certainty for clusters. C) Upregulated biological pathways in CD81+ cells relative to CD81 cells from Ing WAT. n=3. D) Ki67+ cell population (%) in CD81 and CD81+ cells from Ing WAT of BL6 mice. n=5. *P < 0.05 by unpaired Student’s t-test. E) Cell number at indicated time points after seeding cells on non-coated culture plates. Cells were isolated from Ing WAT or Epi WAT of BL6 mice. n=4. **P < 0.01 by two-way repeated measures ANOVA. F) Cell proliferation rate (% growth day−1) of indicated cells in (E). Data were presented as relative values to the growth rate of CD81 cell in Ing WAT. G) Illustration of the experiments in (H). H) EdU incorporation in CD81+ cells in (G). Right panel shows quantification of EdU+ cells. n=3. **P < 0.01 by unpaired Student’s t-test. I) Cell proliferation rate of indicated cells from Ing WAT of BL6 and 129SVE male mice (12 weeks old). n=4. J) Cell proliferation rate of indicated cells from Ing WAT of young (8-10 weeks) and old (60 weeks) male BL6 mice. Young, n=10; Old, n=5. (F, I, J) *P < 0.05, **P < 0.01 by one-way ANOVA followed by Bonferroni’s post hoc test. Data in (D, E, F, H, I, J) are represented as mean ± SEM.
Figure 4.
Figure 4.. CD81 forms complexes with αV/β1 and αV/β5 integrins and mediates irisin-induced FAK signaling.
A) The upregulated KEGG signaling pathways in CD81+ cells relative to CD81 cells from Ing WAT. n=3. B) The effect of FAK inhibitor (PF-573228) on cell proliferation rate of CD81+ cells expressing shRNA targeting FAK (sh-Ptk2) or a scrambled control (Scr). Cells were treated with PF-573228 or vehicle (DMSO) for 4 days. n=4. Inset: immunoblotting for FAK and β-actin. C) The effect of PF-573228 at 1 μM on cell proliferation rate of Lin: Sca1+ stromal cells from CRISPRi-Cd81 mice and littermate controls. n=3. *P < 0.05 by unpaired Student’s t-test. D) Immunoblotting for indicated proteins in HEK293T cells. Cell lysates were immunoprecipitated with Myc-tag beads (ITGB1 and ITGB5) and detected by antibodies against HA (CD81), Myc (ITGB1, ITGB5), and ITGAV. Inputs were shown in lower panels. The pellet and input were loaded at a ratio of 20:1. E) Immunoblotting for ITGB1 and β-actin in control and Itgb1 KO CD81+ cells from the Ing WAT of Itgb1flox/flox mice. F) Immunoblotting for FAK phosphorylation (pTyr397) (short and long exposure), total FAK, and β-actin in cells in (E) following irisin treatment. Cell lysates from control cells without irisin were included in the leftmost lane of the right panel (Itgb1 KO cells) as a reference. G) Immunoblotting for ITGB5 and β-actin in CD81+ cells from the Ing WAT of Itgb5 KO or control mice. H) Immunoblotting for indicated proteins in cells in (G) following irisin treatment. I) Immunoblotting for indicated proteins in Lin: Sca1+ stromal cells from the Ing WAT of CRISPRi-Cd81 mice and controls. Time point 0 is the cells prior to irisin treatment (control). J) Cell proliferation rate of Lin: Sca1+ cells in (I). Isolated cells were treated with irisin at indicated doses for 5 days. n=4. (B, J) *P < 0.05, **P < 0.01 by one-way ANOVA followed by Dunnett’s post hoc test. ††P < 0.01 by unpaired Student’s t-test with Bonferroni’s correction. Data in (B, C, J) are represented as mean ± SEM.
Figure 5.
Figure 5.. CD81 is required for de novo beige fat biogenesis.
A) Illustration of the experiments in (B-E). B) Ki67+ cells (%) in Lin: Sca1+ stromal cells from the Ing WAT and Epi WAT in (A). n=5. C) H&E staining and UCP1 immunofluorescent staining in the Ing WAT in (A). Arrowhead indicates lymph node (LN). Scale bar = 200 μm. D) mRNA expression of indicated genes in the Ing WAT in (A). n=5. E) OCR in the Ing WAT in (A). Control, n=3; CRISPRi-Cd81, n=4. F) Rectal core body temperature of indicated mice following cold exposure. Control, n=6; CRISPRi-Cd81, n=5. *P < 0.05, **P < 0.01 by two-way repeated measures ANOVA with post hoc test by unpaired Student’s t-test. G) Illustration of the experiments in (H-I). H) H&E staining and UCP1 immunofluorescent staining in the middle region of Ing WAT in (G). Scale bar = 200 μm. I) mRNA expression of indicated genes in the Ing WAT in (G). Control, n=5; PpargCD81 KO mice, n=4. (B, D, E, I) *P < 0.05, **P < 0.01 by unpaired Student’s t-test. Data in (B, D, E, F, I) are represented as mean ± SEM.
Figure 6.
Figure 6.. CD81 loss causes obesity, glucose intolerance, and adipose tissue inflammation.
A) Body-weight of indicated mice on HFD. Control, n=9; CRISPRi-Cd81, n=6. B) Fat mass and lean mass of mice on 8 weeks of HFD. Control, n=9; CRISPRi-Cd81, n=6. C) Food intake of mice on HFD. Control, n=8; CRISPRi-Cd81, n=6. D) Locomotor activity of mice in (C). (C, D) N.S., not significant by unpaired Student’s t-test. E) Whole-body energy expenditure (VO2, ml kg−1 hr−1) of mice on 2 weeks of HFD. Control, n=8; CRISPRi-Cd81, n=6. P value by two-way repeated measures ANOVA. F) RER of mice in (E). G) GTT in mice on 8 weeks of HFD. Control, n=9; CRISPRi-Cd81, n=6. H) ITT in mice in (G). (A, G, H) *P < 0.05, **P < 0.01 by two-way repeated measures ANOVA with post hoc test by unpaired Student’s t-test. I) Top: H&E staining in the liver of mice on 10 weeks of HFD. Sale bar = 200 μm. Bottom: TG contents. Control, n=9; CRISPRi-Cd81, n=6. J) mRNA expression of pro-inflammatory and pro-fibrosis genes in the Ing WAT of mice on 10 weeks of HFD. Control, n=7; CRISPRi-Cd81, n=6. K) The number of total non-leukocyte stromal cells (CD45: Sca1+), leukocytes (CD45+), macrophages (CD45+: CD64+), dendritic cells (CD45+: CD64: CD11c+), neutrophils (CD45+: CD64: Ly6G+), monocytes (CD45+: CD64: Ly6C+), eosinophils (CD45+: CD64: SiglecF+) per gram of the Ing WAT of mice on 10 weeks of HFD. Control, n=8-9; CRISPRi-Cd81, n=5-6. L) The expression of M1-like macrophage marker (CD11c) and M2-like macrophage marker (CD206) among total macrophages in the Ing WAT from mice on 10 weeks of HFD. Control, n=9; CRISPRi-Cd81, n=6. (B, F, I, J, K, L) *P < 0.05, **P < 0.01 by unpaired Student’s t-test. Data are represented as mean ± SEM.

Comment in

References

    1. Alba DL, Farooq JA, Lin MYC, Schafer AL, Shepherd J, and Koliwad SK (2018). Subcutaneous Fat Fibrosis Links Obesity to Insulin Resistance in Chinese Americans. The Journal of clinical endocrinology and metabolism 103, 3194–3204. - PMC - PubMed
    1. Aune UL, Ruiz L, and Kajimura S (2013). Isolation and differentiation of stromal vascular cells to beige/brite cells. Journal of visualized experiments : JoVE. - PMC - PubMed
    1. Berditchevski F, Zutter MM, and Hemler ME (1996). Characterization of novel complexes on the cell surface between integrins and proteins with 4 transmembrane domains (TM4 proteins). Molecular biology of the cell 7, 193–207. - PMC - PubMed
    1. Berry DC, Jiang Y, Arpke RW, Close EL, Uchida A, Reading D, Berglund ED, Kyba M, and Graff JM (2017). Cellular Aging Contributes to Failure of Cold-Induced Beige Adipocyte Formation in Old Mice and Humans. Cell metabolism 25, 481. - PubMed
    1. Berry DC, Jiang Y, and Graff JM (2016). Mouse strains to study cold-inducible beige progenitors and beige adipocyte formation and function. Nature communications 7, 10184. - PMC - PubMed

Publication types

MeSH terms