. 2020 Jul 23;182(2):388-403.e15.
doi: 10.1016/j.cell.2020.05.050. Epub 2020 Jul 1.

Microglial Remodeling of the Extracellular Matrix Promotes Synapse Plasticity

Affiliations

Microglial Remodeling of the Extracellular Matrix Promotes Synapse Plasticity

Phi T Nguyen et al. Cell. .

Abstract

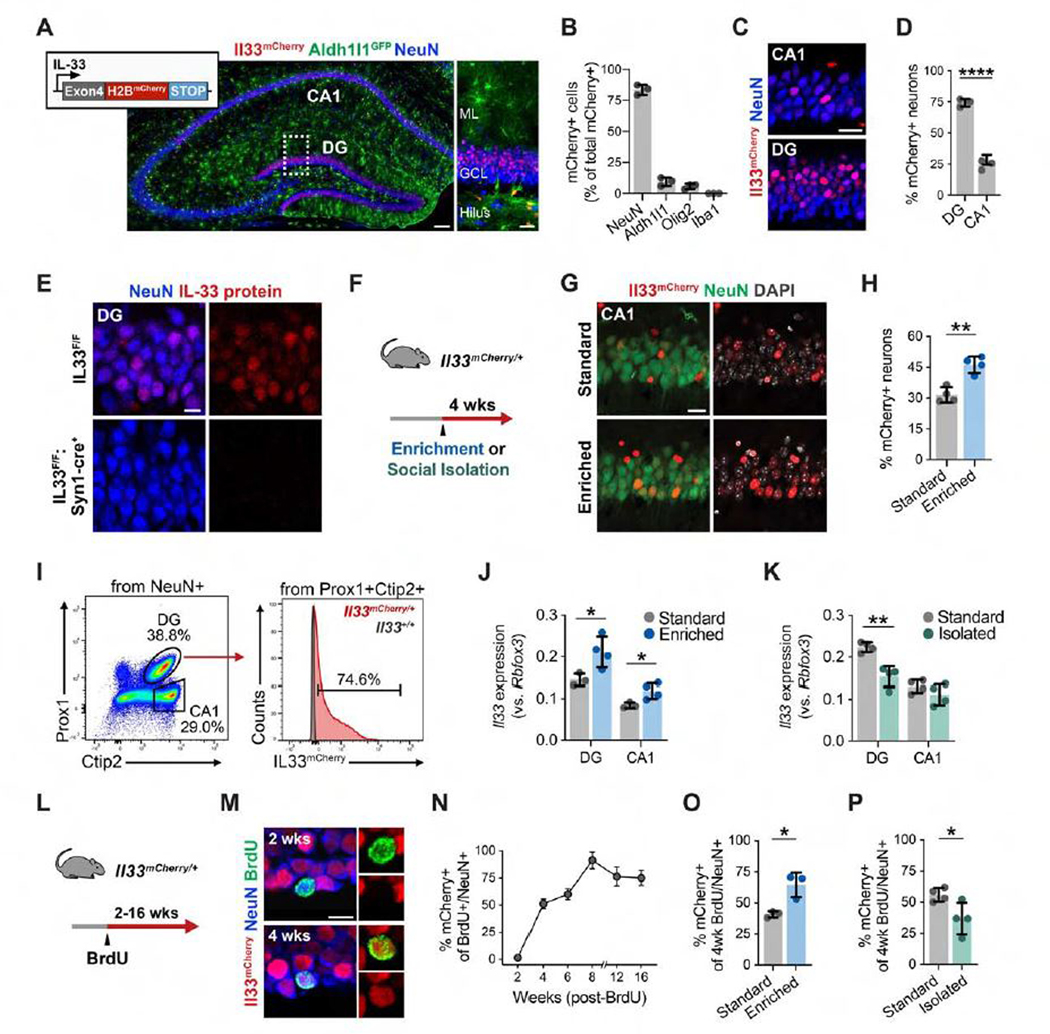
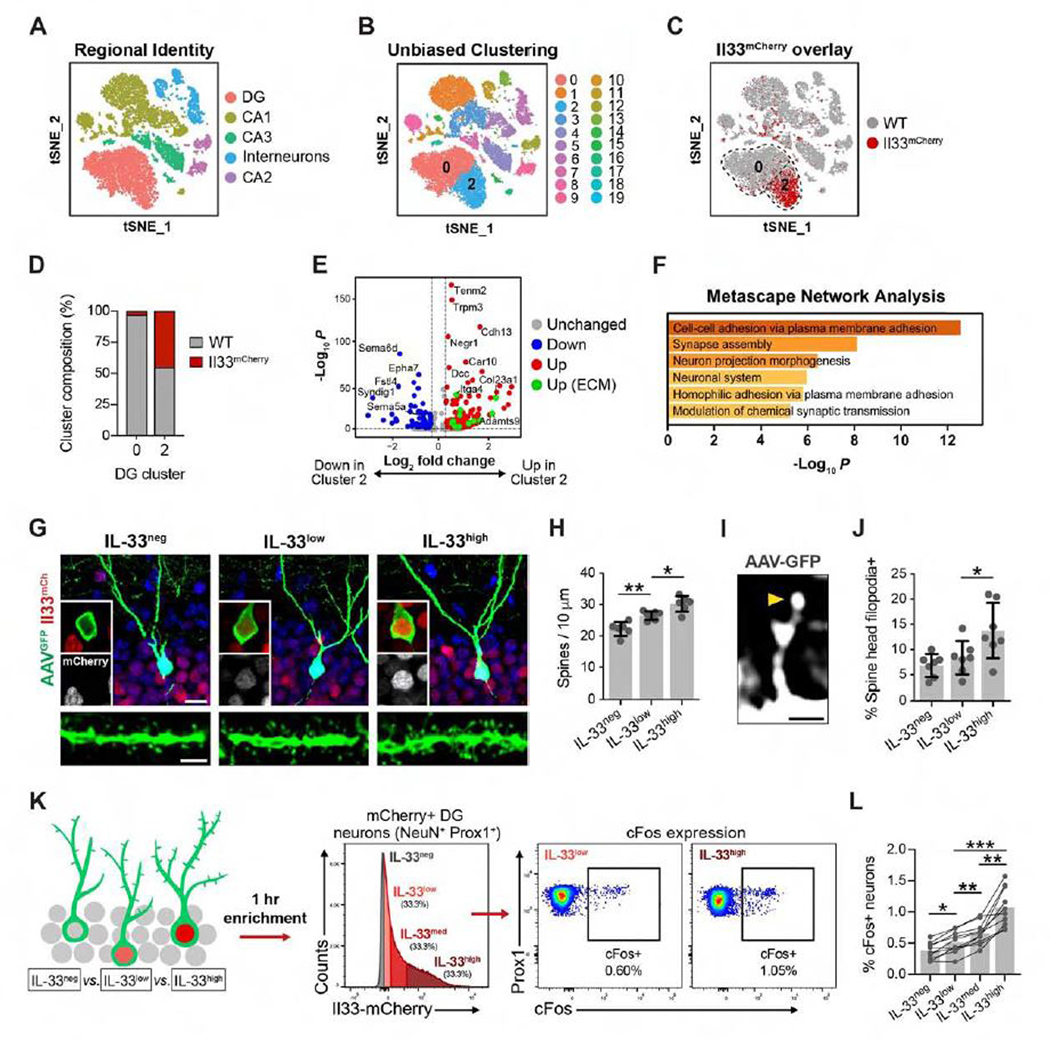
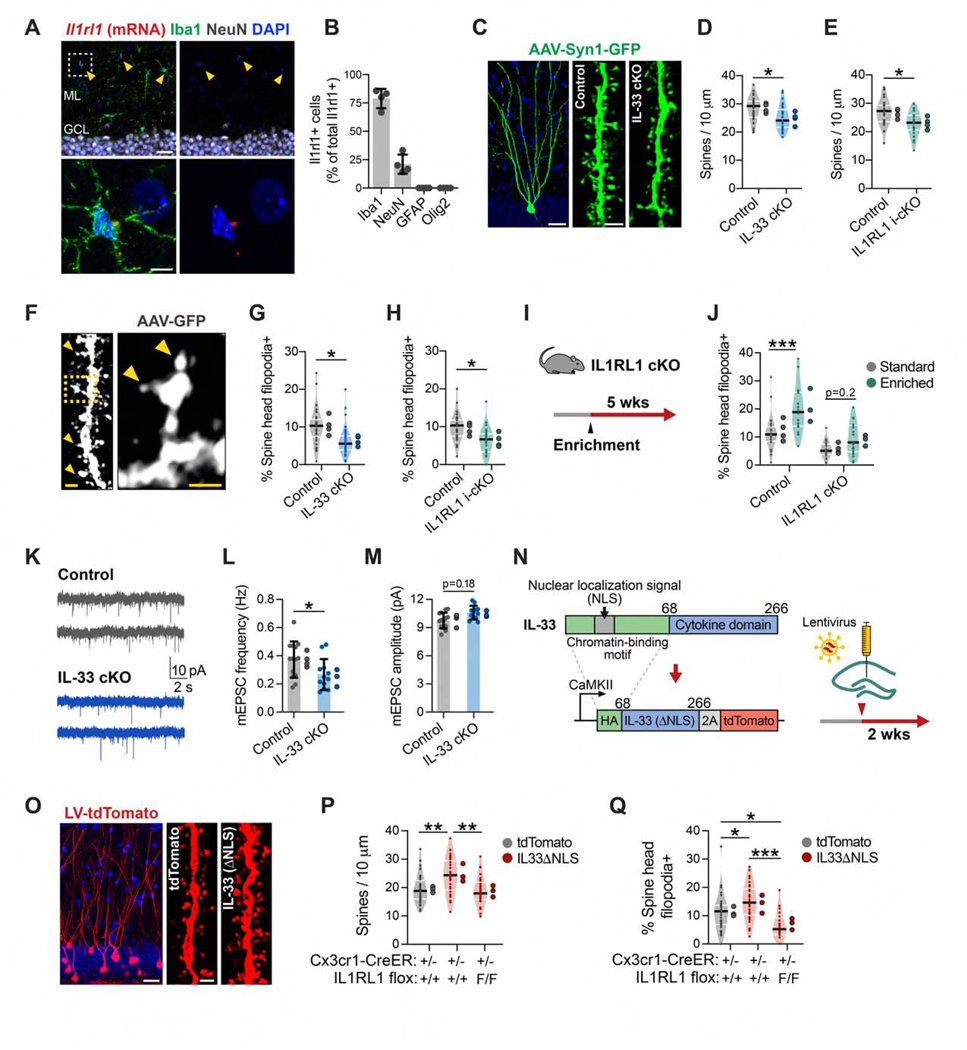
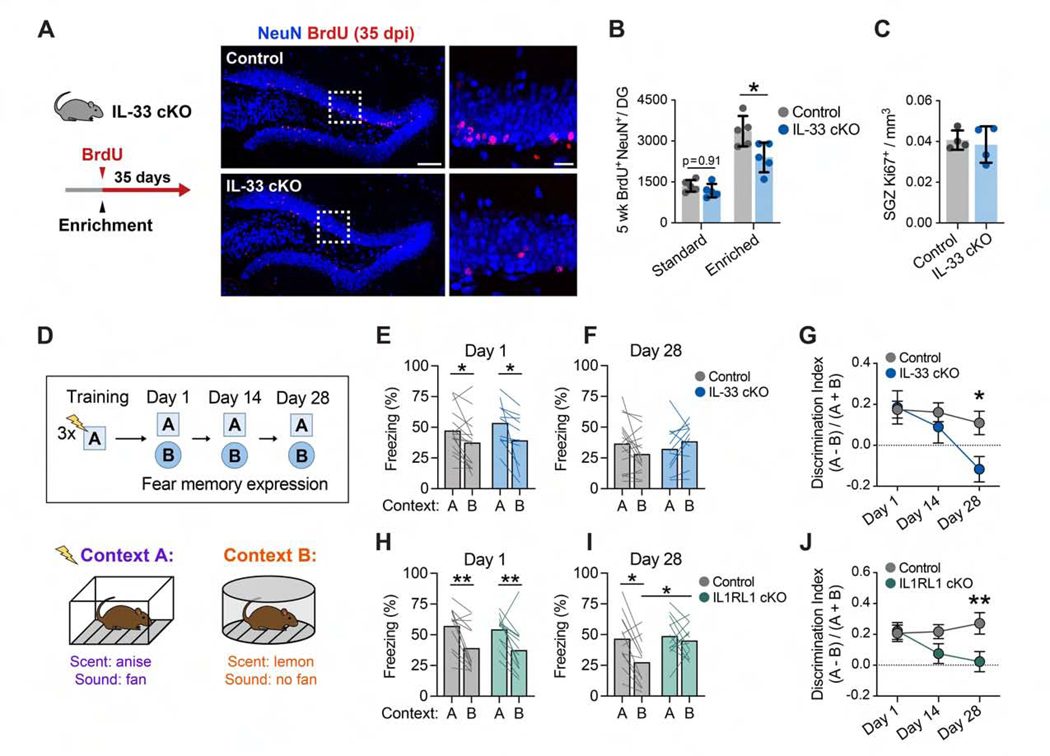
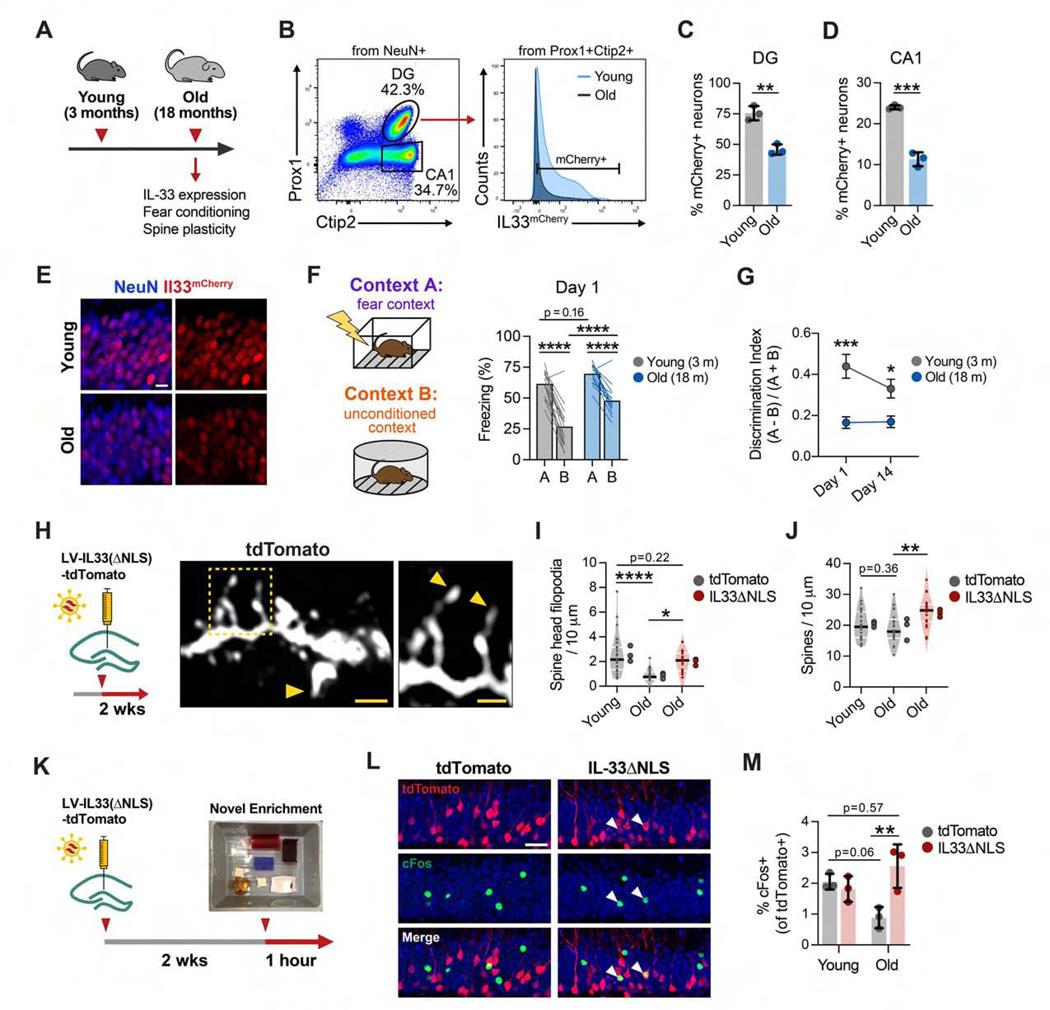
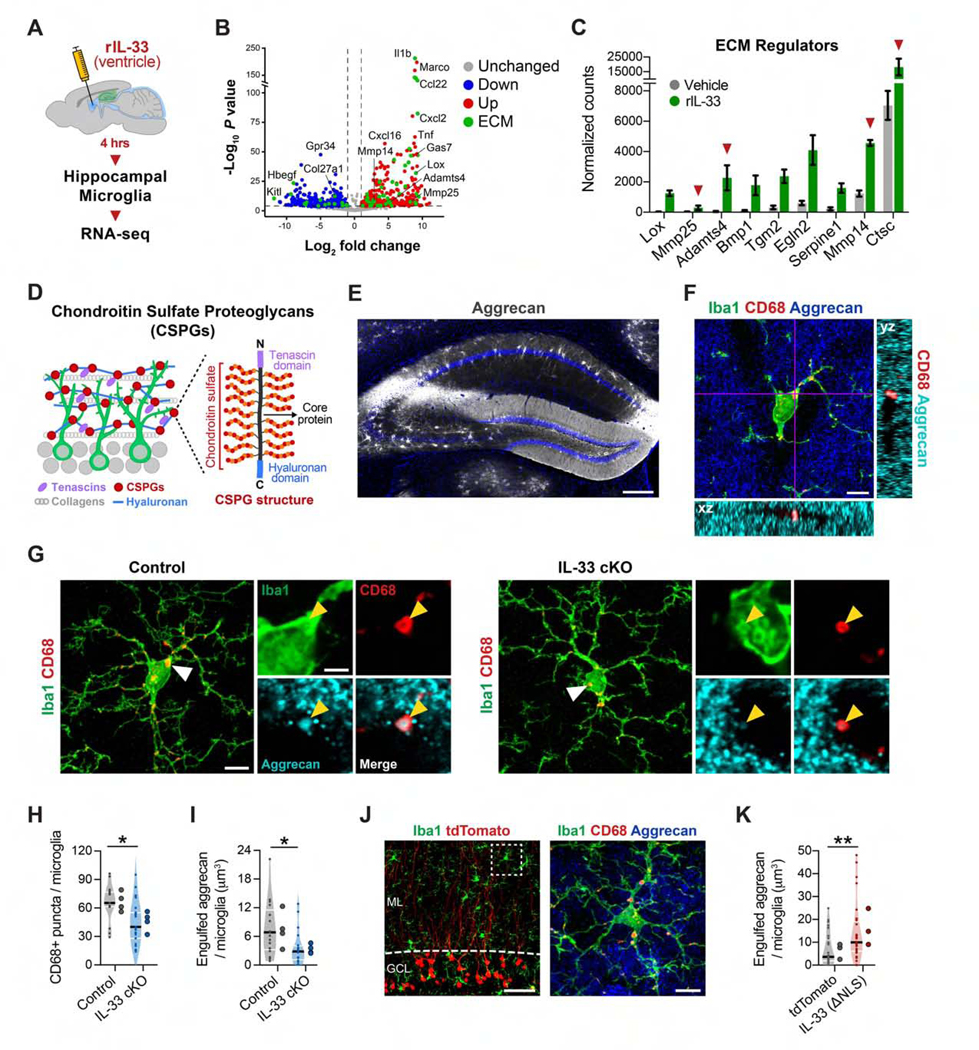
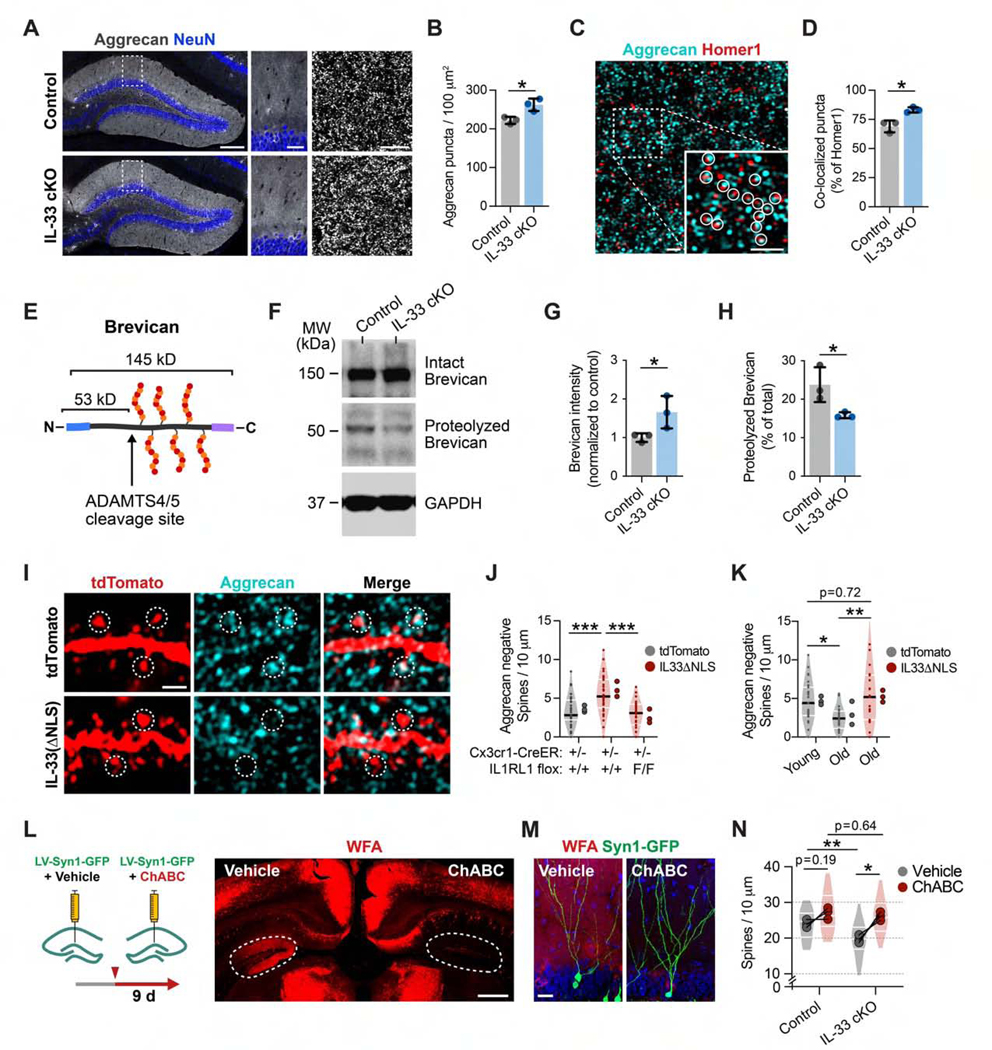
Synapse remodeling is essential to encode experiences into neuronal circuits. Here, we define a molecular interaction between neurons and microglia that drives experience-dependent synapse remodeling in the hippocampus. We find that the cytokine interleukin-33 (IL-33) is expressed by adult hippocampal neurons in an experience-dependent manner and defines a neuronal subset primed for synaptic plasticity. Loss of neuronal IL-33 or the microglial IL-33 receptor leads to impaired spine plasticity, reduced newborn neuron integration, and diminished precision of remote fear memories. Memory precision and neuronal IL-33 are decreased in aged mice, and IL-33 gain of function mitigates age-related decreases in spine plasticity. We find that neuronal IL-33 instructs microglial engulfment of the extracellular matrix (ECM) and that its loss leads to impaired ECM engulfment and a concomitant accumulation of ECM proteins in contact with synapses. These data define a cellular mechanism through which microglia regulate experience-dependent synapse remodeling and promote memory consolidation.

Keywords: microglia, hippocampus, extracellular matrix, aging, memory, dendrite remodeling, interleukin-33.


Conflict of interest statement

Declaration of Interests The authors declare no competing interests.

Figures

Figure 1.
Figure 1.. Experience-Dependent Regulation of IL-33 Expression in Adult Hippocampal Neurons
(A and B) Post-natal day 30 (P30) hippocampus showing Il33mCherry, Aldh1l1eGFP (astrocytes), and NeuN (neurons). Inset, DG. Also shown is quantification of Il33-mCherry+ cells labeled with cell-type-specific markers. Scale bars, 100 μm and 20 μm (inset). ML, molecular layer; GCL, granule cell layer. (C and D) Il33-mCherry+ neurons in the DG and CA1. Scale bar, 20 μm. (E) IL-33 protein in DG neurons in the control (Il33fl/f) or after neuron-specific excision of Il33 (Il33fl/fl: Synapsin1-cre). Scale bar, 10 μm. (F) Schematic of environmental enrichment (EE) and social isolation (SI). (G and H) Image and quantification of the CA1 from Il33mCherry/+ mice under standard or EE conditions. Scale bar, 20 μm. (I) Fluorescence-activated cell sorting (FACS) gating of Il33-mCherry+ neurons from the DG and CA1. (J and K) Effect of an EE or SI on Il33 expression by qPCR. (L) Schematic of newborn neuron labeling. (M and N) Image and percentage of Il33-mCherry+ newborn neurons at the indicated time points after BrdU injection (n = 3 mice/time point; >20 neurons/mouse). Injected at 4 weeks of age. Scale bar, 10 μm. (O) Effect of an EE on the percentage of Il33-mCherry+ newborn neurons; BrdU injection and EE at 12 weeks, analysis at 16 weeks. (P) Effect of SI on the percentage of Il33-mCherry+ newborn neurons; BrdU injection and SI at 4 weeks, analysis at 8 weeks. Statistics: two-tailed unpaired t tests. Dots represent individual mice. Data are mean ± SD. *p < 0.05, **p < 0.01, ***p < 0.001. See also Figure S1.
Figure 2.
Figure 2.. IL-33 Expression Identifies a Neuronal Subset Primed for Synaptic Plasticity
(A) t stochastic nearest neighbor embedding (tSNE) of 10,800 NeuN+ nuclei labeled by cell type. (B) Unsupervised clustering of (A). (C) Wild-type (WT) nuclei (gray) overlaid with Il33mCherry nuclei (red). (D) WT and Il33mCherry composition in DG clusters 0 and 2. (E) Volcano plot of differentially expressed genes between DG clusters 0 and 2 (p < 0.001). Green, ECM and ECM-associated genes (Naba et al., 2016). (F) Top Gene Ontology terms for upregulated genes in (E). (G) DG granule cells sparsely labeled with AAV9-Syn1-GFPfrom Il33mCherry/+ mice showing IL-33-negative, -low, and -high subsets. Scale bars, 10 μm (top) and 2 μm (bottom). (H) Dendritic spine density in neuronal subsets (ANOVA, p < 0.0001, Tukey’s post hoc test, n = 6–7 neurons/group, 3 mice). (I and J) Percentage of spines with spine head filopodia (ANOVA, p = 0.0096, Tukey’s post hoc test, n = 6–7 neurons/group, 3 mice). Arrowhead, spine head filopodia. Scale bar, 1 μm. (K) Schematic of neuronal nucleus isolation by mCherry intensity. (L) Percentage of cFos+ cells in each subset (repeated-measures ANOVA, p < 0.0001, Tukey’s post hoc test, n = 10 mice). *p < 0.05, **p < 0.01, ***p < 0.001. Data in (G)–(L) are mean ± SD. See also Figure S2 and Table S1.
Figure 3.
Figure 3.. Neuron-Microglia Signaling via IL-33 Drives Experience-Dependent Spine Remodeling
(A and B) ll1rl1 transcript co-labeled with antibodies to cell-type-specific markers in the DG (n = 4 mice). Scale bars, 25 μm and 5 μm (inset). (C and D) Dendritic spine density in DG granule cells sparsely labeled with AAV9-Syn1-GFP in IL-33 cKO versus littermate controls (nested t test, n = 36 dendritic segments, 4 mice/genotype). Scale bars, 20 μm and 2 μm (spine inset). (E) Spine density in IL1RL1 i-cKO versus littermate controls (nested t test, n = 27 dendritic segments, 4 mice/genotype). (F-H) Percentage of spines with spine head filopodia in IL-33 cKO and IL1RL1 i-cKO versus littermate controls (arrowheads, spine head filopodia; statistics as in D and E). Scale bars, 1 μm and 0.5 μm (inset). (I and J) Percentage of spines with spine head filopodia under standard or enriched conditions in IL1RL1 cKO mice versus littermate controls (2-way ANOVA, Tukey’s post hoc test, n = 18–24 dendritic segments, 3–4 mice/group). (K-M) Frequency and amplitude of mEPSCs from IL-33 cKO mice and littermate controls (nested t test, n = 12–14 neurons, 3–4 mice/genotype). (N) Schematic of IL-33ΔNLS viral gain-of-function strategy. (O and P) Spine density after injection of control (tdTomato) or IL-33ΔNLSvirus into control orIL1RL1 i-cKO mice(one-way ANOVA, Tukey’s post hoc test, n = 29–33 dendritic segments, 3 mice/group). Scale bars, 20 μm and 1 μm (inset). (Q) Percentage of spine head filopodia (sample sizes and statistics as in P). *p < 0.05, **p < 0.01, ***p < 0.001. Data are mean ± SD (bar graphs) and median ± interquartile range (violin plots). Larger dots to the right of each plot indicate mean per individual mouse. See also Figure S3 and Table S2.
Figure 4.
Figure 4.. Neuron-Microglia Signaling through IL-33 Promotes Experience-Dependent Increases in Newborn Neurons and Is Required for Remote Memory Precision
(A and B) Newborn neuron quantification in IL-33 cKO mice versus controls in standard or enriched housing (n = 5 mice/group, 2-way ANOVA, Tukey’s post hoc test). Scale bars, 100 μm and 20 μm (inset). (C) Ki67+ proliferating cells in the subgranular zone (SGZ). (D) Schematic of the contextual fear discrimination assay. (E-G) Freezing in the conditioned fear context A versus unconditioned context B in control and IL-33 cKO animals. (G) shows the same data quantified as a memory discrimination index and includes a 14-daytime point (n = 16 control and 11 IL-33 cKO mice, 2-way repeated measures [RM] ANOVA, Sidak’s post hoc tests; Figure S4C). (H-J) Freezing in context A versus context B in control and IL1RL1 cKO animals (n = 12 mice/genotype, 2-way RM ANOVA, Sidak’s post hoc tests; Figure S4D). *p < 0.05, **p < 0.01. Data are mean ± SD (B and C) and mean ± SEM (G and J). See also Figure S4.
Figure 5.
Figure 5.. IL-33 Expression Decreases in the Aged Hippocampus and Is Associated with Decreased Memory Precision and Spine Plasticity
(A) Overview schematic. (B–D) Quantification of the percentage of mCherry+ neurons, using flow cytometry, in the DG and CA1 of young and old mice (t test, n = 3 mice/group). (E) Representative image of Il33-mCherry in the DG of young and old Il33mCherry/+ mice. Scale bar, 10 μm. (F) Contextual fear discrimination 1 day post-training in young and old mice(n = 16young and 14 old mice, 2-way RM ANOVA, Sidak’s post hoc tests; FigureS5C). (G) Discrimination indices 1 and 14 days post-training (statistics as in F; Figure S5C). (H–J) Number of spine head filopodia (I) and total spines (J) after injections with control or IL-33 gain-of-function virus(one-way ANOVA, Tukey’s post hoc test, n = 20–27 dendritic segments, 3 animals/group). Scale bars, 2 μm and 1 μm (inset). (K) Schematic of the neuronal activation assay after IL-33 gain of function. (L and M) Percentage of virally labeled DG neurons that were cFos+ after 1 h i n a novel environment (one-way ANOVA, Tukey’s post hoc test, 3 mice/group). Scale bar, 20 μm. *p < 0.05, **p < 0.01, ****p < 0.0001. Data are mean ± SD (bar graphs) and median ± interquartile range (violin plots). Larger dots to the right of violin plots indicate mean per individual mouse. See also Figure S5.
Figure 6.
Figure 6.. Neuronal IL-33 Drives Microglial Engulfment of the ECM
(A) Experimental overview of microglial transcriptomics. (B) Volcano plot of differentially expressed genes after IL-33 or PBS treatment (PAdj < 0.01). Green, ECM and ECM-associated genes (Naba et al., 2016). (C) Genes in (B) classified as ECM regulators. Red arrows, ECM proteases. (D) Schematic of the ECM in the DG. (E)Aggrecan staining in the hippocampus. Scale bar, 250 μm. (F) z stack of Iba1+ microglia in the DG co-labeled with Aggrecan and CD68+ lysosomes. Scale bar, 5 μm. (G-I) CD68+ lysosomes within microglia (H) and Aggrecan protein within microglial lysosomes (I) (nested t test, n = 17–20 microglia, 4 mice/genotype). Scale bat, 5 μm and 2 μm (inset). (J and K) Aggrecan in microglial lysosomes 2 weeks after infection with a control or IL-33ΔNLS virus (t test, 28 microglia, 3 mice/group). Scale bars, 25 μm and 2 μm (inset). *p < 0.05, **p < 0.01. Data are mean ± SEM (bar graphs) and median ± interquartile range (violin plots). Larger dots to the right of violin plots indicate mean per individual mouse. See also Figure S6 and Table S3.
Figure 7.
Figure 7.. IL-33 Deficiency Leads to Accumulation of Perisynaptic ECM
(A and B) Quantification of Aggrecan punctum density in control and IL-33 cKO mice. Insets, DG ML (t test, n = 3 mice/genotype). Scale bars, 200 μm (left), 40 μm (center), 5 μm (right). (C and D) Aggrecan and Homerl immunostaining and co-localization in the ML (circles, co-localized puncta; t test, n = 3 mice/genotype). Scale bars, 1 μm and 1 μm (inset). (E) Brevican CSPG and proteolytic cleavage site. (F-H) Western blot of Brevican from hippocampal lysate in IL-33 cKO and littermate controls, including uncleaved (145 kD, G) and cleaved (53 kD, H) forms (t test, n = 3 mice/genotype). (I and J) Aggrecan co-localization with dendritic spines in the DG injected with control (tdTomato) orIL-33 gain-of-function (IL-33ΔNLS) virus in control or IL1RL1 i-cKO mice (one-way ANOVA, Tukey’s post hoc test, n = 29–33 dendritic segments, 3 mice/group). Scale bar, 1 μm. (K) Aggrecan co-localization with spines in young and old mice injected with a control or IL-33ΔNLS virus (one-way ANOVA, Tukey’s post hoc test, n = 19–27 dendritic segments, 3 mice/group). (L and M) Schematic and representative images of ChABC digestion imaged with Wisteria floribunda agglutinin (WFA) staining (dashed circles, DG). Scale bars, 500 μm (L) and 20 μm (M). (N) Dendritic spine density in IL-33 cKO or control mice injected with ChABC or vehicle (2-way RM ANOVA, Sidak’s post hoc test, n = 3 mice/genotype; dots, means per mouse; lines connect vehicle- and ChABC-injected hemispheres; violin plots show distribution of dendritic segments per group, 23–30 segments). *p < 0.05, **p < 0.01, ***p < 0.001. Data are mean ± SD (bar graphs) and median ± interquartile range (violin plots). Larger dots to the right of violin plots indicate means per mouse.

Comment in

Similar articles

Cited by

References

    1. Alvarez DD, Giacomini D, Yang SM, Trinchero MF, Temprana SG, Büttner KA, Beltramone N, and Schinder AF (2016). A disynaptic feed-back network activated by experience promotes the integration of new granule cells. Science 354, 459–465. - PubMed
    1. Anders S, Pyl PT, and Huber W (2015). HTSeq-a Python framework to work with high-throughput sequencing data. Bioinformatics 31, 166–169. - PMC - PubMed
    1. Barbolina MV, and Stack MS (2008). Membrane type 1-matrix metalloproteinase: substrate diversity in pericellular proteolysis. Semin. Cell Dev. Biol. 19, 24–33. - PMC - PubMed
    1. Barrett T, Wilhite SE, Ledoux P, Evangelista C, Kim IF, Tomashevsky M, Marshall KA, Phillippy KH, Sherman PM, Holko M, et al. (2013). NCBI GEO: archive for functional genomics data sets-update. Nucleic Acids Res. 41,D991–D995. - PMC - PubMed
    1. Basu R, Duan X, Taylor MR, Martin EA, Muralidhar S, Wang Y, Gangi-Wellman L, Das SC, Yamagata M, West PJ, et al. (2017). Heterophilic Type II Cadherins Are Required for High-Magnitude Synaptic Potentiation in the Hippocampus. Neuron 96, 160–176.e8. - PMC - PubMed

Publication types

Substances