. 2020 Nov 1;11(6):1608-1631.
doi: 10.1080/19490976.2020.1758010.

Longitudinal gut microbiome changes in alcohol use disorder are influenced by abstinence and drinking quantity

Affiliations

Longitudinal gut microbiome changes in alcohol use disorder are influenced by abstinence and drinking quantity

Nancy J Ames et al. Gut Microbes. .

Abstract

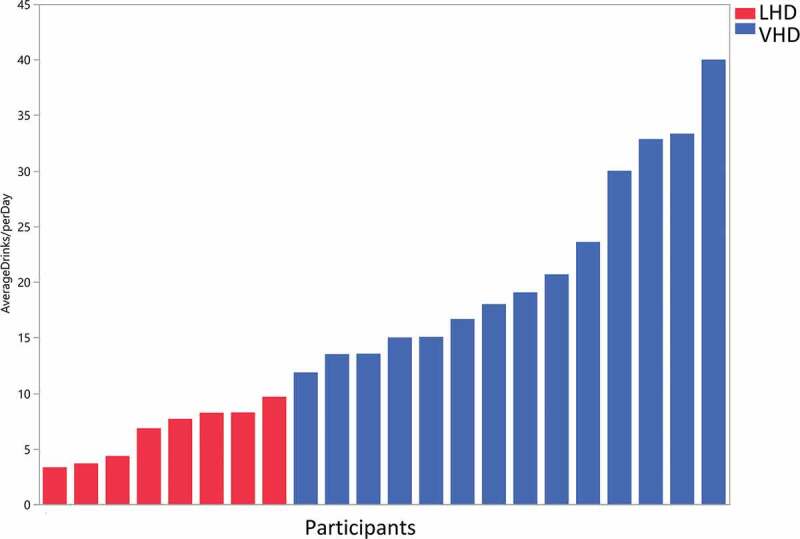
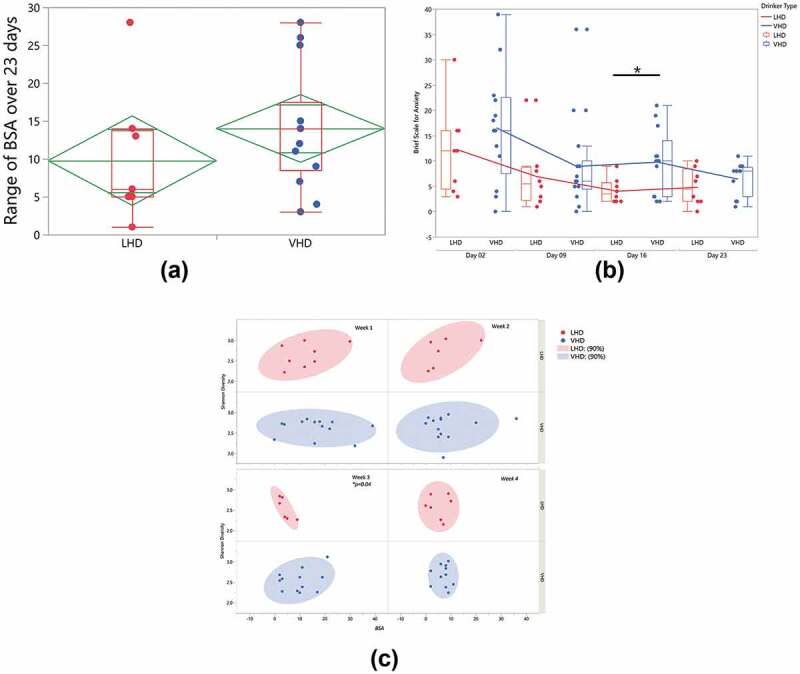
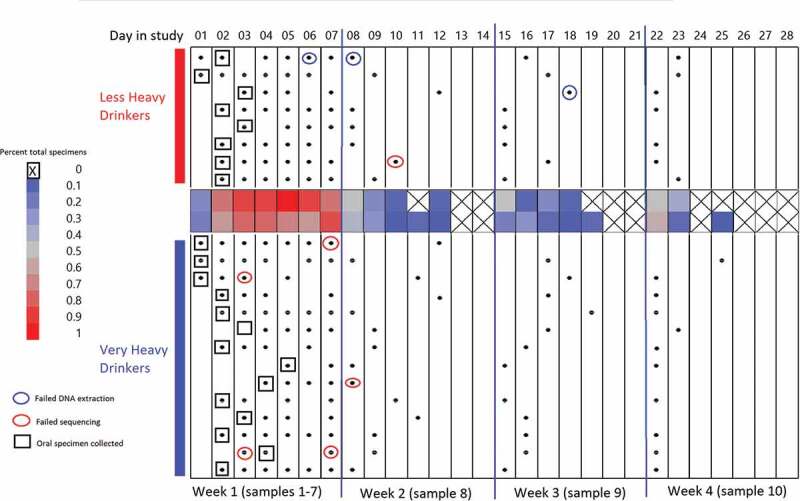
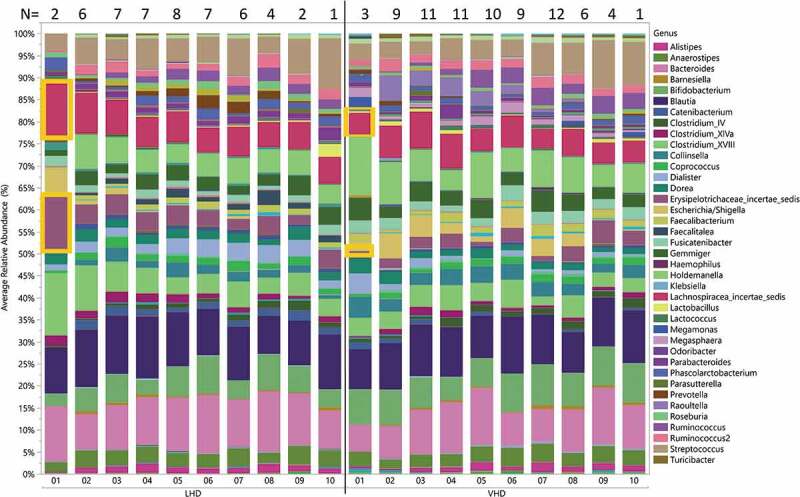
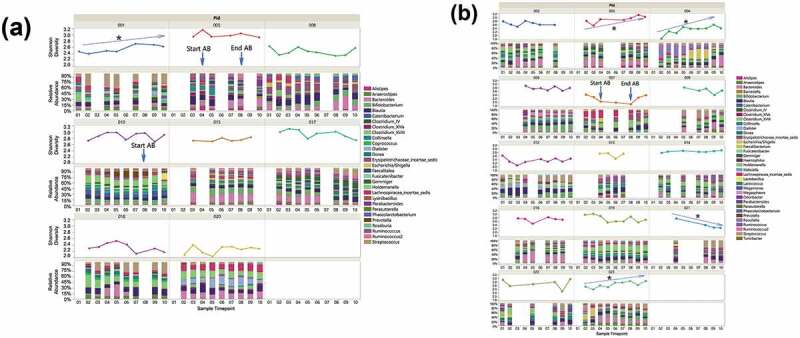
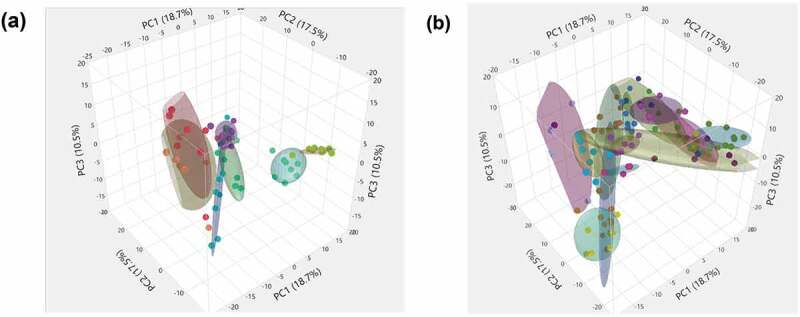
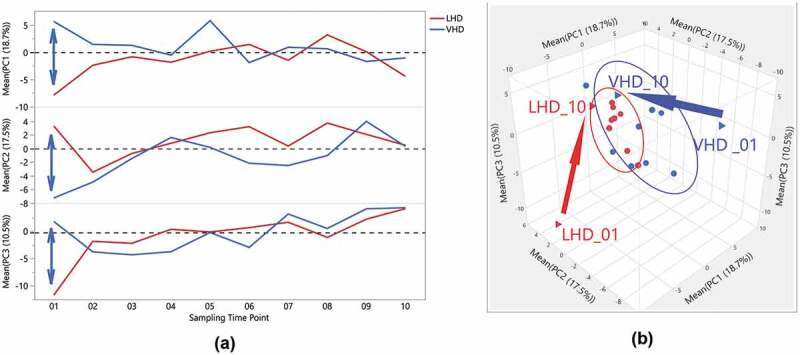
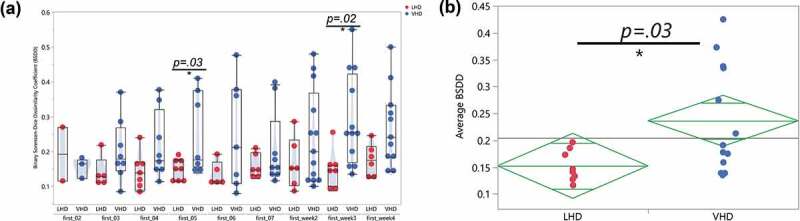
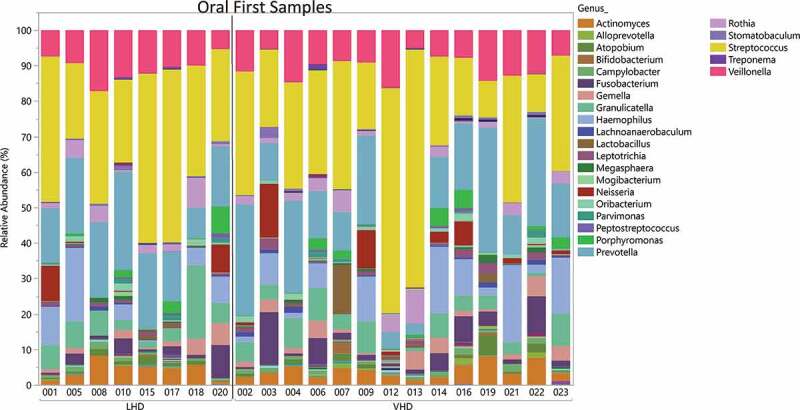
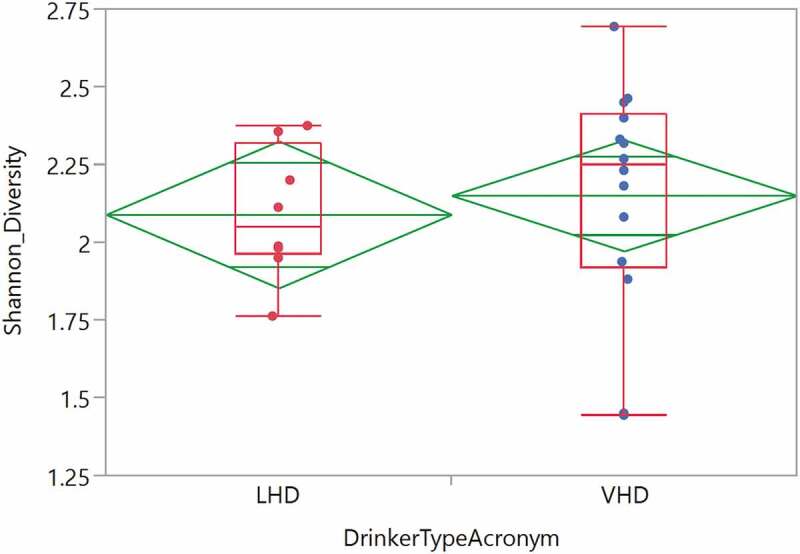
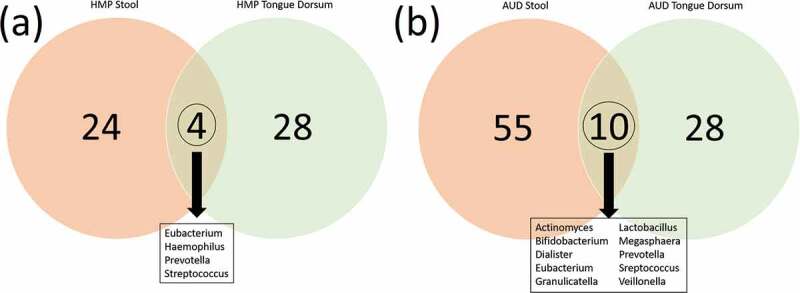
Many patients with alcohol use disorder (AUD) consume alcohol chronically and in large amounts that alter intestinal microbiota, damage the gastrointestinal tract, and thereby injure other organs via malabsorption and intestinal inflammation. We hypothesized that alcohol consumption and subsequent abstinence would change the gut microbiome in adults admitted to a treatment program. Stool and oral specimens, diet data, gastrointestinal assessment scores, anxiety, depression measures and drinking amounts were collected longitudinally for up to 4 weeks in 22 newly abstinent inpatients with AUD who were dichotomized as less heavy drinkers (LHD, <10 drinks/d) and very heavy drinkers (VHD, 10 or more drinks/d). Next-generation 16 S rRNA gene sequencing was performed to measure the gut and oral microbiome at up to ten time points/subject and LHD and VHD were compared for change in principal components, Shannon diversity index and specific genera. The first three principal components explained 46.7% of the variance in gut microbiome diversity across time and all study subjects, indicating the change in gut microbiome following abstinence. The first time point was an outlier in three-dimensional principal component space versus all other time points. The gut microbiota in LHD and VHD were significantly dissimilar in change from day 1 to day 5 (p = .03) and from day 1 to week 3 (p = .02). The VHD drinking group displayed greater change from baseline. The Shannon diversity index of the gut microbiome changed significantly during abstinence in five participants. In both groups, the Shannon diversity was lower in the oral microbiome than gut. Ten total genera were shared between oral and stool in the AUD participants. These data were compared with healthy controls from the Human Microbiome Project to investigate the concept of a core microbiome. Rapid changes in gut microbiome following abstinence from alcohol suggest resilience of the gut microbiome in AUD and reflects the benefits of refraining from the highest levels of alcohol and potential benefits of abstinence.

Keywords: Gut microbiome; alcohol use disorder; molecular methods; oral microbiome; substance use.


Figures

Figure 1.
Figure 1.
Drinks per day in less heavy drinkers (LHD) and very heavy drinkers (VHD). Blue bars (VHD cohort, N = 14) and red bars (LHD cohort, N = 8) depict drinks/d over the 90-d alcohol Timeline Followback (TLFB). Patients were classified as LHD if they consumed <10 drinks/d and VHD group if they consumed 10 or more drinks/d. One patient did not complete the Alcohol TLFB and was placed in the VHD group based on information obtained from the history and physical.
Figure 2.
Figure 2.
Longitudinal change in state anxiety and gut microbiome Shannon Diversity Index (SDI). State anxiety was measured over 23 d with the Brief Scale for Anxiety (BSA). (a) Mean anxiety and maximum/minimums of within-subject range of state anxiety in LHD (red) and VHD (blue). (b) Longitudinal change in anxiety in LHD (red) and VHD (blue) patients, over 4 weeks, showing decline in state anxiety after week 1, and subsequent stability. BSA anxiety differed significantly between VHD and LHD only at day 16 (*p = .02) without multiple comparison correction. (c) Weeks 1-4 correlation bivariate plot between BSA (x-axis) and SDI (y-axis). A significant negative correlation (* p = .04) at week 3 in LHD is shown (without multiple comparison correction).
Figure 3.
Figure 3.
Gut and oral specimen sampling chart over 28 d of inpatient treatment. X-axis along the top of the chart indicates the day in the study (Day 1–Day 28) segmented by 4 -week intervals. Black dots: gut specimens. Open boxes: oral specimens. Blue circles: specimens failing DNA extraction. Red circles: specimens failing sequencing. Center heat map: average total specimens for that day.
Figure 4.
Figure 4.
Longitudinal change in average relative abundances of between VHD and LHD over 3 weeks following abstinence. Depicted are 39 genera with relative abundance. The legend shows only those genera that were at least 5% abundant in any sample at any given time point. The number of specimens used to calculate relative abundances is shown at the top, and the sampling time point is at the bottom. Two genera (orange boxes) were initially significantly different between LHD and VHD: Erysipelotrichaceae and Lachnospiraceae.
Figure 5.
Figure 5.
Individual specific longitudinal change in gut microbiome relative abundance and SDI for LHD (N = 8) (Figure 5(a)) and VHD (N = 14) (Figure 5(b)). Clinical administration of antibiotics (AB) is indicated with labels and blue arrows. Black star indicates significant linear trend in SDI.
Figure 6.
Figure 6.
Three-Dimensional Scatterplot for the first three Principal Components of gut microbiome of AUD patients longitudinally followed after abstinence. LHD samples are shown (Figure 6(a)) and VHD are shown (Figure 6(b)). Each ellipse bounds samples from an individual patient, smaller ellipses (as in several LHD patients Figure 5(a)) representing less temporal variation for that patient.
Figure 7.
Figure 7.
Distinctiveness and overlap of LHD and VHD groups, across time, following abstinence, for the first three Principal Components of the gut microbiome. (a) One-way overlay plot of the average over participants for the first three Principal Components (y-axis) versus the ten sampling time points (x-axis). The average PC over all patients in each group for each time point was calculated to determine centroids. The double-headed arrow indicates differences between centroids of first time points between each drinking group. (b) Three-Dimensional Scatter Plot of the averages of the first three Principal Components for LHD (red) and VHD (blue) groups. The first and last time point, i.e. VHD_01, LHD_01, VHD_010, LHD_010, are shown as triangles. A vector is drawn from the first time point to the last time point within each group showing the direction. As shown in this view, the first time points for each group appear to be outliers when compared to the rest illustrating extensive change in gut microbiome following abstinence.
Figure 8.
Figure 8.
Binary Sorenson-Dice Dissimilarity Index between VHD and LHD. (a) Binary Sorenson–Dice Dissimilarity (BSDD) index (y-axis) between drinking type gut microbiota violin plots showing BSDD for individual LHD (red) and VHD (blue) subjects with AUD longitudinally followed after abstinence. BSDD values were significantly different between LHD and VHD at the first and 5 day comparisons (t-test, p < .03) and also at the first and week 3 comparisons (t-test, p < .02). (b) Average BSDDs for each participant (y-axis) for LHD and VHD. Average BSDD for LHD tightly clustered between 0.1 and 0.2. Average BSDD for VHD showed a larger range from 0.13 to 0.43.
Figure 9.
Figure 9.
Relative Abundance of Oral Genera in LHD and VHD. Each vertical bar represents the relative abundance of the oral sample matching the initial stool sample for that participant. Legend lists only those genera having at least 1% or more abundance.
Figure 10.
Figure 10.
Shannon Diversity of oral genera in the LHD and VHD groups. Diversity LHD (red) and VHD (blue) did not differ significantly.
Figure 11.
Figure 11.
(a) Overlap of genera represented in the oral (green) and in the gut (red) microbiomes of the healthy HMP cohort (https://www.hmpdacc.org/hmp/HMQCP/) (Figure 11(a)) and in AUD patients in the present study (Figure 11(b)). Ten genera were found to be in common between oral/gut in the AUD participants.

References

    1. Gilmore W, Chikritzhs T, Stockwell T, Jernigan D, Naimi T, Gilmore I.. Alcohol: taking a population perspective. Nat Rev Gastroenterol Hepatol. 2016;13(7):426–434. doi:10.1038/nrgastro.2016.70. - DOI - PubMed
    1. American Psychiatric Association Diagnostic and Statistical Manual of Mental Disorders, 5th ed Arlington (VA): American Psychiatric Publishing; 2013.
    1. Grant BF, Chou SP, Sha TD, Pickering RP, Kerridege BT, Ruan WJ, Huang B, Jung, J, Zhang H, Fan A, et al. Prevalence of 12-month alcohol use, high-risk drinking, and DSM-Iv alcohol use disorder in the United States, 2001-2002 to 2012-2013: results from the national epidemiologic survey on alcohol and related conditions. JAMA Psychiatry. 2017;74(9):911–923. doi:10.1001/jamapsychiatry.2017.2161. - DOI - PMC - PubMed
    1. Substance Abuse and Mental Health Services Administration (SAMHSA) Key substance us and mental health indicators in the United States: results from the 2017 national survey on drug use and health. N.S.H.-. HHS Publicaiton No. SMA 18-5068 , Editor. Rockville (MD): Center for Behavioral Health Statistics and Quality, Substance Abuse and Mental Health Services Administration; 2018.
    1. Hillemacher T, Bachmann O, Kahl KG, Frieling H. Alcohol, microbiome, and their effect on psychiatric disorders. Prog Neuropsychopharmacol Biol Psychiatry. 2018;85:105–115. doi:10.1016/j.pnpbp.2018.04.015. - DOI - PubMed

Publication types