

Directed acyclic graphs and causal thinking in clinical risk prediction modeling
- PMID: 32615926
- PMCID: PMC7331263
- DOI: 10.1186/s12874-020-01058-z
Directed acyclic graphs and causal thinking in clinical risk prediction modeling
Abstract
Background: In epidemiology, causal inference and prediction modeling methodologies have been historically distinct. Directed Acyclic Graphs (DAGs) are used to model a priori causal assumptions and inform variable selection strategies for causal questions. Although tools originally designed for prediction are finding applications in causal inference, the counterpart has remained largely unexplored. The aim of this theoretical and simulation-based study is to assess the potential benefit of using DAGs in clinical risk prediction modeling.
Methods: We explore how incorporating knowledge about the underlying causal structure can provide insights about the transportability of diagnostic clinical risk prediction models to different settings. We further probe whether causal knowledge can be used to improve predictor selection in clinical risk prediction models.
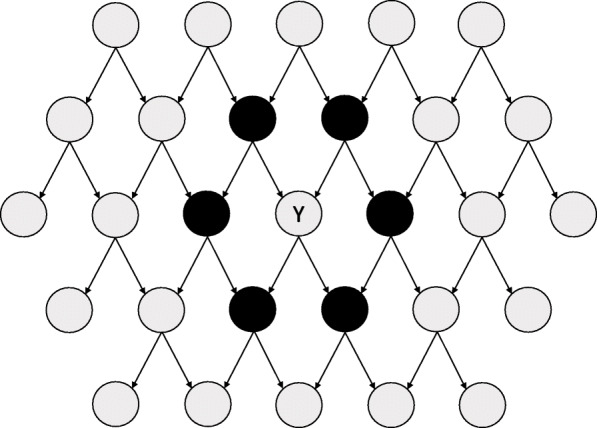
Results: A single-predictor model in the causal direction is likely to have better transportability than one in the anticausal direction in some scenarios. We empirically show that the Markov Blanket, the set of variables including the parents, children, and parents of the children of the outcome node in a DAG, is the optimal set of predictors for that outcome.
Conclusions: Our findings provide a theoretical basis for the intuition that a diagnostic clinical risk prediction model including causes as predictors is likely to be more transportable. Furthermore, using DAGs to identify Markov Blanket variables may be a useful, efficient strategy to select predictors in clinical risk prediction models if strong knowledge of the underlying causal structure exists or can be learned.
Keywords: Causality; Clinical risk prediction; Directed acyclic graph; Markov blanket; Prediction models; Predictor selection; Transportability.
Conflict of interest statement
We declare no conflicts of interest for the submitted work. JLR, MP and SK have nothing further to disclose. Outside of the submitted work, TK reports having contributed to an advisory board of CoLucid and a research project funded by Amgen, for which the Charité – Universitätsmedizin Berlin received an unrestricted compensation. He further reports having received honoraria from Lilly, Newsenselab, and Total for providing methodological advice, from Novartis and from Daiichi Sankyo for providing a lecture on neuroepidemiology and research methods, and from the BMJ for editorial services.
Figures


References
-
- Peters J, Janzing D, Schölkopf B. Elements of Causal Inference: Foundations and Learning Algorithms. Cambridge: MIT Press; 2017.
-
- Greenland S, Pearl J. Causal Diagrams: Wiley StatsRef. Statistics Reference Online; 2014. https://onlinelibrary.wiley.com/doi/abs/10.1002/9781118445112.stat03732. - DOI
Publication types
MeSH terms
Grants and funding
LinkOut - more resources
Full Text Sources
