. 2020 Jul 2;20(1):203.
doi: 10.1186/s12906-020-02992-7.

Qiliqiangxin reduced cardiomyocytes apotosis and improved heart function in infarcted heart through Pink1/Parkin -mediated mitochondrial autophagy

Affiliations

Qiliqiangxin reduced cardiomyocytes apotosis and improved heart function in infarcted heart through Pink1/Parkin -mediated mitochondrial autophagy

Junyang Zhou et al. BMC Complement Med Ther. .

Abstract

Background: Qiliqiangxin (QLQX) is a preparation refined from a traditional Chinese medicine compound. It plays an important role in protecting cardiac function after myocardial infarction (MI). However, the underline mechanism of QLQX action is not clear. The purpose of this study was to detect the effects of QLQX on mitophagy after MI.

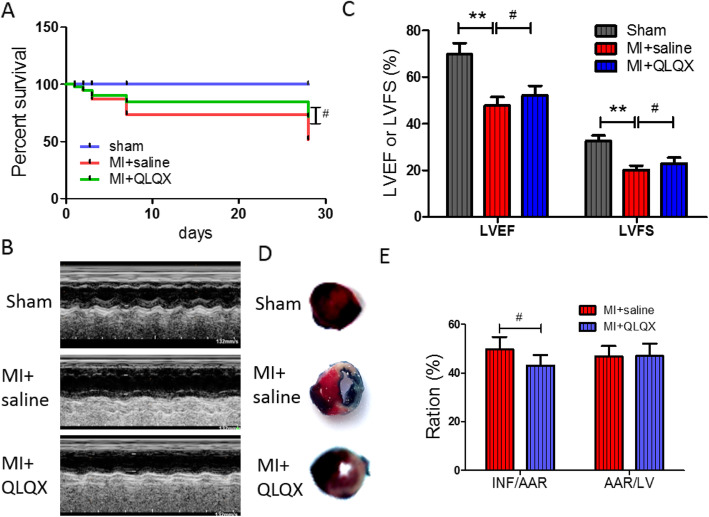
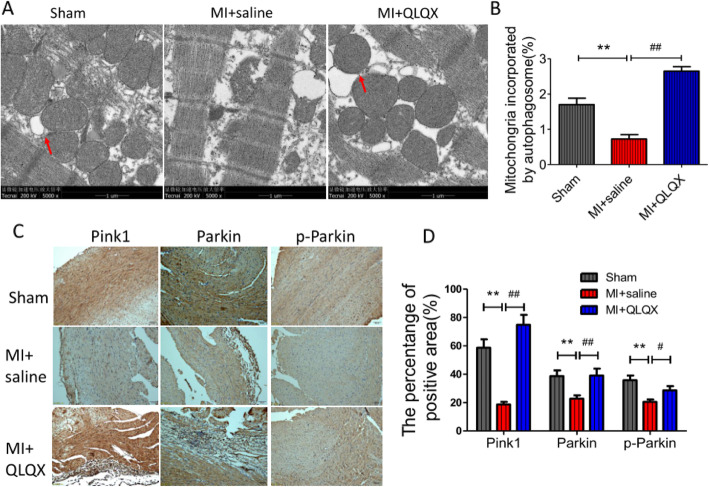
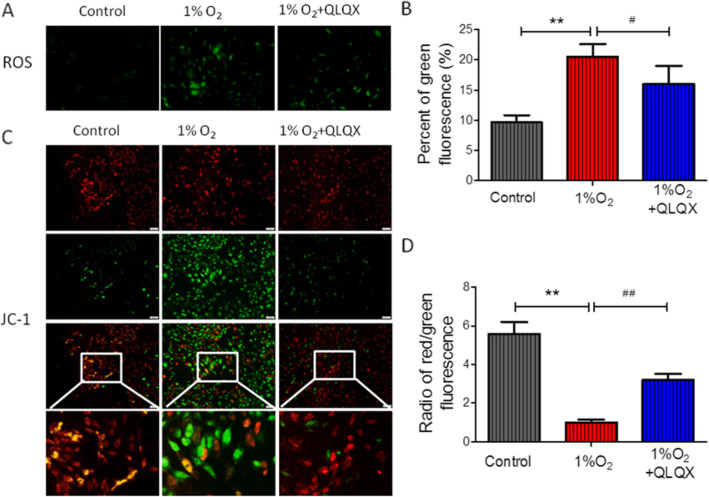
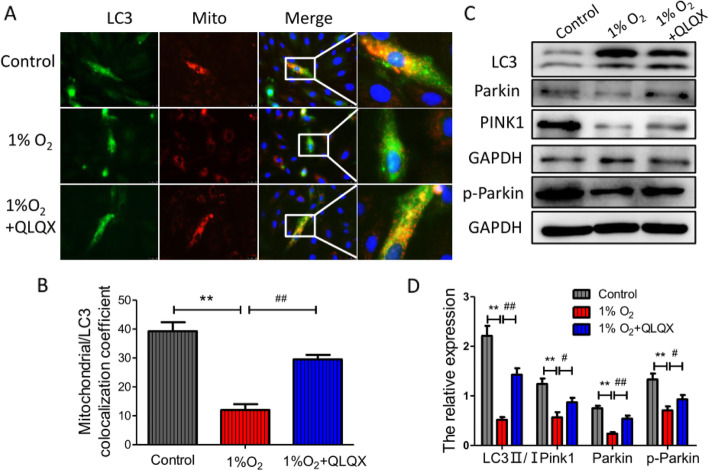
Methods: Male FVB/NJ mice aged 8-10 weeks were underwent left coronary artery ligation and were orally administered either QLQX (0.25 g/kg/d) or saline. Twenty-eight days after surgical operation, the cardiac function of mice was detected by echocardiography. Electron Microscopy was used to observe the microstructure of cardiomyocytes. Myocardial apoptosis was examined by TdT-mediated dUTP Nick-End Labeling (TUNEL) and western blot. H9c2 cells were cultured in a hypoxic incubator chamber (5% CO2, 1% O2, 94% N2) for 12 h and pretreated with or without QLQX (0.5 mg/mL). The cell apoptosis, reactive oxygen species (ROS), mitochondrial membrane potential and mitophagy were detected.

Results: When compared to sham group, the cardiac function of MI mice decreased significantly, and their cardiomyocyte apoptosis and mitochondrial damage were more serious. These MI-induced cardiac changes could be reversed by QLQX treatment. In vitro experiments also confirmed that QLQX could protect cardiomyocytes from hypoxia-induced apoptosis and mitochondrial damage. Further study indicated that QLQX could increase the expression of Pink1 and Parkin in cardiomyocytes.

Conclusion: Qiliqiangxin could reduce cardiomyocytes apotosis and improved heart function in infarcted heart through Pink1-mediated mitochondrial autophagy.

Keywords: Heart function; Mitophagy; Myocardial infarction; Qiliqiangxin.


Conflict of interest statement

The authors declare that they have no competing interest.

Figures

Fig. 1
Fig. 1
Qiliqiangxin (QLQX) improves survival rate and cardiac function after myocardial infarction (MI). a: Survival rate. FVB/NJ mice were subjected to sham or MI operation. The number of dead mice over a 4-wk period was counted daily. Survival curves were analyzed with the Kaplan-Meier tests. Data are presented as mean ± SD, #compared to saline group, P < 0.05, n = 10 per group. b: Echocardiogram analysis. Representative echocardiographic images of FVB/NJ mice 4 weeks after MI surgery. c: QLQX improves cardiac function including preserving left ventricular fractional shortening (LVFS) and left ventricular ejection fraction (LVEF). Data are presented as mean ± SD, **compared to Sham group, P < 0.01, # compared to saline group, P < 0.05, n = 8 per group. d: Evan’s blue/TTC stain. Heart tissue sections were stained with Evan’s blue/TTC at 4 weeks after MI surgery. The infarct area (INF: white) and area at risk (AAR: red); blue is the normal myocardial blood supply area. e: The ratio of INF/AAR and AAR/LV. Data are presented as mean ± SD, # compared to saline group, P < 0.05, n = 6 per group. The comparison of measurement data between two groups was carried out by independent-sample T test
Fig. 2
Fig. 2
Qiliqiangxin (QLQX) reduces cardiomyocyte apoptosis after myocardial infarction (MI) during remodeling phase. a: TUNEL Assays detected the apoptosis cells in the infarction peripheral tissues. The yellow arrow indicated the apoptosis cells. b: Column diagram showed the percentage of apoptosis cells, data are presented as mean ± SD, ** Compared to sham group, P < 0.01; ## Compared to saline group, P < 0.01, n = 4 per group. c: Western blot detected the apoptosis marker Bax and Bcl-2. d: Column diagram showed the ratio of Bax/Bcl-2. Data are presented as mean ± SD, ** Compared to sham group, P < 0.01; ## Compared to saline group, P < 0.01, n = 4 per group. The comparison of measurement data between two groups was carried out by independent-sample T test
Fig. 3
Fig. 3
QLQX increases mitophagy after MI surgery. a: Transmission electron microscopy (5000×) detected mitochondrial structure and autophagy in infarction peripheral tissues, the red arrows indicated the autophagosome. b: Column diagram showed the percentage of mitochongria incorporated by autophagosome, data are presented as mean ± SD, ** Compared to sham group, P < 0.01; ## Compared to saline group, P < 0.01, n = 3 per group. c&d: Immunochemical staining detected the expression of Pink1, Parkin and p-Parkin in the heart at 4 weeks after MI. Representative images were selected from 3 separate experiments. Data are presented as mean ± SD, ** Compared to sham group, P < 0.01; ## Compared to saline group, P < 0.01, # Compared to saline group, P < 0.05, n = 4 per group. The comparison of measurement data between two groups was carried out by independent-sample T test
Fig. 4
Fig. 4
Effect of QLQX on hypoxic injury in H9c2 cardiac cells. a: TUNEL staining was used to detect the apoptosis of H9c2 cells treated with 1% O2 or 1% O2 + QLQX for 12 h, the green fluorescence indicated the apoptotic cells. b: Column diagram showed percentage of apoptosis cells. Data are presented as mean ± SD, ** Compared to control group, P < 0.01; ## Compared to 1% O2 group, P < 0.01. n = 3 per group. c: Western blot analysis of Bax and Bcl-2 levels in H9c2 cells. d: Column diagram showed the relative expression levels of Bax and Bcl-2. The statistical data are presented as mean ± SD of three independent experiments. Data are presented as mean ± SD, ** Compared to control group, P < 0.01; ## Compared to 1% O2 group, P < 0.01. n = 3 per group. The comparison of measurement data between two groups was carried out by independent-sample T test
Fig. 5
Fig. 5
QLQX reduced ROS production and increased ∆Ψm. a: Representative images of ROS staining. b: Quantifications of ROS fluorescence intensity in different groups. Data are presented as mean ± SD, ** Compared to control group, P < 0.01; ## Compared to 1% O2 group, P < 0.01. n = 3 per group. c: Mitochondrial membrane potential (∆Ψm) detected by JC-1 staining. Red fluorescence represents the mitochondrial aggregate form of JC-1, indicating an intact mitochondrial membrane potential. Green fluorescence represents the monomeric form of JC-1, indicating the dissipation of ∆Ψm. d: Ratio of the red/green fluorescence intensity. Data are presented as mean ± SD, ** Compared to control group, P < 0.01; ## Compared to 1%O2 group, P < 0.01. n = 3 per group. The comparison of measurement data between two groups was carried out by independent-sample T test
Fig. 6
Fig. 6
QLQX increased mitophagy level in hypoxic injured H9c2 cells. a: Representative photomicrographs of GFP-LC3 and red fluorescent protein (RFP)-tagged HBmTur-Mito staining in H9c2 cells. The green fluorescence dots indicate the autophagy. The red fluorescence dots indicate the mitochondria. The orange fluorescence indicates the mitophagy, 400×. b: The co-localization efficient of Mitochondria and LC3. Data are presented as mean ± SD, ** Compared to control group, P < 0.01; ## Compared to 1% O2 group, P < 0.01. n = 3 per group. c: Western blot analysis of mitophagy markers of LC3, Parkin, Pink1and p-Parkin in different groups. d: Column diagram showing the relative expression level of LC3, Pink1,Parkin and pParkin. Data are presented as mean ± SD, ** Compared to control group, P < 0.01; ## Compared to 1% O2 group, P < 0.01, # Compared to 1% O2 group, P < 0.05, n = 3 per group. The comparison of measurement data between two groups was carried out by independent-sample T test

References

    1. Heusch G, Libby P, Gersh B, Yellon D, Bohm M, Lopaschuk G, Opie L. Cardiovascular remodelling in coronary artery disease and heart failure. Lancet. 2014;383:1933–1943. doi: 10.1016/S0140-6736(14)60107-0. - DOI - PMC - PubMed
    1. Seropian IM, Toldo S, Van Tassell BW, Abbate A. Anti-inflammatory strategies for ventricular remodeling following ST-segment elevation acute myocardial infarction. J Am Coll Cardiol. 2014;63:1593–1603. doi: 10.1016/j.jacc.2014.01.014. - DOI - PubMed
    1. Mezzaroma E, Toldo S, Farkas D, Seropian IM, Van Tassell BW, Salloum FN, Kannan HR, Menna AC, Voelkel NF, Abbate A. The inflammasome promotes adverse cardiac remodeling following acute myocardial infarction in the mouse. Proc Natl Acad Sci U S A. 2011;108:19725–19730. doi: 10.1073/pnas.1108586108. - DOI - PMC - PubMed
    1. Devaux Y, Vausort M, McCann GP, Zangrando J, Kelly D, Razvi N, Zhang L, Ng LL, Wagner DR, Squire IB. MicroRNA-150: a novel marker of left ventricular remodeling after acute myocardial infarction. Circ Cardiovasc Genet. 2013;6:290–298. doi: 10.1161/CIRCGENETICS.113.000077. - DOI - PubMed
    1. Vilahur G, Juan-Babot O, Pena E, Onate B, Casani L, Badimon L. Molecular and cellular mechanisms involved in cardiac remodeling after acute myocardial infarction. J Mol Cell Cardiol. 2011;50:522–533. doi: 10.1016/j.yjmcc.2010.12.021. - DOI - PubMed