. 2020 Jul 2;10(1):10956.
doi: 10.1038/s41598-020-67782-0.

Elongating maize root: zone-specific combinations of polysaccharides from type I and type II primary cell walls

Affiliations

Elongating maize root: zone-specific combinations of polysaccharides from type I and type II primary cell walls

Liudmila V Kozlova et al. Sci Rep. .

Abstract

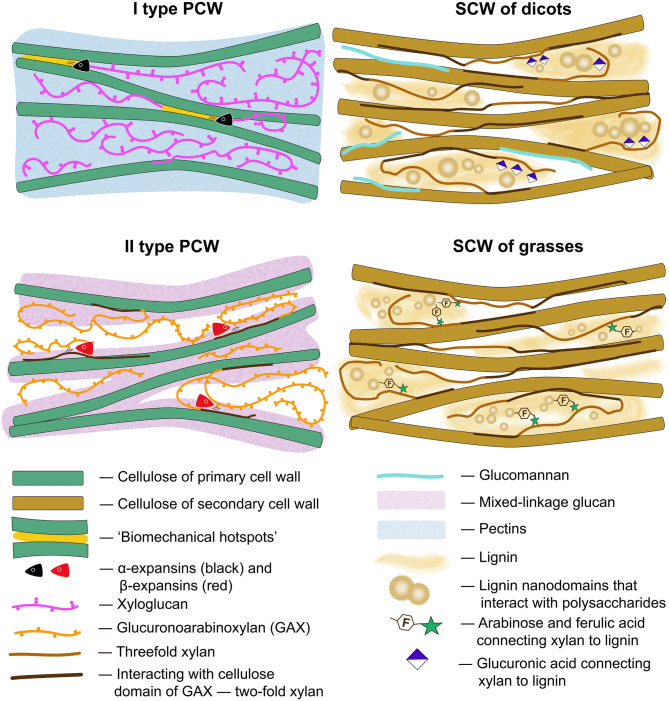
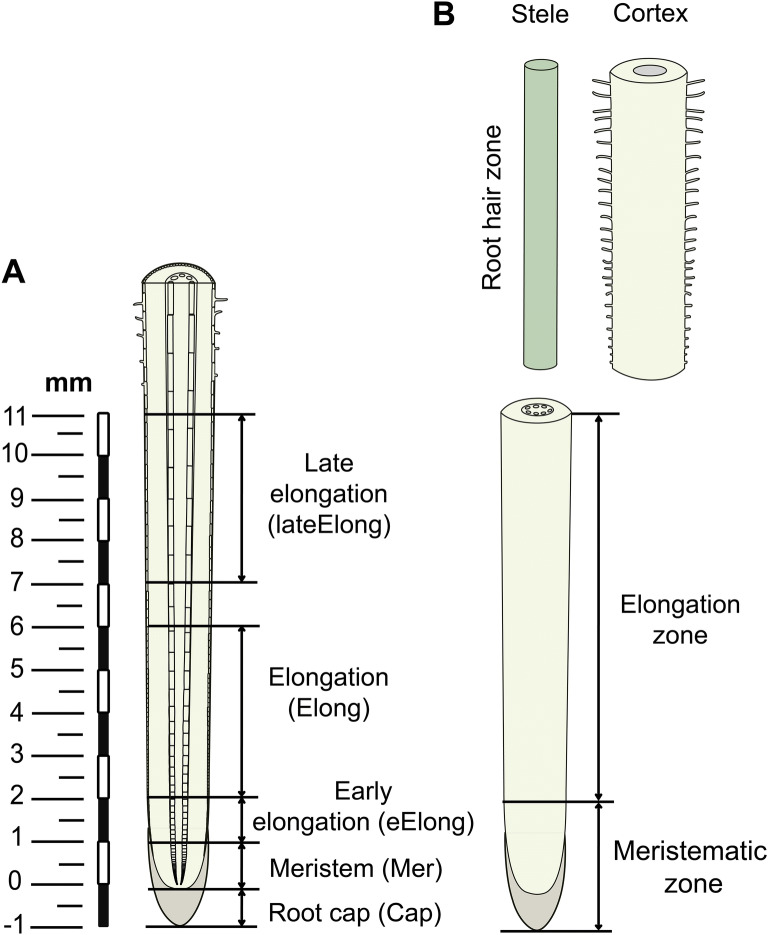
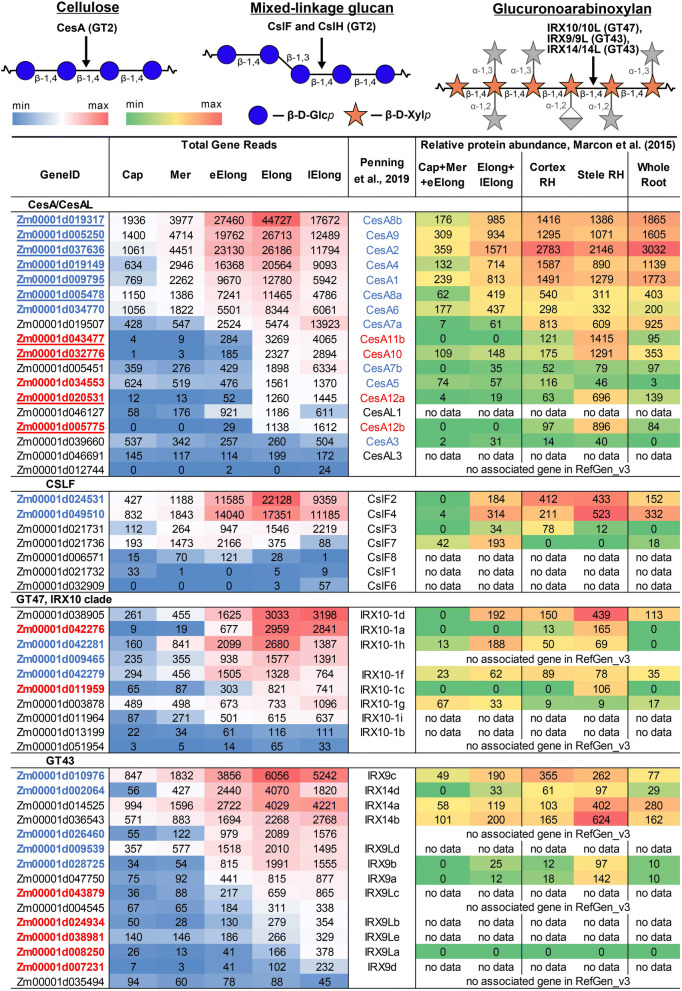
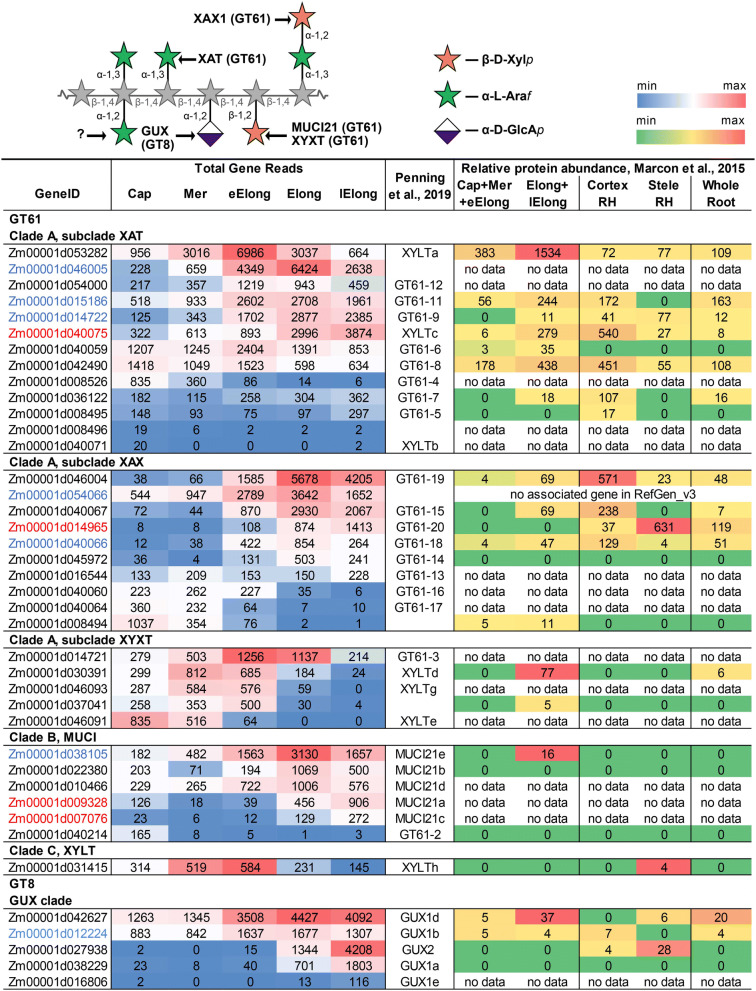
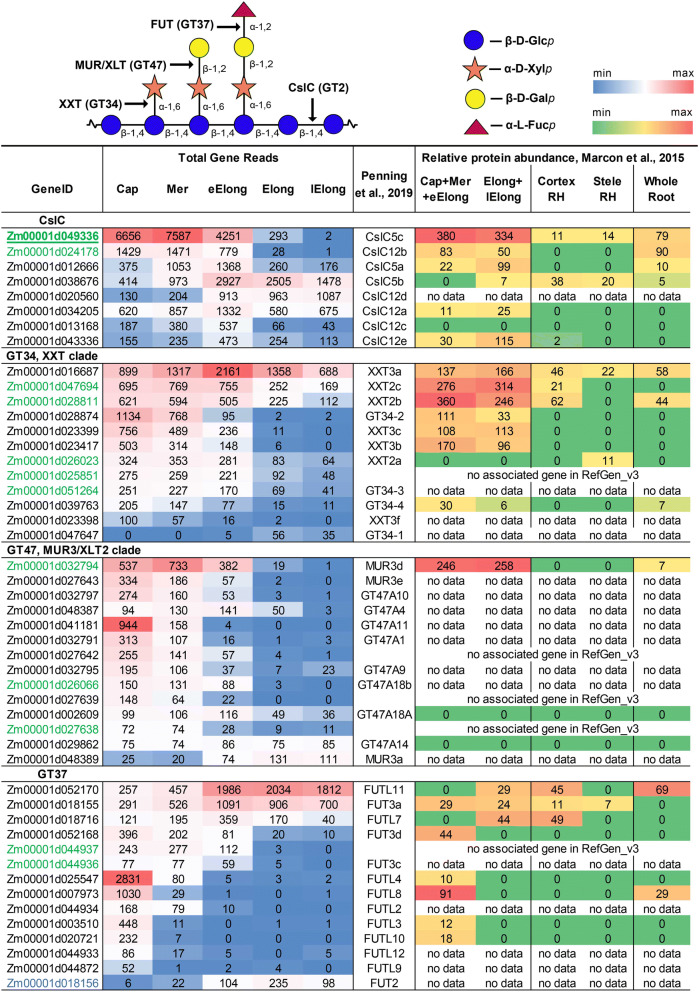
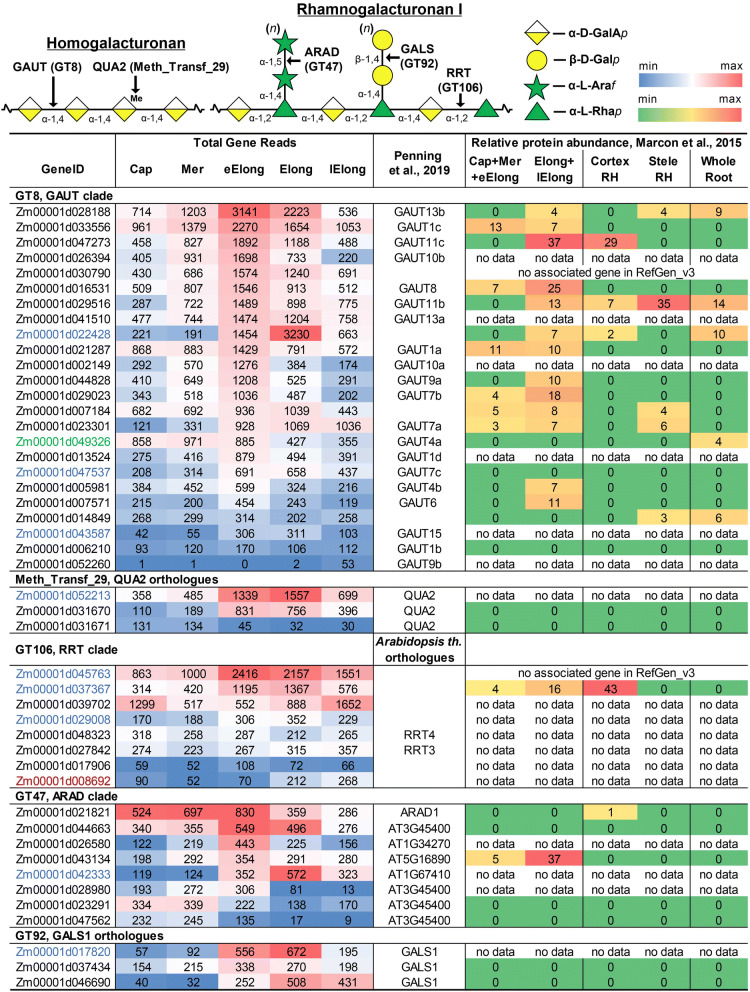
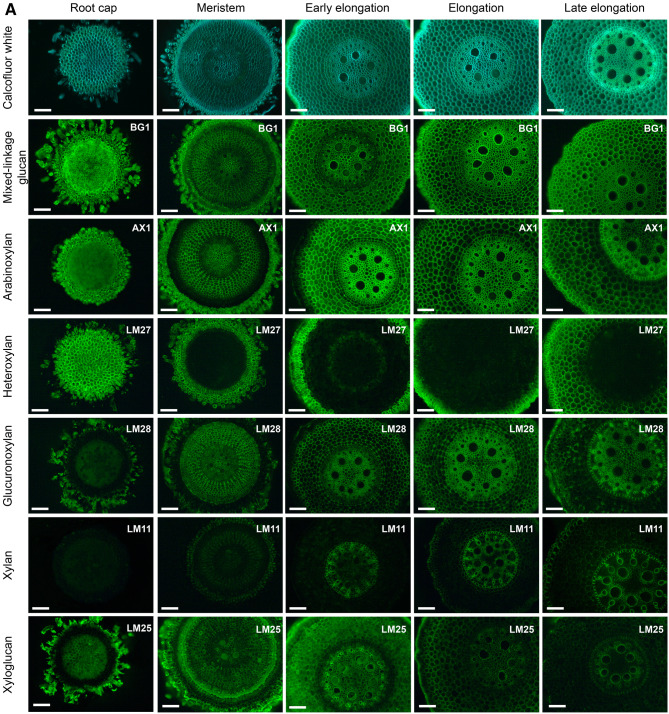
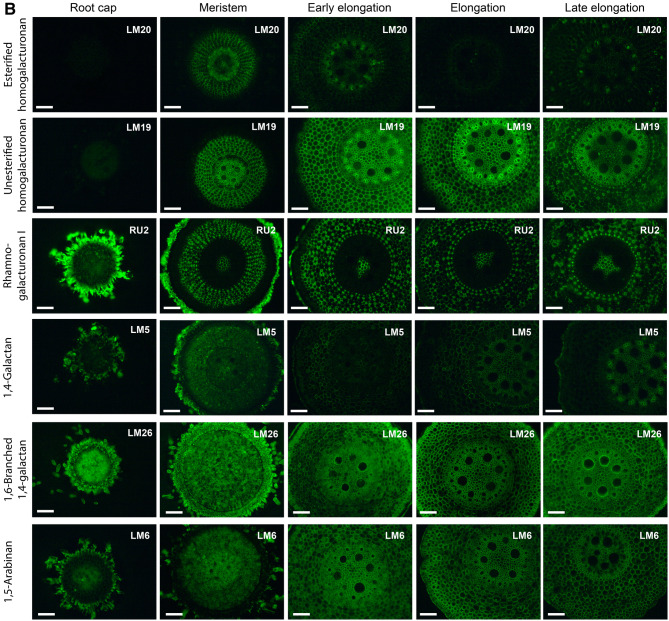
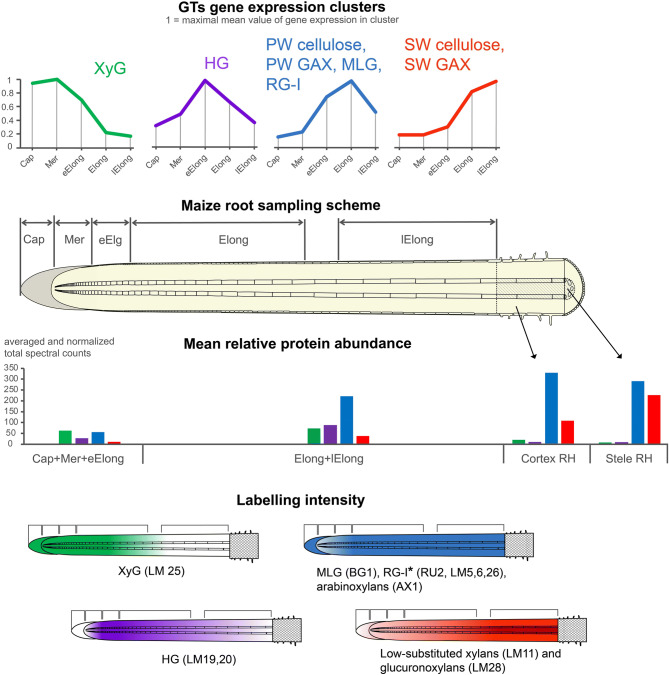
The dynamics of cell wall polysaccharides may modulate the cell wall mechanics and thus control the expansion growth of plant cells. The unique composition of type II primary cell wall characteristic of grasses suggests that they employ specific mechanisms for cell enlargement. We characterized the transcriptomes in five zones along maize root, clustered the expression of genes for numerous glycosyltransferases and performed extensive immunohistochemical analysis to relate the changes in cell wall polysaccharides to critical stages of cell development in Poaceae. Specific patterns of cell wall formation differentiate the initiation, realization and cessation of elongation growth. Cell walls of meristem and early elongation zone represent a mixture of type I and type II specific polysaccharides. Xyloglucans and homogalacturonans are synthesized there actively together with mixed-linkage glucans and glucuronoarabinoxylans. Rhamnogalacturonans-I with the side-chains of branched 1,4-galactan and arabinan persisted in cell walls throughout the development. Thus, the machinery to generate the type I primary cell wall constituents is completely established and operates. The expression of glycosyltransferases responsible for mixed-linkage glucan and glucuronoarabinoxylan synthesis peaks at active or late elongation. These findings widen the number of jigsaw pieces which should be put together to solve the puzzle of grass cell growth.


Conflict of interest statement

The authors declare no competing interests.

Figures

Figure 1
Figure 1
Different types of plant cell wall. Models may not be to scale. Based on (chronological order) Buckeridge et al., Kozlova et al., Kiemle et al., Wang et al., Simmons et al., Cosgrove, Kang et al., Coomey et al..
Figure 2
Figure 2
Schematic representation of the collection of samples from maize root in the current study (A) and for the proteome analysis reported by Marcon et al. (B).
Figure 3
Figure 3
Expression level (TGR, red-blue heat map) and relative protein abundance (averaged and normalized total spectral counts, red-green heat map) of ZmCesA/CesAL, ZmCslFs and genes encoding members of the xylan backbone synthase complex in various zones of maize root. Heat map color coding is applied separately to each gene subgroup. The underlined gene names indicate the baits for co-expression analysis. The genes co-expressed with maize primary cell wall CesAs are labelled in blue, and genes co-expressed with secondary cell wall CesAs are labelled in red. Annotations are based on the study by Penning et al., and are obtained by matching of the RefGen_v3 and RefGen_v4 gene models. The annotations shown in blue and in red are CesAs assigned to primary and secondary cell wall formation, respectively, by Penning et al.. Cap—root cap, Mer—meristem, eElong—early elongation zone, Elong—zone of active elongation, lElong—zone of late elongation before root hair initiation, and RH—root hair zone. No data, i.e., no corresponding peptides were obtained from any of the studied root samples.
Figure 4
Figure 4
Expression level (TGR, red-blue heat map) of genes potentially involved in GAX backbone decoration in maize root and relative levels of the corresponding proteins (averaged and normalized total spectral counts, red-green heat map. Heat map color coding is applied separately to each gene subgroup. The genes co-expressed with maize primary cell wall CesAs are labelled in blue, and genes co-expressed with secondary cell wall CesAs are labelled in red. Annotations are based on the study by Penning et al., and are obtained by matching the RefGen_v3 and RefGen_v4 gene models. Cap—root cap, Mer—meristem, eElong—early elongation zone, Elong—zone of active elongation, lElong—zone of late elongation before root hair initiation, and RH—root hair zone. No data, i.e., no corresponding peptides were detected in any of the studied root samples.
Figure 5
Figure 5
Expression level (TGR, red-blue heat map) and relative protein abundance (averaged and normalized total spectral counts, red-green heat map) of genes potentially involved in XyG synthesis in maize root. Heat map color coding is applied separately to each gene subgroup. The gene co-expressed with maize primary cell wall CesAs is labelled in blue. Green indicates genes co-expressed with ZmCslC5c (underlined) and displaying a correlation coefficient greater than 0.95. Annotations are based on the study by Penning et al., and are obtained by matching the RefGen_v3 and RefGen_v4 gene models. Cap—root cap, Mer—meristem, eElong—early elongation zone, Elong—zone of active elongation, lElong—zone of late elongation before root hair initiation, and RH—root hair zone. No data, i.e., no corresponding peptides, were detected in any of the studied root samples.
Figure 6
Figure 6
Expression level (TGR, red-blue heat map) and relative protein abundance (averaged and normalized total spectral counts, red-green heat map) of genes potentially involved in HG and RG-I biosynthesis in maize root. Heat map color coding is applied separately to each gene subgroup. The genes co-expressed with maize primary cell wall CesAs are labelled in blue, and genes co-expressed with secondary cell wall CesAs are labelled in red. Green indicates genes co-expressed with ZmCslC5c presenting correlation coefficients greater than 0.95. Annotations are based on the study by Penning et al., and are obtained by matching the RefGen_v3 and RefGen_v4 gene models Cap—root cap, Mer—meristem, eElong—early elongation zone, Elong—zone of active elongation, lElong—zone of late elongation before root hair initiation, and RH—root hair zone. No data, i.e., no corresponding peptides, were detected in any of the studied root samples.
Figure 7
Figure 7
Fluorescence micrographs of maize root sections stained with Calcofluor White and immunolabelled by BG1 (mixed-linkage glucan), LM25 (galactoxyloglucan), AX1 (arabinoxylan), LM27 (grass heteroxylan), LM28 (glucuronoxylan), LM11 (low-substituted xylan), LM20 (esterified homogalacturonan), LM19 (un-esterified homogalacturonan), RU2 (rhamnogalacturonan I backbone), LM5 (1,4-β-galactan), LM6 (1,5-α-arabinan), and LM26 (1,6-branched 1,4-β-galactan) antibodies. Bar—100 μm. No fluorescence was detected in negative control samples (primary antibodies were omitted) under the observation conditions.
Figure 7
Figure 7
Fluorescence micrographs of maize root sections stained with Calcofluor White and immunolabelled by BG1 (mixed-linkage glucan), LM25 (galactoxyloglucan), AX1 (arabinoxylan), LM27 (grass heteroxylan), LM28 (glucuronoxylan), LM11 (low-substituted xylan), LM20 (esterified homogalacturonan), LM19 (un-esterified homogalacturonan), RU2 (rhamnogalacturonan I backbone), LM5 (1,4-β-galactan), LM6 (1,5-α-arabinan), and LM26 (1,6-branched 1,4-β-galactan) antibodies. Bar—100 μm. No fluorescence was detected in negative control samples (primary antibodies were omitted) under the observation conditions.
Figure 8
Figure 8
Four major clusters of GT expression in maize root. Expression profiles represent normalized and averaged TGR values for each cluster. Polysaccharides were assigned to a particular cluster based on the proportion of corresponding GTs included in the cluster. Protein levels are shown on a diagram as means for all members of a particular cluster. Labelling intensity is shown as color gradient where white corresponds to weak labelling. XyG—xyloglucan, HG—homogalacturonan, PW—primary cell wall, GAX—glucuronoarabinoxylan, MLG—mixed-linkage glucan, RG-I—rhamnogalacturonan-I, SW—secondary cell wall. Cap—Root cap, Mer—meristem, eElong—early elongation zone, Elong—elongation zone, and lElong—late elongation zone, Cortex RH and Stele RH—cortex and stele in root hair region, respectively. *RG-I related antibodies had equal intensity of labelling in all studied root zones.

References

    1. Carpita NC, Gibeaut DM. Structural models of primary-cell walls in flowering plants—consistency of molecular-structure with the physical-properties of the walls during growth. Plant J. 1993;3:1–30. doi: 10.1111/j.1365-313X.1993.tb00007.x. - DOI - PubMed
    1. Cosgrove DJ. Diffuse growth of plant cell walls. Plant Physiol. 2018;176:16–27. doi: 10.1104/pp.17.01541. - DOI - PMC - PubMed
    1. Park YB, Cosgrove DJ. A revised architecture of primary cell walls based on biomechanical changes induced by substrate-specific endoglucanases. Plant Physiol. 2012;158:1933–1943. doi: 10.1104/pp.111.192880. - DOI - PMC - PubMed
    1. Bidhendi AJ, Geitmann A. Relating the mechanics of the primary plant cell wall to morphogenesis. J. Exp. Bot. 2016;67:449–461. doi: 10.1093/jxb/erv535. - DOI - PubMed
    1. Hocq L, Pelloux J, Lefebvre V. Connecting homogalacturonan-type pectin remodeling to acid growth. Trends Plant Sci. 2017;22:20–29. doi: 10.1016/j.tplants.2016.10.009. - DOI - PubMed

Publication types