. 2020 Feb;2(2):167-178.
Epub 2020 Feb 20.

Mitochondrial Substrate Utilization Regulates Cardiomyocyte Cell Cycle Progression

Affiliations

Mitochondrial Substrate Utilization Regulates Cardiomyocyte Cell Cycle Progression

Alisson C Cardoso et al. Nat Metab. 2020 Feb.

Abstract

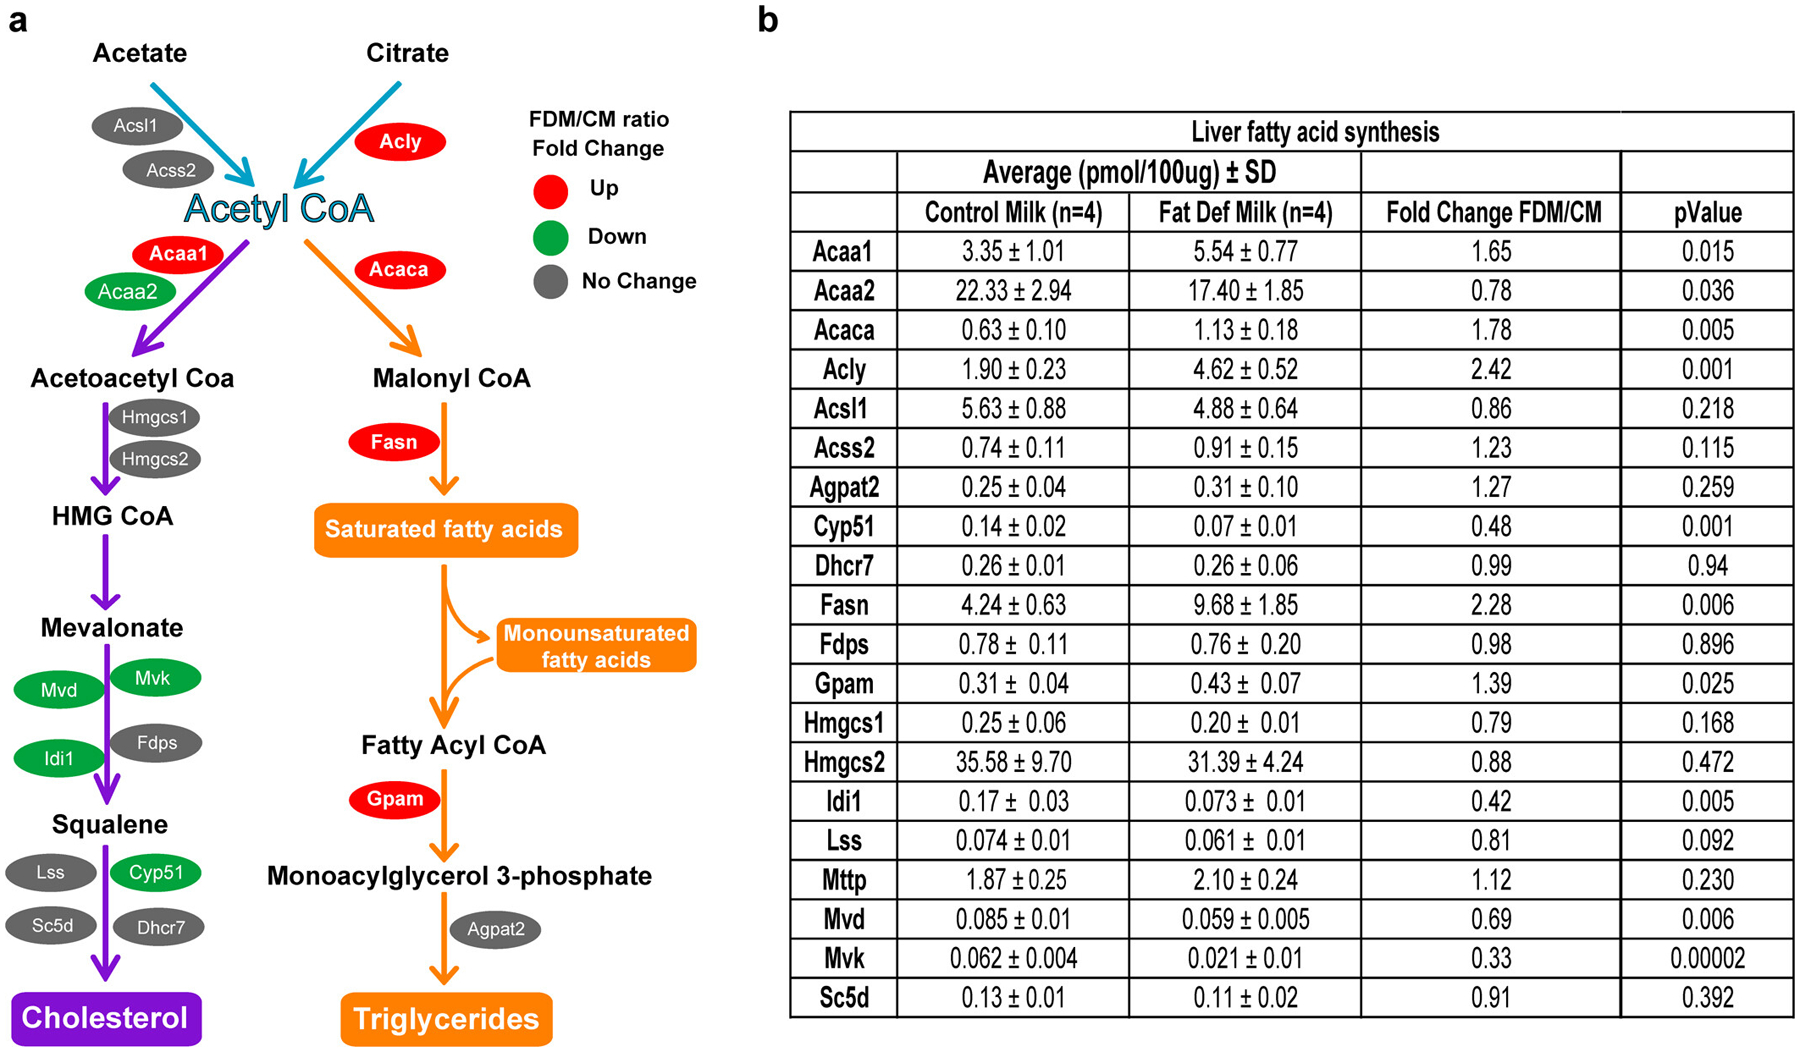
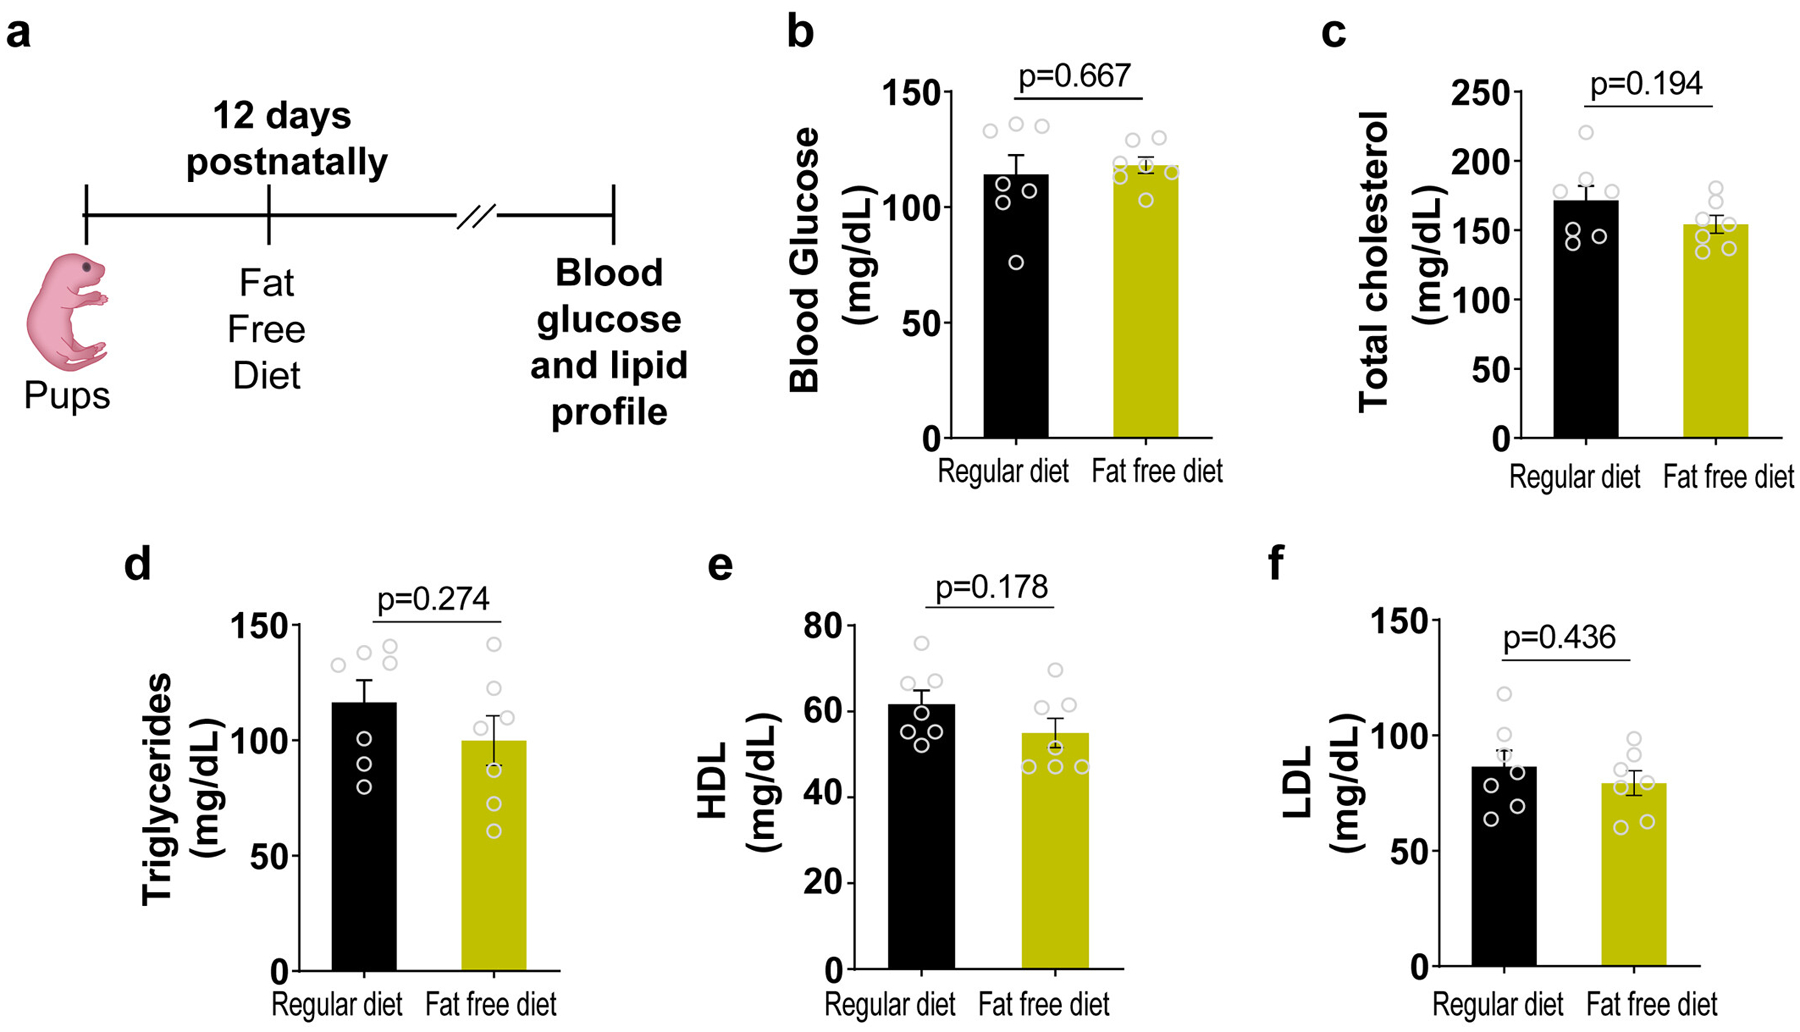
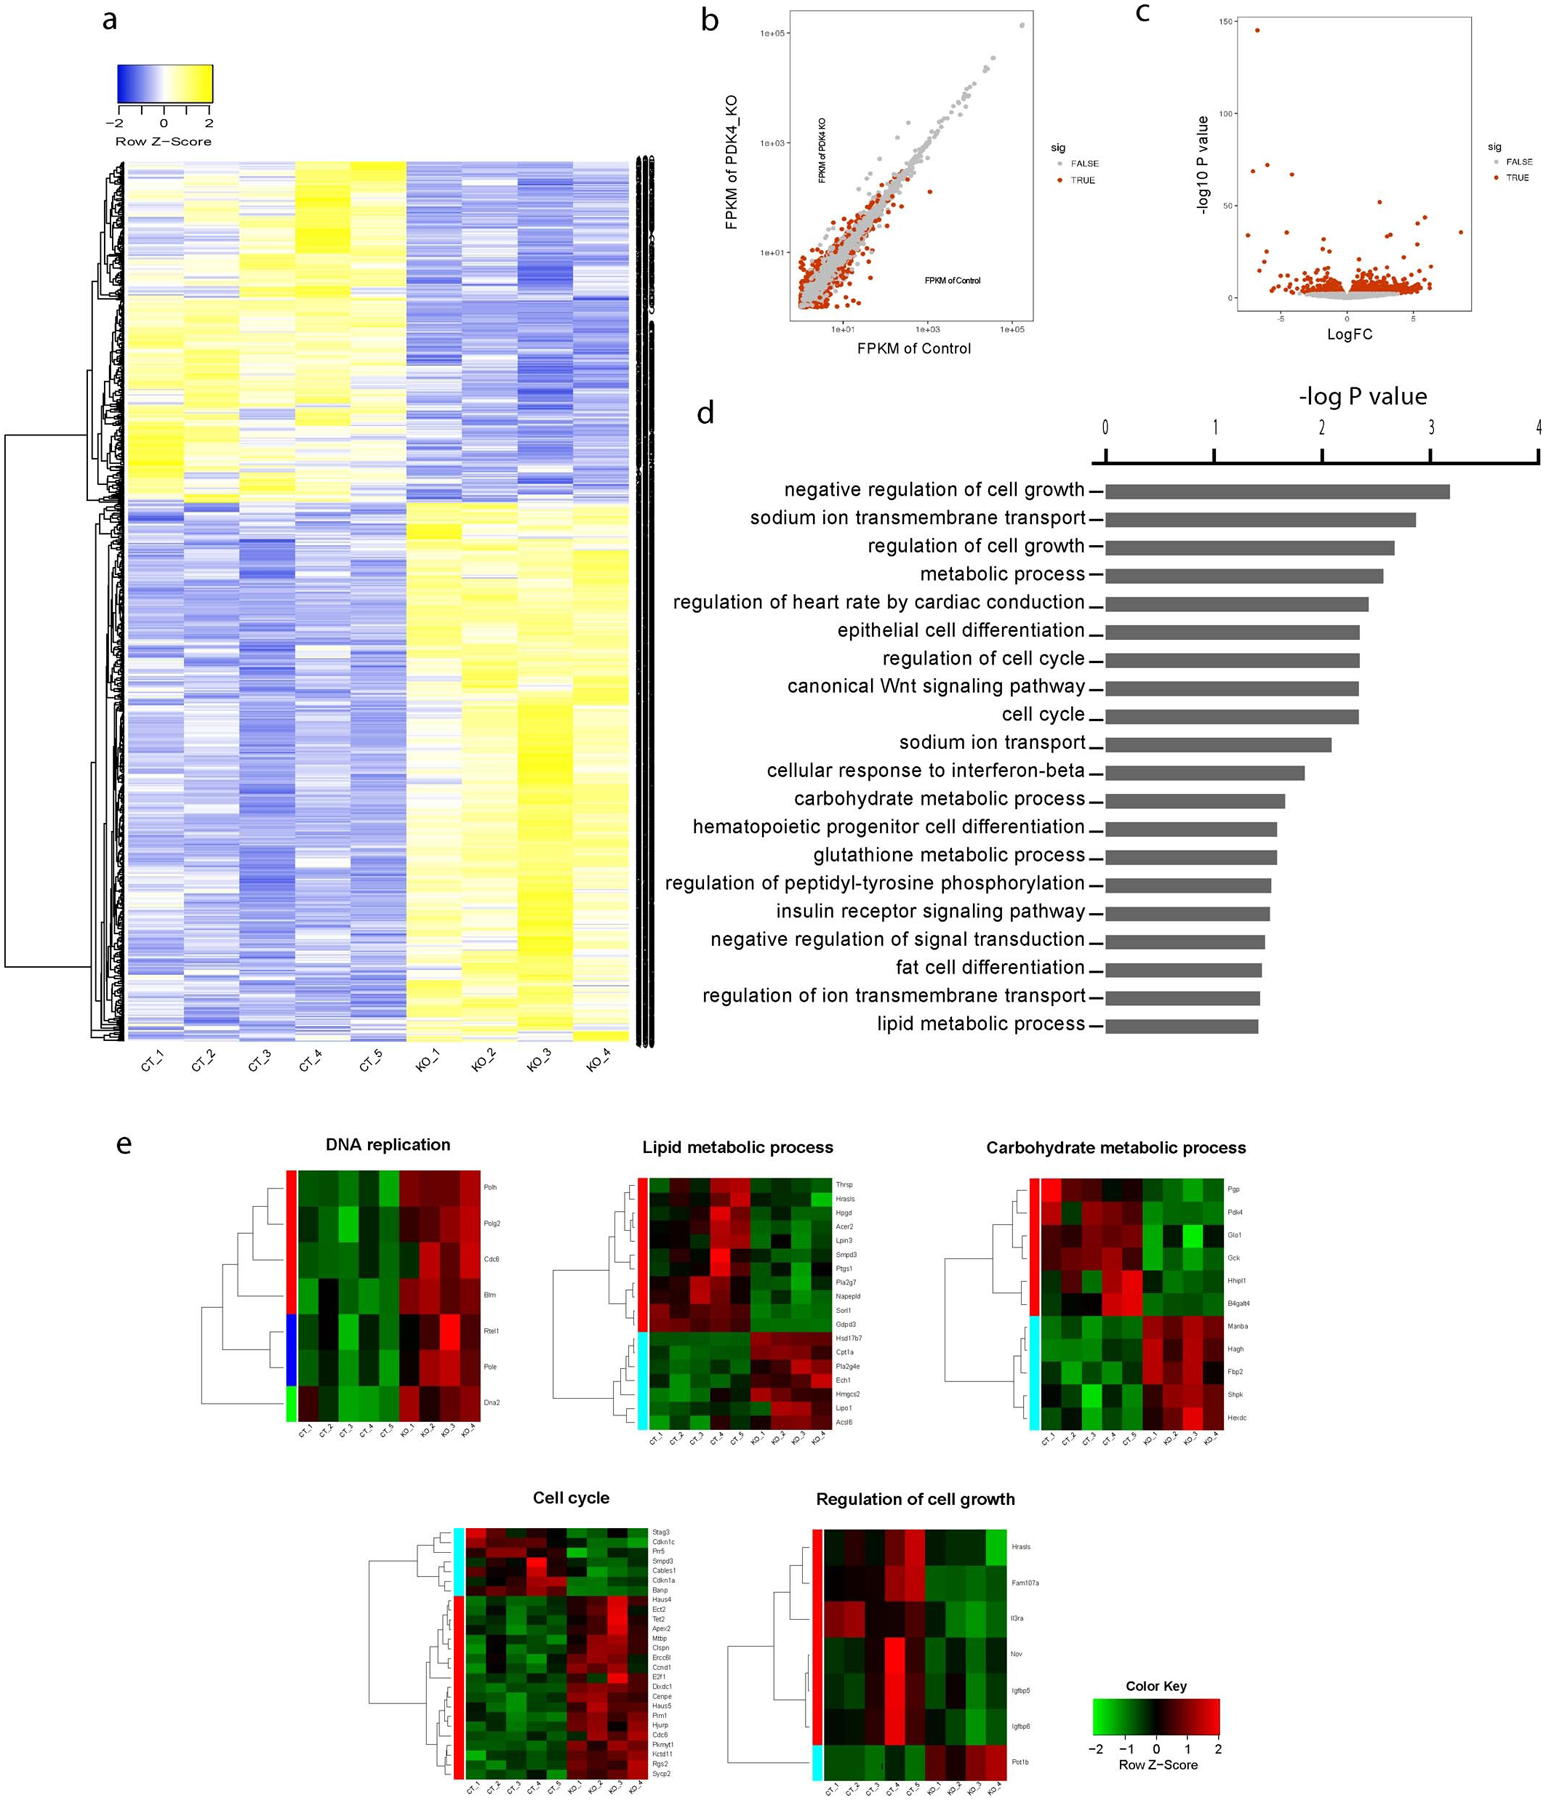
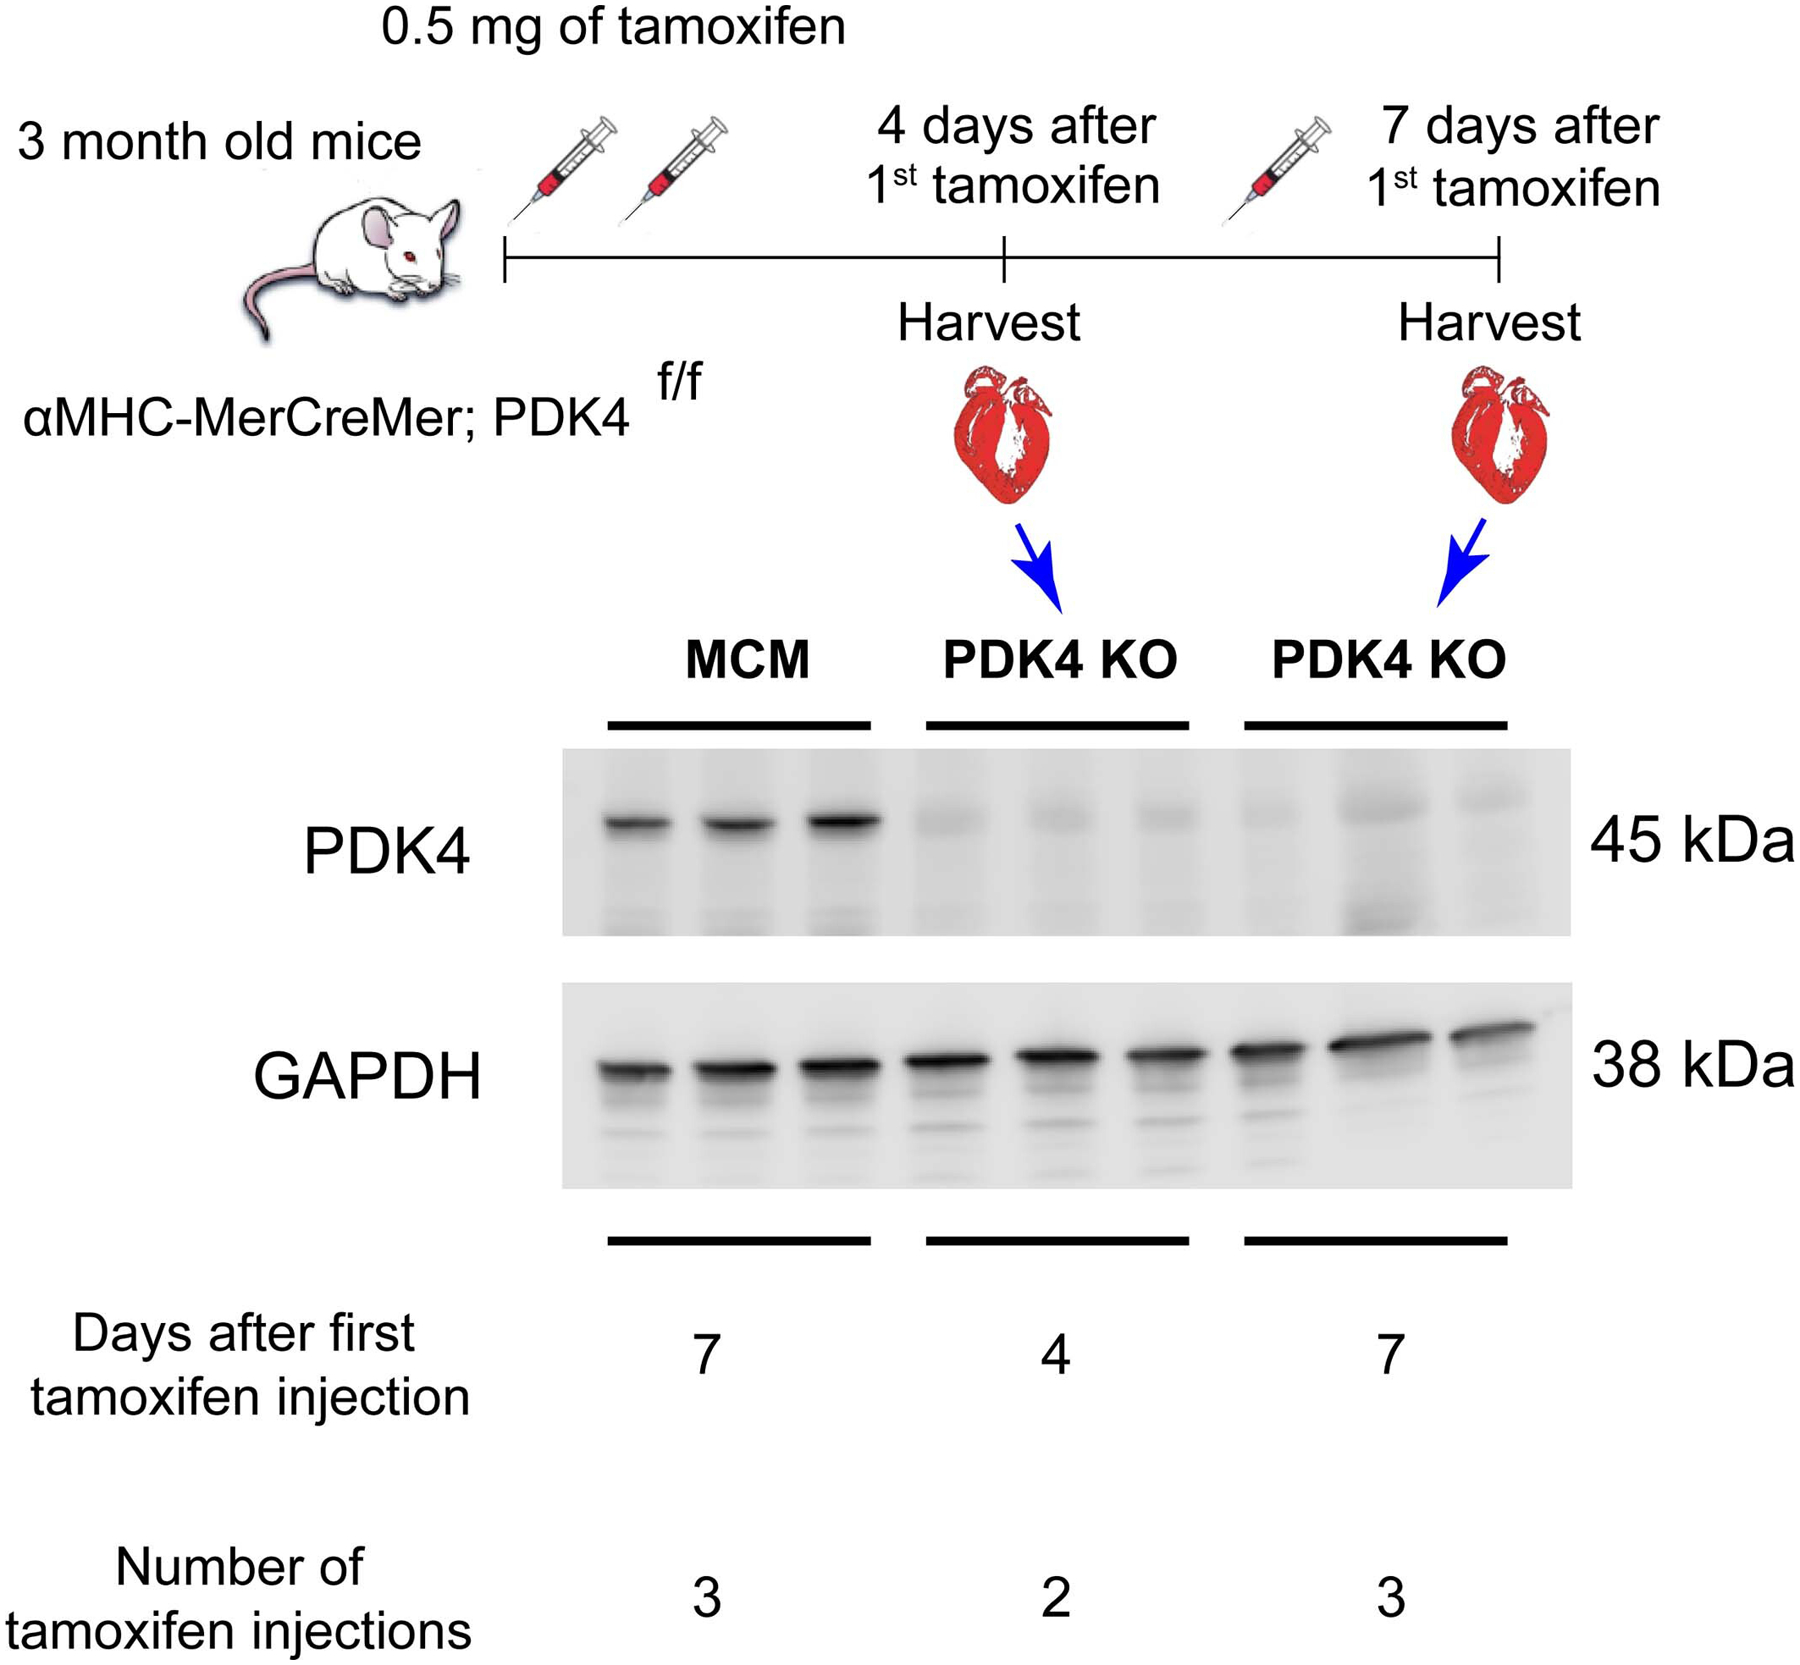
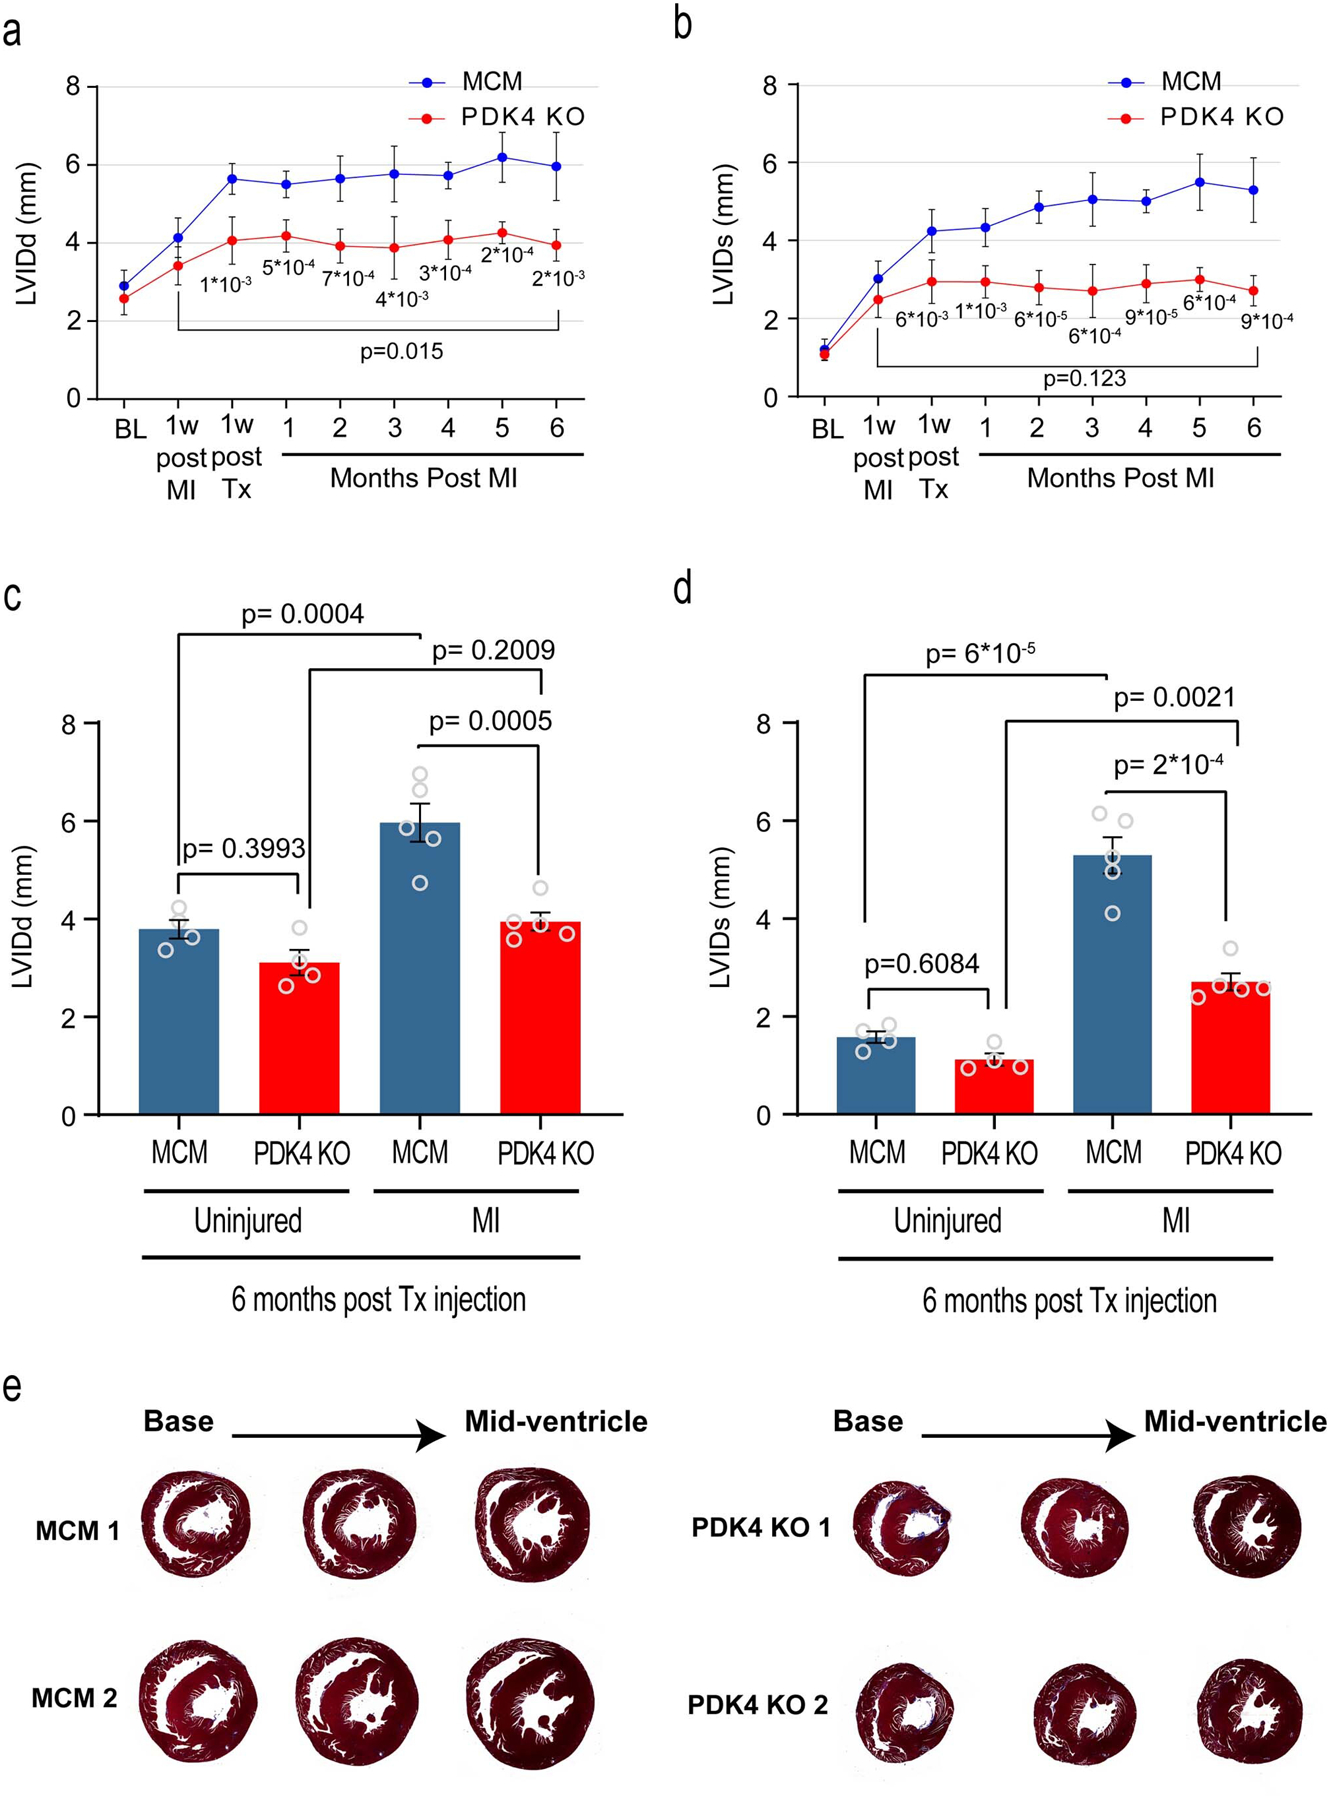
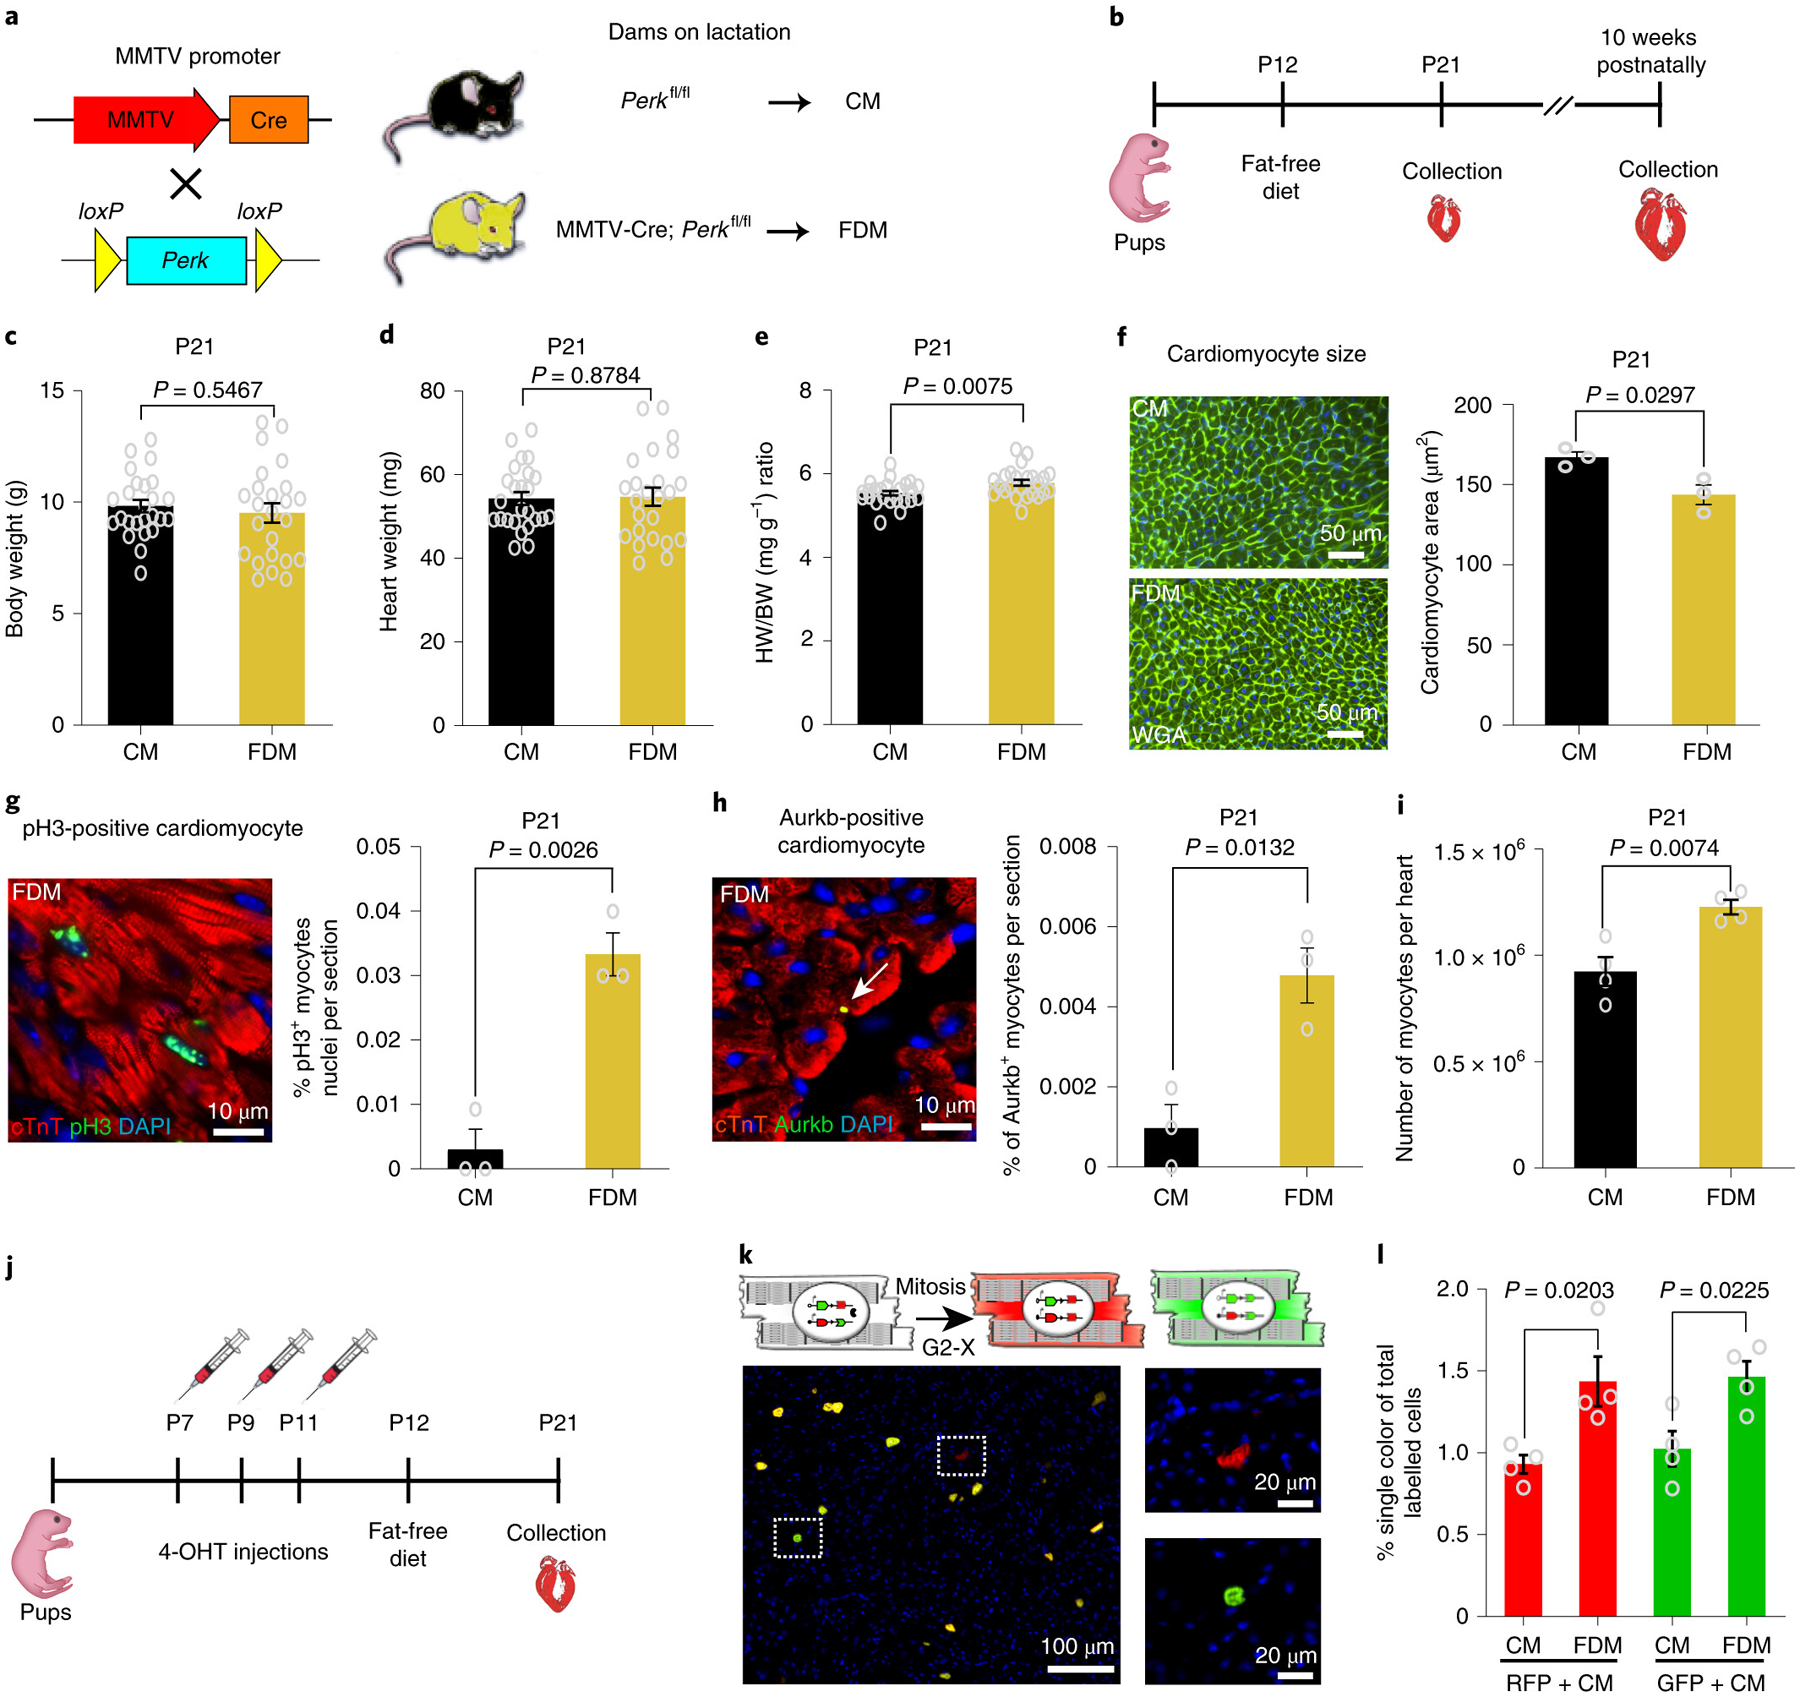
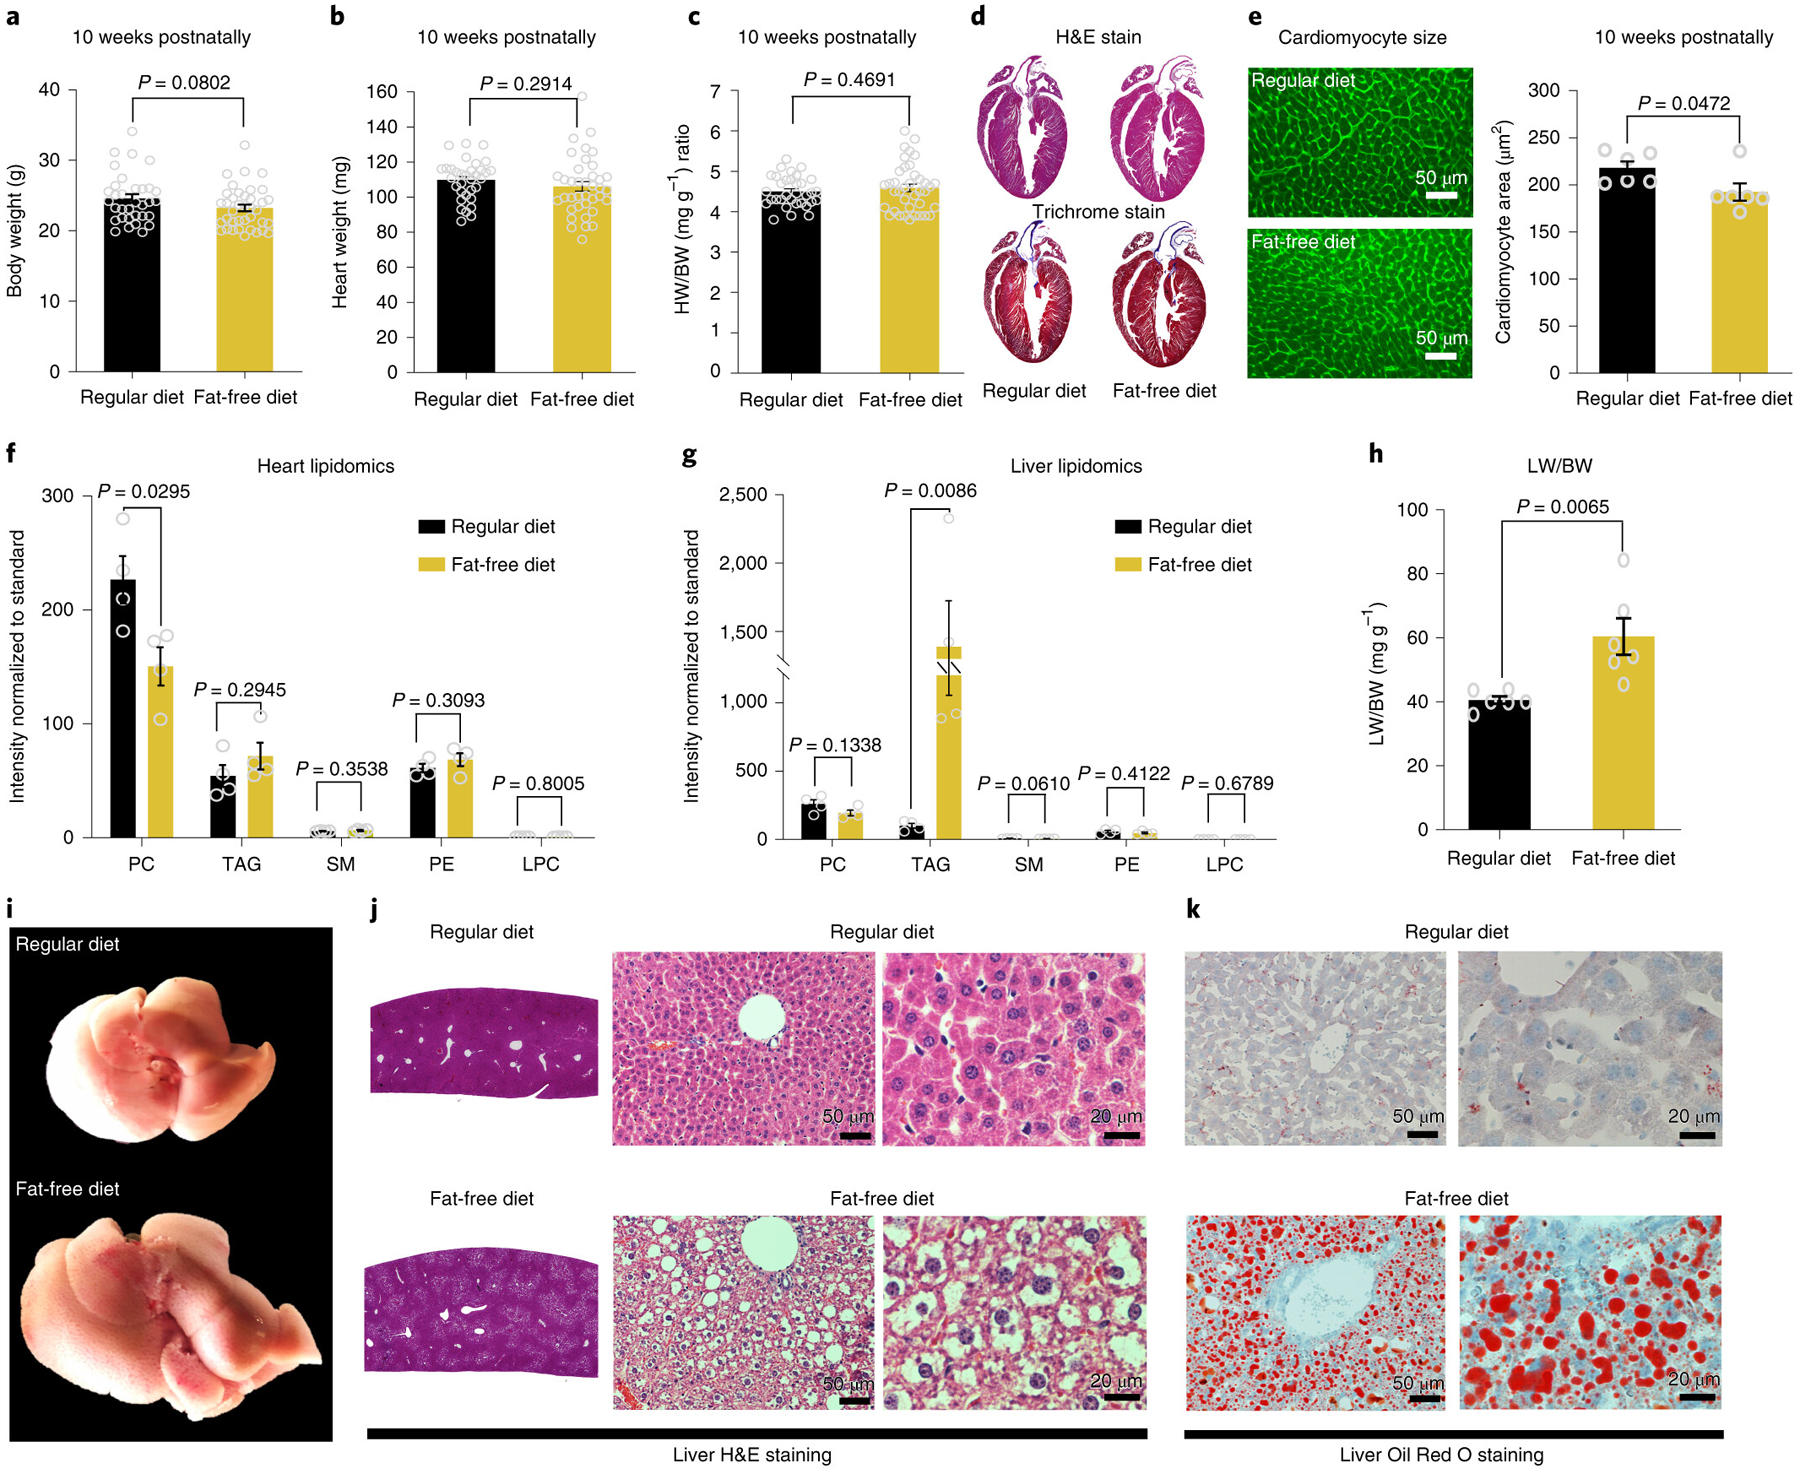
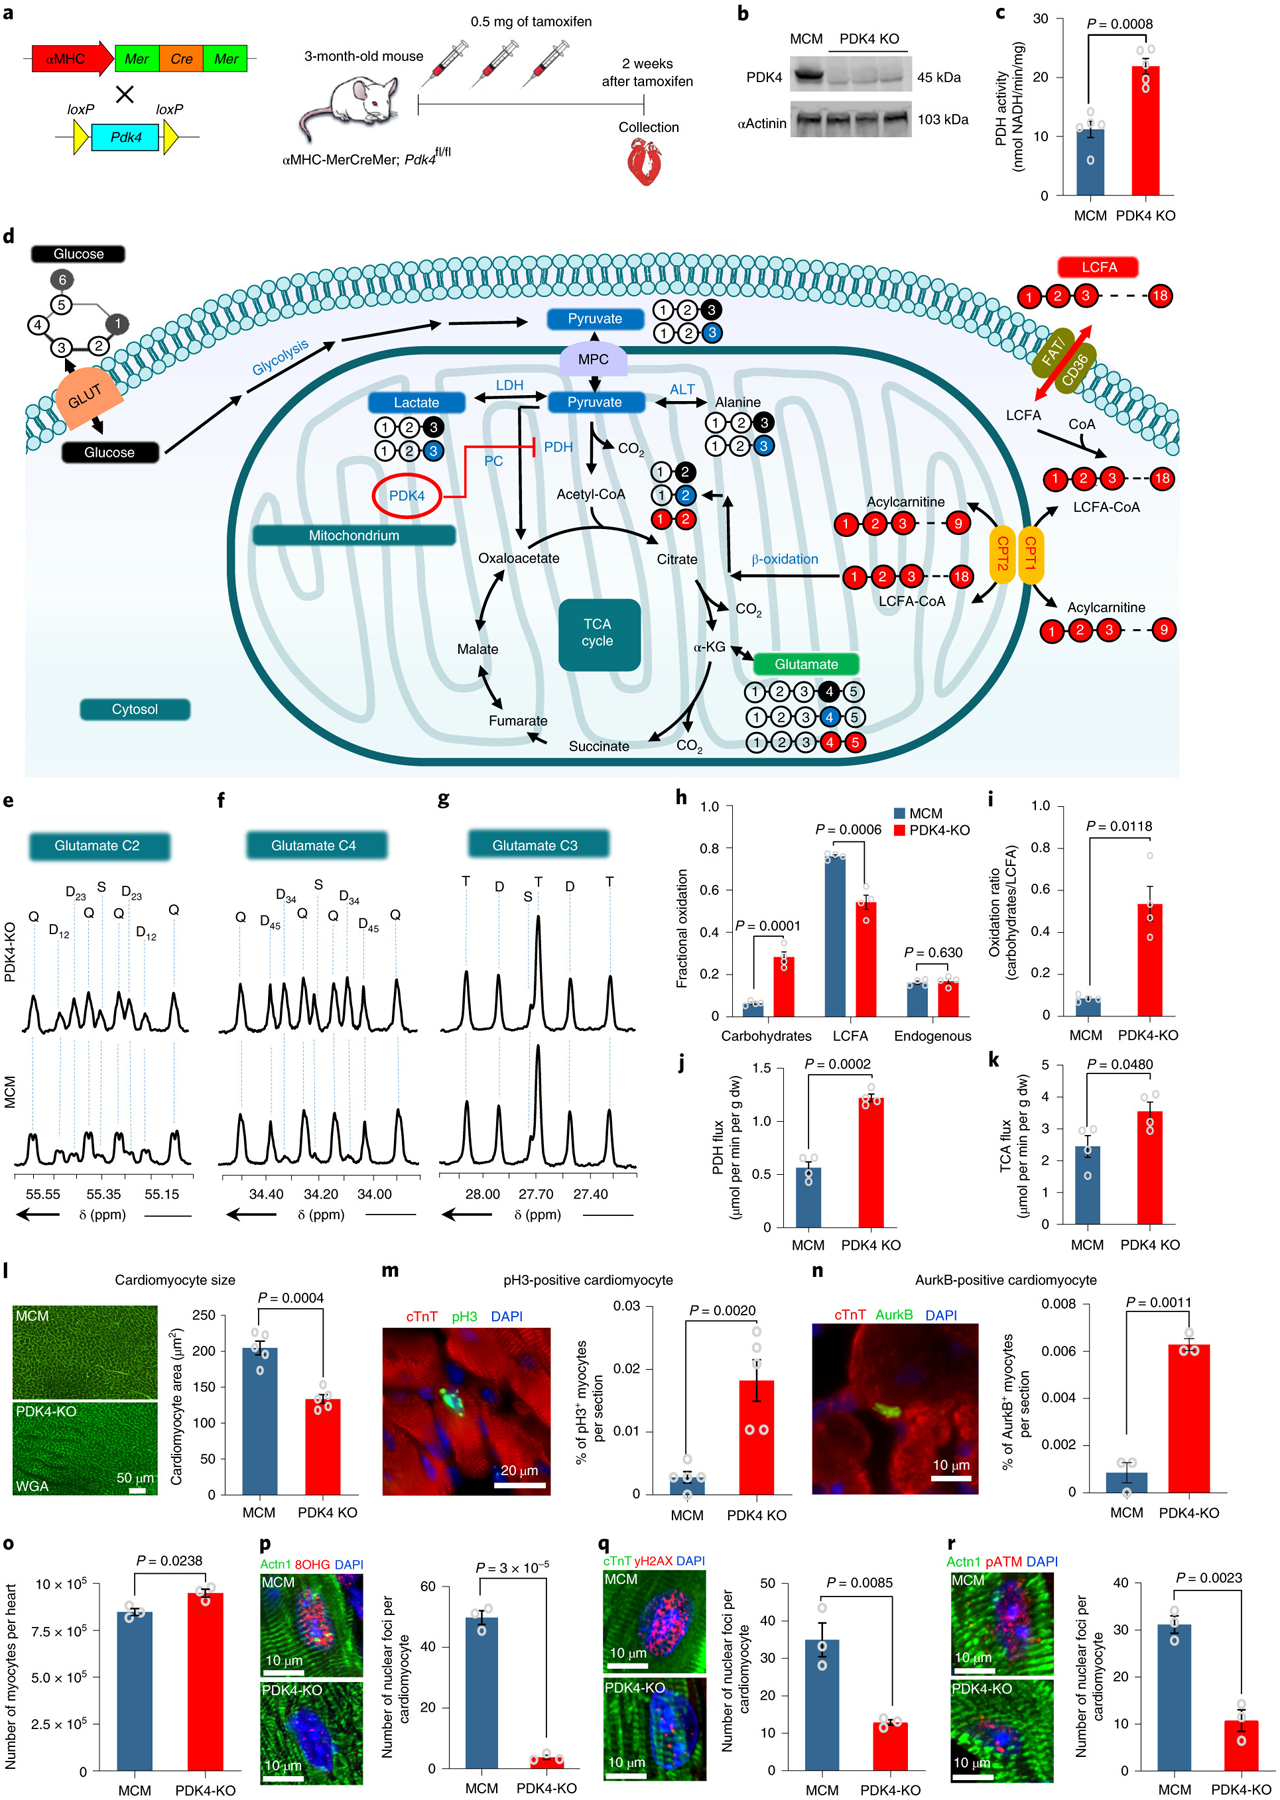
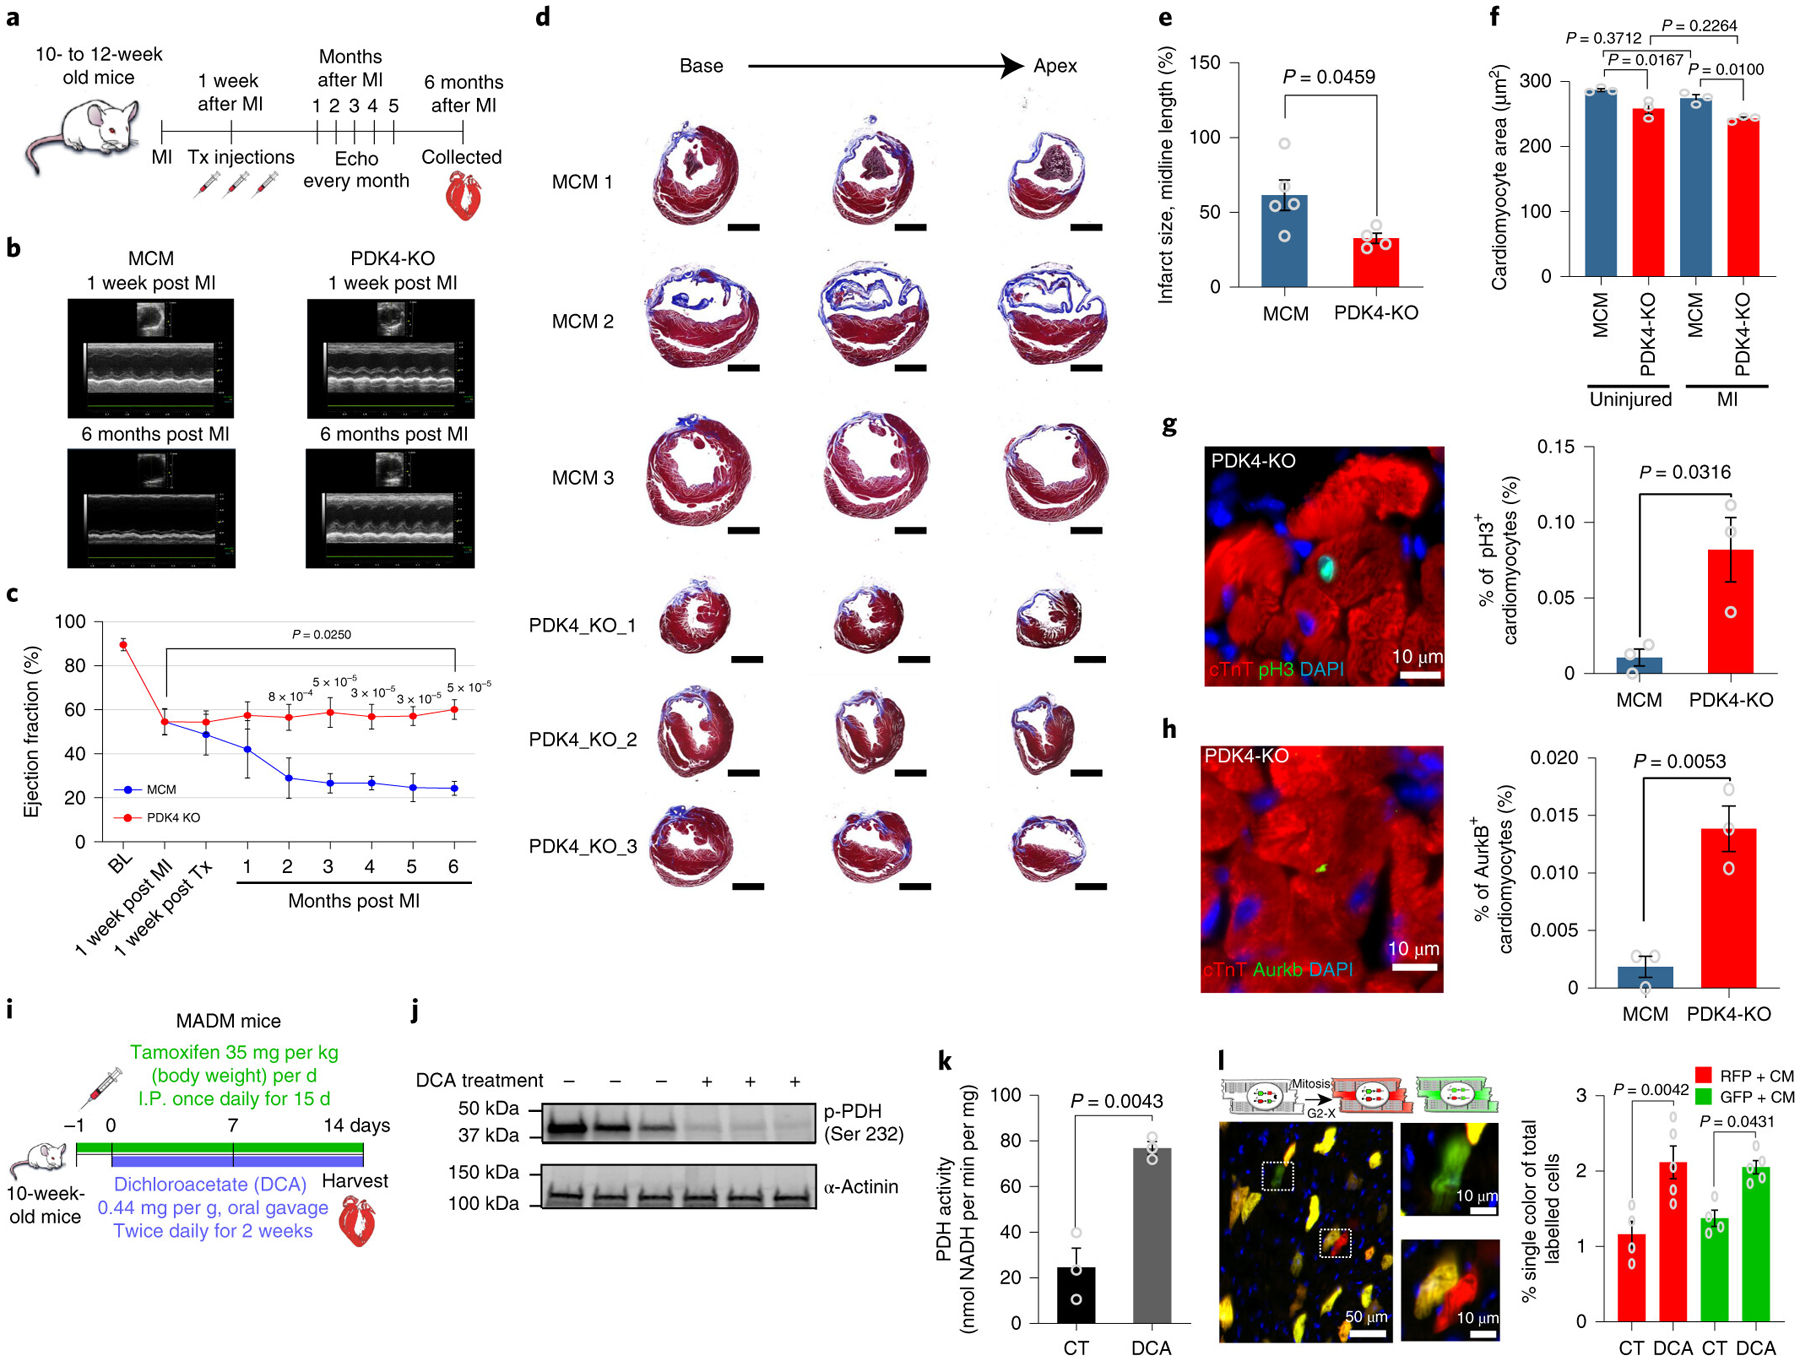
The neonatal mammalian heart is capable of regeneration for a brief window of time after birth. However, this regenerative capacity is lost within the first week of life, which coincides with a postnatal shift from anaerobic glycolysis to mitochondrial oxidative phosphorylation, particularly towards fatty-acid utilization. Despite the energy advantage of fatty-acid beta-oxidation, cardiac mitochondria produce elevated rates of reactive oxygen species when utilizing fatty acids, which is thought to play a role in cardiomyocyte cell-cycle arrest through induction of DNA damage and activation of DNA-damage response (DDR) pathway. Here we show that inhibiting fatty-acid utilization promotes cardiomyocyte proliferation in the postnatatal heart. First, neonatal mice fed fatty-acid deficient milk showed prolongation of the postnatal cardiomyocyte proliferative window, however cell cycle arrest eventually ensued. Next, we generated a tamoxifen-inducible cardiomyocyte-specific, pyruvate dehydrogenase kinase 4 (PDK4) knockout mouse model to selectively enhance oxidation of glycolytically derived pyruvate in cardiomyocytes. Conditional PDK4 deletion resulted in an increase in pyruvate dehydrogenase activity and consequently an increase in glucose relative to fatty-acid oxidation. Loss of PDK4 also resulted in decreased cardiomyocyte size, decreased DNA damage and expression of DDR markers and an increase in cardiomyocyte proliferation. Following myocardial infarction, inducible deletion of PDK4 improved left ventricular function and decreased remodelling. Collectively, inhibition of fatty-acid utilization in cardiomyocytes promotes proliferation, and may be a viable target for cardiac regenerative therapies.


Conflict of interest statement

Competing interests None of the authors have competing interests

Figures

Extended Data Fig. 1
Extended Data Fig. 1. Quantitative mass spectrometry analysis of fatty acids biosynthesis liver enzymes
a, Schematic view of cholesterol and triglyceride biosynthesis pathways. Red, green and gray colors represent the upregulated, downregulated and unchanged protein expression, respectively. The analysis shows a significant increase in the enzymes involved in the synthesis of saturated fatty acids and triglycerides in FDM compare to CM mice. Enzymes involved in cholesterol biosynthesis were downregulated in the FDM liver. b, Table showing the average, fold change and p-value of the hepatic enzymes involved in fatty acid biosynthesis, identified by quantitative mass spectrometry between FDM and CM mice (n=4 biologically independent mice per group). CM, control milk group; FDM, fat deficient milk group. Statistical analysis was performed with two-tailed Student’s t-test.
Extended Data Fig. 2
Extended Data Fig. 2. Serum lipids and blood glucose measurements.
a, At 12 days postnatally, beyond lactation, pups were exposed to a regular diet or Fat Free Diet. Samples were collected at 10 weeks postnatally. Data in b-f represent the blood glucose, total cholesterol, triglycerides, HDL cholesterol or LDL cholesterol measurements, respectively. (n=7 biologically independent mice per group) Data presented as the mean±s.e.m. Statistical analysis was analyzed with two-tailed Student’s t-test: NS, not significant
Extended Data Fig. 3
Extended Data Fig. 3. RNA-seq analysis of PDK4 KO and Control hearts.
a, Heat-map of all dysregulated genes. Blue and yellow colors represent upregulated and downregulated genes, respectively (n=5 biologically independent mice for control and n=4 biologically independent mice for PDK4 KO group). b, Scatter plot showing the Fragments Per Kilobase of transcript, per Million mapped reads (FPKM) in control and PDK4 KO group (n=5 biologically independent mice for control and n=4 biologically independent mice for PDK4 KO). c, Volcano plot of the log of fold change dysregulated genes between Control and PDK4 KO group. (n=5 biologically independent mice for control and n=4 biologically independent mice for PDK4 KO). Statistic analysis was performed by two-tailed F-test for differential gene expression analysis. d, Ontology analysis performed using DAVID Functional Annotation Tool. Statistics analysis was performed by hypergeometric test. e, heat maps showing a number of dysregulated pathways, including DNA replication, lipid metabolic process, carbohydrate metabolic process, cell cycle and cell growth. Red and green colors represent upregulated and downregulated genes, respectively (n=5 biologically independent mice for control and n=4 biologically independent mice for PDK4 KO). CT: Control
Extended Data Fig. 4
Extended Data Fig. 4. Timeline of PDK4 deletion in the inducible model.
Western blot of PDK4 shows elimination of the protein as early as 4 days following the first tamoxifen injection.
Extended Data Fig. 5
Extended Data Fig. 5. Echocardiography parameters
a, left ventricular internal dimension in diastole (LVIDd); b, left ventricular internal dimension in systole (LVIDs), echocardiogram measurements, comparing PDK4 KO and the control αMHC-MerCreMer (MCM) at different time points (n=5 biologically independent mice per group). Data are represented as the mean±s.d. Analyses were performed by unpaired two-tailed Student’s t-test to compare MCM vs PDK4 KO. Paired two-tailed Student’s t-test was used to compare two time points within the same mouse (6 months post MI versus 1 week post MI). c, LVDd; d, LVIDs echocardiogram measurements, comparing uninjured versus myocardial infarction (MI) MCM and PDK4 KO groups (n=4 biologically independent mice for uninjured and n=5 biologically independent mice for MI groups). Data are represented as the mean±s.e.m. Analyses were performed by Two-way ANOVA followed by Tukey’s multiple comparisons test, with individual variance computed for each comparison. ns, not significant. e, Trichrome staining of control MCM and PDK4 KO uninjured hearts, 6 months post Tamoxifen injection. Images are representative of three independently performed experiments, with similar results.
Fig. 1:
Fig. 1:. Dietary fatty acid deficiency from birth results in a pronounced prolongation of the postnatal window of cardiomyocyte proliferation.
a, Schematic view of the genetic mouse model of PERK deletion specifically in mammary epithelial cells. The Cre+/PERKf/f mice produce milk deficient in fatty acids. As a control, we used the Cre/PERKf/f mice, which produce milk with normal levels of fatty acids. b, At 12 days postnatally, beyond lactation, pups were exposed to a regular diet or Fat Free Diet. Animals were sacrificed at 21 days or 10 weeks postnatally. c, Body weight (BW) measurements show no significant difference between FDM (n=24 biologically independent mice) and CM (n=25 biologically independent mice). d, Heart weight (HW) measurements showing no difference between groups; n=24 biologically independent mice for FDM group and n=25 biologically independent mice for CM group. e, Heart weight to body weight (HW/BW) ratio shows a significant increase in FDM (n=24 biologically independent mice) compared to CM (n=25 biologically independent mice). f, WGA staining shows a significant decrease in cardiomyocyte cell size measurement in FDM compare to CM (n=3 biologically independent mice per group). g, Anti-pH3 and anti-cTnT co-immunostaining showing a significant increase in the cardiomyocyte mitosis marker in the FDM group (n=3 biologically independent mice per group). h, Anti-Aurora B kinase and anti-cTnT co-immunostaining shows a significant increase in the cardiomyocyte cytokinesis marker in the FDM compared to the CM group (n=3 biologically independent mice per group). i, A complete dissociation of cardiomyocytes by collagenases indicated a significant increase in the total number of cardiomyocytes in FDM group compared to CM (n = 4 biologically independent mice). j, Schematic view of 4-hydroxytamoxifen (4-OHT) administration and timeline experiment in MADM; MCM mice. k, (Upper) Schematic representation of MADM; MCM recombination in a parent cardiomyocyte leading to RFP+ and GFP+ single-labeled daughter cardiomyocytes. (Lower) Example of RFP+ and GFP+ single-labeled cardiomyocyte. l, Frequency of single-labeled cardiomyocytes per heart section are higher in the FDM group compared with the CM group (n=4 biologically independent mice per group). Data in bar graphs are presented as mean±s.e.m. Statistical analysis was performed using a two-tailed Student’s t-test: NS, not significant CM, control milk group; FDM, fat deficient milk group.
Fig. 2:
Fig. 2:. Chronic exposure to fat free diet induces liver steatosis in adult mice.
a, Body weight (BW); b, Heart weight (HW); c, HW/BW ratio measurements showing no difference between regular diet (n=33 biologically independent mice) and fat free diet (n=38 biologically independent mice). d, Heart sections stained with H&E or trichrome show no clear difference between regular diet and fat free diet. Images are representative of four independently performed experiments with similar results. e, WGA staining shows significant difference in cardiomyocyte cell size measurements in fat free diet compare to regular diet (n=6 biologically independent mice per group). f, Heart lipidomics profile shows a significant decrease in PC in fat free diet compare to regular diet group (n=4 biologically independent mice per group). g, Liver lipidomics profile shows a significant increase in TAG in fat free diet compared to the regular diet group (n=4 biologically independent mice per group). h, Liver weight to body weight (LW/BW) ratio shows a significant increase in the fat free diet liver weight compared to regular diet (n=6 biologically independent mice per group). i, Representative image of the whole liver shows a marked increase in liver size in fat free diet compared to regular diet group. j, Representative image of a histological liver section stained with H&E showing marked macrovesicular steatosis with no signal of inflammatory cell accumulation. k, Liver cryosection stained with Oil Red O showing massive positive staining lipid droplets. Data in i-k are representative of four independently performed experiments with similar results. Data in bar graphs are presented as mean±s.e.m. Statistical analysis was performed using a two-tailed Student’s t-test: NS, not significant. LPC, lysophosphatidylcholine; PC, phosphatidylcholine; PE, phosphatidylethanolamine; SM, sphingomyelin; TAG, triacylglycerol.
Fig. 3:
Fig. 3:. Conditional PDK4 deletion results in a marked shift in myocardial substrate utilization, decreased DNA damage, and increased proliferation in adult cardiomyocytes.
a, Schematic view of the inducible knockout αMHC-MerCreMer cross with PDK4f/f . b, Western Blot for the PDK4 protein shows noticeable depletion in the PDK4 protein expression in the PDK4 KO group compared to the control αMHC-MerCreMer (MCM) hearts. The experiment was repeated twice, with similar results. c, Pyruvate Dehydrogenase (PDH) activity (n=5 biologically independent mice per group). d, A scheme showing the generation of glutamate multiplets from glucose, lactate-pyruvate, and LCFA. Note that 13C labeling for glucose, lactate-pyruvate, and LCFA is indicated as black, blue and red balls, respectively. e, Glutamate C-2 (55.35 ppm) f, Glutamate C-4 (34.20 ppm) and g, Glutamate C-3 (27.60 ppm) spectra. The letters S, D, T, and Q refer to a singlet, doublet (with the relevant J-coupled spins), triplet (a degenerate doublet of doublets) or quartet (or doublet of doublets), respectively. h, Fractional oxidation (n=4 biologically independent mice per group). i, Carbohydrates to LCFA oxidation ratios (n=4 biologically independent mice per group). j, PDH flux and k. TCA flux (n=4 biologically independent mice per group). l, WGA staining shows a significant decrease in cardiomyocyte cell size measurement in PDK4 KO mice compared to the control (n=5 biologically independent mice per group). m, Anti-pH3 and anti-cTnT co-immunostaining shows a significant increase in the cardiomyocyte mitosis marker in cardiomyocyte-specific PDK4 KO mice (n=5 biologically independent mice per group). n, Anti-Aurora B kinase and anti-cTnT co-immunostaining shows a significant increase in cardiomyocyte cytokinesis marker in PDK4 KO compared to the control group (n=3 biologically independent mice per group). o, Quantification of total number of isolated cardiomyocytes by collagenase digestion showing a significant increase in PDK4 KO group at 4 weeks after the first tamoxifen injection (n=3 biologically independent mice per group). Data in p, q and r represent the co-immunostaining with anti-8-hydroxyguanosine (8OHG), anti-γH2AX and anti-pATM antibodies, respectively. There are significant decreases in oxidative DNA damage and the DNA damage response pathway in cardiomyocytes from PDK4 KO hearts (n=3 biologically independent mice per group). Data are presented as the mean±s.e.m. Statistical analysis was performed with two-tailed Student’s t-test: NS, not significant. Actn1, Alpha actinin-1, dw, dry weight; LCFA, long chain fatty acids; MCM: αMHC-MerCreMer mice.
Fig. 4:
Fig. 4:. PDK4 KO hearts show a higher LVEF accompanied by a remarkable decrease in LV dilatation and remodeling, as well as increase cardiomyocyte proliferation compared to control hearts.
a, One week after MI induced by LAD ligation, mice were injected with Tamoxifen. The cardiac function was assessed every month by echocardiography. Hearts were harvested 6 months after MI and submitted to histology analysis. b, Representative echocardiography images comparing control MCM and PDK4 KO hearts 1 week and 6 months post-MI. c, Echocardiography analysis of LVEF showing a higher LVEF post-MI in PDK4 KO (n=5 biologically independent mice) compared to control MCM (n=5 biologically independent mice). Data are represented as the mean±s.d. Analyses were performed by unpaired two-tailed Student’s t-test. Additionally, we observed significant improvement of the LVEF 6 months post-MI compared to 1 week post-MI. Statistical analysis was performed using paired two-tailed Student’s t-test. d, Trichrome staining of hearts, 6 months post-MI, shows a marked decrease in LV dilatation and remodeling of PDK4 KO compared to control MCM hearts. The experiment was repeated four times, with similar results e, Infarct size quantification showing significantly smaller fibrotic scars in PDK4 KO group (n=4 biologically independent mice) compared to control MCM (n=5 biologically independent mice). f, WGA staining shows a significant decrease in cardiomyocyte cell size measurement in PDK4 KO compared to controls (n=3 biologically independent mice per group). g, Anti-pH3 and anti-cTnT co-immunostaining showing a significant increase in the percentage of pH3+ cardiomyocytes in the PDK4 KO group compared to control MCM (n=3 biologically independent mice per group). h, Anti-Aurora B kinase and anti-cTnT co-immunostaining shows a significant increase in the cardiomyocyte cytokinesis marker in the PDK4 KO compared to control MCM group (n=3 biologically independent mice per group). i, Schematic view of the tamoxifen and DCA administration in 10 weeks old MADM; MCM mice. j, Western blot for phopho-PDH Ser232 showing clear depletion of the phosphorylated PDH in the mice group treated with DCA (n=3 biologically independent mice per group). k, Pyruvate dehydrogenase (PDH) activity (n=3 biologically independent mice per group). l, Frequency of single-labeled cardiomyocytes per heart section, showing significant increase in DCA treated mice (n=5 biologically independent mice) compared to control (n=4 biologically independent mice). Data present in e-l are represented as the mean±s.e.m. Statistical analysis was performed using a two-tailed Student’s t-test: NS, not significant, BL, baseline; LVEF, left ventricular ejection fraction; MI, Myocardial infarction; DCA: Dichloroacetate; PDH: Pyruvate Dehydrogenase. CM: cardiomyocyte; CT: control; RFP: red fluorescent protein; GFP: green fluorescent protein; MCM: αMHC-MerCreMer.

References

    1. Bergmann O et al. Evidence for cardiomyocyte renewal in humans. Science 324, 98–102 (2009). - PMC - PubMed
    1. Mahmoud AI et al. Meis1 regulates postnatal cardiomyocyte cell cycle arrest. Nature 497, 249–253 (2013). - PMC - PubMed
    1. Porrello ER et al. Transient regenerative potential of the neonatal mouse heart. Science (New York, N.Y 331, 1078–1080 (2011). - PMC - PubMed
    1. Becker RO, Chapin S & Sherry R Regeneration of the ventricular myocardium in amphibians. Nature 248, 145–147 (1974). - PubMed
    1. Oberpriller JO & Oberpriller JC Response of the adult newt ventricle to injury. The Journal of experimental zoology 187, 249–253 (1974). - PubMed

Publication types

MeSH terms