. 2020 Aug 6;79(3):390-405.e7.
doi: 10.1016/j.molcel.2020.06.018. Epub 2020 Jul 2.

Structural Insights into Pseudokinase Domains of Receptor Tyrosine Kinases

Affiliations

Structural Insights into Pseudokinase Domains of Receptor Tyrosine Kinases

Joshua B Sheetz et al. Mol Cell. .

Abstract

Despite their apparent lack of catalytic activity, pseudokinases are essential signaling molecules. Here, we describe the structural and dynamic properties of pseudokinase domains from the Wnt-binding receptor tyrosine kinases (PTK7, ROR1, ROR2, and RYK), which play important roles in development. We determined structures of all pseudokinase domains in this family and found that they share a conserved inactive conformation in their activation loop that resembles the autoinhibited insulin receptor kinase (IRK). They also have inaccessible ATP-binding pockets, occluded by aromatic residues that mimic a cofactor-bound state. Structural comparisons revealed significant domain plasticity and alternative interactions that substitute for absent conserved motifs. The pseudokinases also showed dynamic properties that were strikingly similar to those of IRK. Despite the inaccessible ATP site, screening identified ATP-competitive type-II inhibitors for ROR1. Our results set the stage for an emerging therapeutic modality of "conformational disruptors" to inhibit or modulate non-catalytic functions of pseudokinases deregulated in disease.

Keywords: GZD824; Wnt signaling; cancer; growth factor signaling; ponatinib; protein conformation; pseudokinases; receptor tyrosine kinases; targeted therapies.


Conflict of interest statement

Declaration of Interests The authors declare no competing interests.

Figures

FIGURE 1
FIGURE 1. Pseudokinases retain autoinhibitory interactions of the insulin receptor
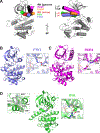
(A) Domain composition of human RTK pseudokinases, with the extracellular region above, and intracellular region below the membrane. Domains are listed in the legend: pseudokinase (red), leucine-rich (L), cysteine-rich (Cys Rich), immunoglobulin (Ig), Frizzled cysteine-rich domain (Fz CRD), Kringle domain (Kr), Sterile Alpha Motif (SAM), and Wnt Inhibitory Factor (WIF) domain (B) Activation loops of pseudokinase domains from PTK7 (slate blue), ROR2 (magenta), and RYK (green) are superimposed on that of IRK (black) in the context of the IRK surface (from PDB: 1IRK). YxxxYY tyrosines in IRK are labeled. The ROR2 structure is chain B of PDB: 3ZZW. (C) ErbB3 activation loop structure (Littlefield et al., 2014) from PDB: 4RIW, superimposed on the 1IRK surface as in (B), with ErbB3 colored orange. Y849 is labelled. (D) Close-up of residues surrounding the ATP binding site for active and inactive IRK (black), PTK7, ROR2, RYK, and ErbB3, colored as above. AMP-PNP is solid when seen in the relevant crystal structure and transparent when not. Residues from the DFG motif (and 4 residues beyond), the β5/αD hinge, and second residue of the VAIK motif are shown (VAVK in IRK, VLVK in PTK7, VAIK in ROR2, AFVK in RYK, VCIK in ErbB3). See also Figure S1 and Table 1.
FIGURE 2
FIGURE 2. Overall structure of pseudokinase domains
(A) Cartoon representing pseudokinase αC helix positions. Two orthogonal views of inactive IRK (1IRK) are shown in grey. Helix αC of IRK, which adopts the ‘out’ position is colored black. Helix αC from ROR2 (3ZZW; magenta) and ErbB3 (4RIW; orange) is also ‘out’. By contrast, αC is ‘in’ for PTK7 (slate blue), RYK (green), and active IRK (1IR3). (B) PTK7 pseudokinase domain. The insert shows the predicted salt bridge between the αC glutamate (E846) and β3 lysine (K830). (C) ROR2 pseudokinase domain (chain B from 3ZZW). Insert shows absence of salt bridge between the αC glutamate (E524) and β3 lysine (K507), and alternate contact between D633 (in the DLG motif) and R528 (in αC). (D) RYK pseudokinase domain. Inserts show hydrophobic side-chains involved in packing between helices αB and αC (left) and connections between the DFG (DNA) motif region and helix αC (right). Interactions between D483 (in DNA motif) and the β3 lysine (K364) and between R488 (close to DNA motif) and αC glutamate (E381) are shown. Vestigial ATP-binding sites are labelled in inserts of (B-D) using a transparent AMP-PNP molecule positioned as in active IRK. See also Figure S2.
FIGURE 3
FIGURE 3. Insights into EphA10 and EphB6 pseudokinases from modeling
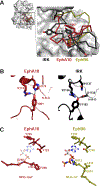
(A) Activation loops in models of the EphA10 (deep red) and EphB6 (olive) pseudokinases, superimposed on that of IRK (black) in the context of the IRK surface (from PDB: 1IRK). Y1162 in IRK and its EphA10 equivalent (Y801) are labeled. (B) Close-up of interactions involving Y801 for EphA10 (left) and Y1162 for IRK (right). Where Y1162 of IRK interacts with D1132 in the HRD motif and R1136 from the end of the catalytic loop, in EphA10 Y801 retains the arginine interaction (with R774), but interacts with a histidine at the very end of the catalytic loop (H775) making up for the lack of an HRD aspartate (replaced by glycine in EphA10). (C) Close-up of residues around the ATP binding sites of EphA10 (left), and EphB6 (right), colored as above. An AMP-PNP molecule is shown – solid when predicted to bind and transparent when not. Residues are shown from the DFG motif (GFG in EphA10, and RLG in EphB6) – and 4 residues beyond – as well as the β5/αD hinge. See also Figure S3.
FIGURE 4
FIGURE 4. Comparison of pseudokinase domain dynamics by HDX
(A) HDX data at 1 minute for unphosphorylated IRK across 73 peptides (represented as short horizontal lines). Lines are colored according to percent exchange at 1 min (using the scale at right). Secondary structure of IRK is shown at top. Data for longer timepoints are plotted in the lower part of the figure, with the x-axis representing the median residue number of the peptide. Locations of the β5/αD hinge, HRD motif, activation loop (A-loop) and YxxxYY motif are noted. Errors represent SD from three independent labeling experiments. (B) Data (1 min) from the upper part of (A) plotted on the (inactive) IRK structure using the same color scheme as in (A). Blue represents less, and red more, exchange. (C) Comparison of HDX data (mean ± SD) for PTK7 (slate blue), ROR2 (magenta), RYK (green) and ROR1 (cyan) pseudokinase domains with data for IRK (grey) at 10 s, 1 min, 10 min, and 2 h. X-axis represents IRK-equivalent median residue number. IRK data are depicted as the range for each point. Errors represent SD from three independent labeling experiments. (D) Variance of ‘exchangeability index’ values – determined as in STAR Methods – for pseudokinases versus IRK (expressed as how many times SD/σ was the IRK value away from the pseudokinase mean), plotted on the inactive IRK structure. A location was assigned no color if within 2σ, but colored black or orange as marked if beyond 2σ (95% confidence). See also Figure S4 and Table S1.
FIGURE 5
FIGURE 5. ROR1 signaling in BaF3 cells
(A) ROR1 and ROR1∆ICR expression in BaF3 stable clones by anti-HA Western blot (with β-tubulin as loading control). (B) BaF3 (parental), BaF3-ROR1 and BaF3-ROR1∆ICR cells were cultured without IL3 or Wnt5a. Cell number was counted using Trypan-blue exclusion at the indicated time points, and plotted (mean ± SD) for 4 independent experiments. Statistical significance is defined: ***p ≤ 0.001; **p ≤ 0.01; *p ≤ 0.05. (C) BaF3, BaF3-ROR1 and BaF3-ROR1∆ICR cells were serum starved overnight, and then treated with recombinant Wnt5a (50 ng/ml) for the indicated times. Cell lysates were immunoblotted with the indicated antibodies. ROR1 or ROR1∆ICR protein levels were determined using anti-HA blotting. A representative of three independent experiments is shown. (D) Proliferation of BaF3 cells expressing different ROR1 variants as noted (in the absence of IL3 or Wnt5a), assessed using the CellTiter-Glow 2.0 Assay 14 days after seeding, and expressed as a fold increase over that seen for parental BaF3 cells. Data are represented as mean values ± SD, for 3 biological repeats. ***p ≤ 0.001. (E) Assessment of stable BaF3 clones expressing (HA-tagged) wild-type ROR1, a variant with the activation loop YxxxYY motif mutated to FxxxFF (Y641F/Y645F/Y646F), and a K506-Amutated variant by Western blotting with anti-HA and β-tubulin as loading control. See also Figure S5.
FIGURE 6
FIGURE 6. Screening for small molecules that bind pseudokinase domains
(A) Summary of DSF-based screen for small molecule binders of Wnt-binding RTK pseudokinases. Hits identified in the ROR1 screen are denoted with horizontal arrows. Compounds screened, and screening results, are listed in Table S2. (B) Chemical structures of the two ROR1-binding ‘hits’ from (A). (C) TM shift as a function of GZD824 concentration binding to purified ROR1 pseudokinase domain (at 2 μM) using DSF, with curve fit as described in STAR Methods. Mean ± SD is shown for three independent experiments. (D) Cellular thermal shift assay (CETSA) showing stabilization of ROR1 in cells upon addition of ponatinib or GZD824. BaF3-ROR1 cells were treated with 10 μM ponatinib or GZD824, and subjected to the noted temperatures as described in STAR Methods. Cell lysates were blotted with anti-HA to assess ROR1 levels, and with anti-β-tubulin as a loading control. (E) CETSA data as in (D), derived from signal quantification of 3 independent experiments (mean ± SD), with curves fit as described in STAR Methods. Band intensities were normalized to the non-heated and non-treated sample for each experiment (set at a value of 1). Control (grey) curve represents heated samples without added inhibitor. See also Figure S6 and Table S2.
FIGURE 7
FIGURE 7. Binding of ponatinib and GZD824 to the ROR1 pseudokinase domain
(A) HDX data for ROR1, comparing exchange differences for 62 peptides with- and without added GZD824 (50 μM) at a representative 1 min timepoint. Color coding is shown in the scale at bottom, red representing increased HDX upon inhibitor binding, and blue a reduction. Data for selected peptides (i, ii, iii, and iv) are detailed in (B). ROR1 secondary structure is shown at top. Values for all time points for three biological replicates are shown in Fig. S7A. (B) HDX data for selected peptides showing HDX with- and without inhibitor across 3 biological replicates (mean ± SD). Data are shown for ponatinib treatment (solid cyan line) and GZD824 treatment (dotted cyan line), for peptides marked in (A): i (from helix αC); ii (from β5/αD hinge); iii (from β1/β2 loop); and iv (from the activation loop). (C) Structure of ponatinib-bound ROR1 pseudokinase, shown in cyan (ponatinib is black), with side-chains involved in ponatinib binding detailed in the zoomed view. (D) Overlay of the ponatinib-bound ROR1 pseudokinase domain on the ROR2 pseudokinase domain, using only the C-lobe to guide overlay. In comparing these structures, DynDom3D (Girdlestone and Hayward, 2016) identified an ~20˚ rotation of the N-lobe with respect to the C-lobe about the yellow near-vertical axis as described in the text. The hinge tyrosine (Y554 in ROR1, Y555 in ROR2) and ROR1 αC helices that interact with ponatinib are labeled, and the displacement of this tyrosine by ponatinib is depicted with a red arrow. See also Figure S7 and Table S1.

References

    1. Ablooglu AJ, Frankel M, Rusinova E, Ross JB, and Kohanski RA (2001). Multiple activation loop conformations and their regulatory properties in the insulin receptor’s kinase domain. J. Biol. Chem. 276, 46933–46940. - PubMed
    1. Adams PD, Afonine PV, Bunkoczi G, Chen VB, Davis IW, Echols N, Headd JJ, Hung LW, Kapral GJ, Grosse-Kunstleve RW, et al. (2010). PHENIX: a comprehensive Python-based system for macromolecular structure solution. Acta Crystallogr. D Biol. Crystallogr. 66, 213–221. - PMC - PubMed
    1. Akbarzadeh S, Wheldon LM, Sweet SM, Talma S, Mardakheh FK, and Heath JK (2008). The deleted in brachydactyly B domain of ROR2 is required for receptor activation by recruitment of Src. PLoS One 3, e1873. - PMC - PubMed
    1. Amin DN, Campbell MR, and Moasser MM (2010). The role of HER3, the unpretentious member of the HER family, in cancer biology and cancer therapeutics. Semin. Cell Dev. Biol. 21, 944–950. - PMC - PubMed
    1. Artim SC, Mendrola JM, and Lemmon MA (2012). Assessing the range of kinase autoinhibition mechanisms in the insulin receptor family. Biochem. J. 448, 213–220. - PMC - PubMed

Publication types

MeSH terms

LinkOut - more resources