. 2020 Jul 9;182(1):177-188.e27.
doi: 10.1016/j.cell.2020.05.029. Epub 2020 Jul 2.

BRICseq Bridges Brain-wide Interregional Connectivity to Neural Activity and Gene Expression in Single Animals

Affiliations

BRICseq Bridges Brain-wide Interregional Connectivity to Neural Activity and Gene Expression in Single Animals

Longwen Huang et al. Cell. .

Erratum in

Abstract

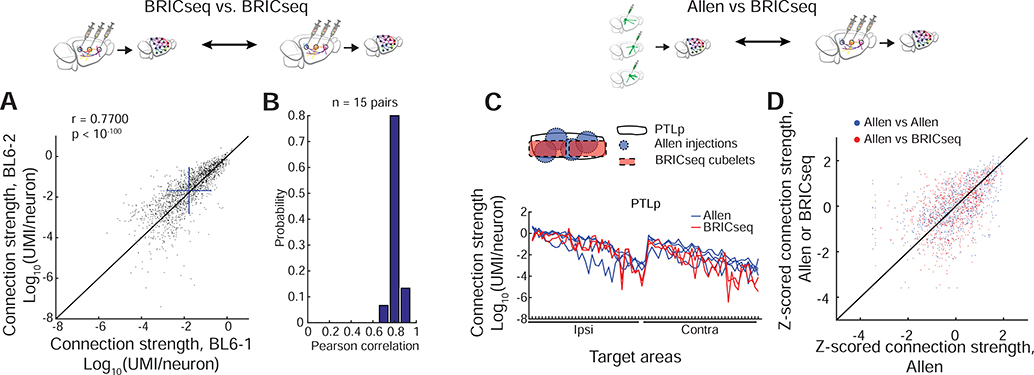
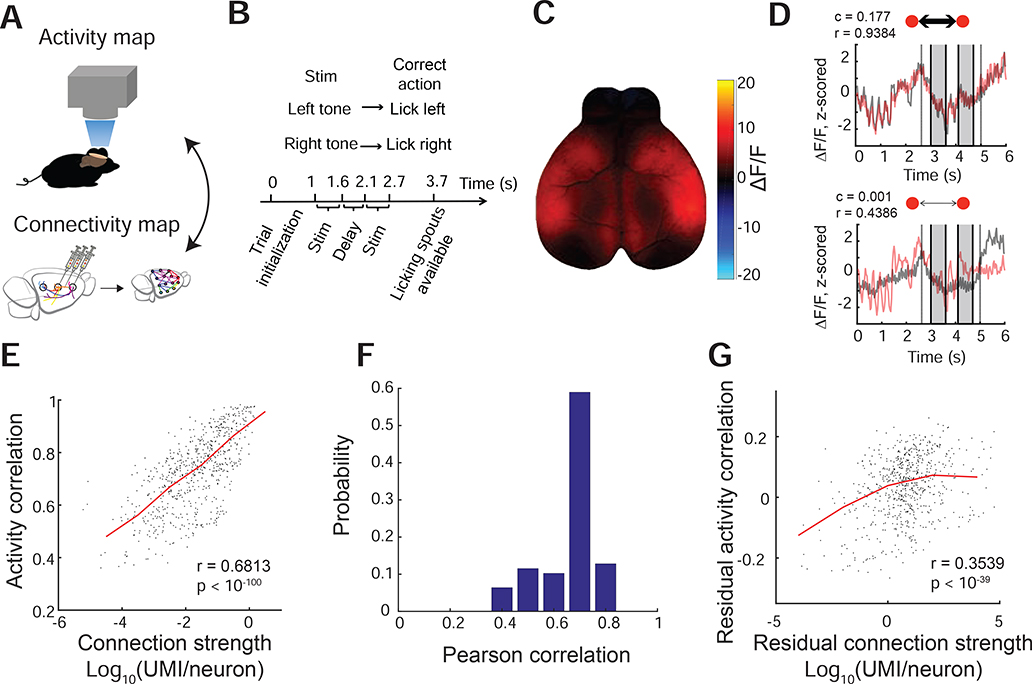
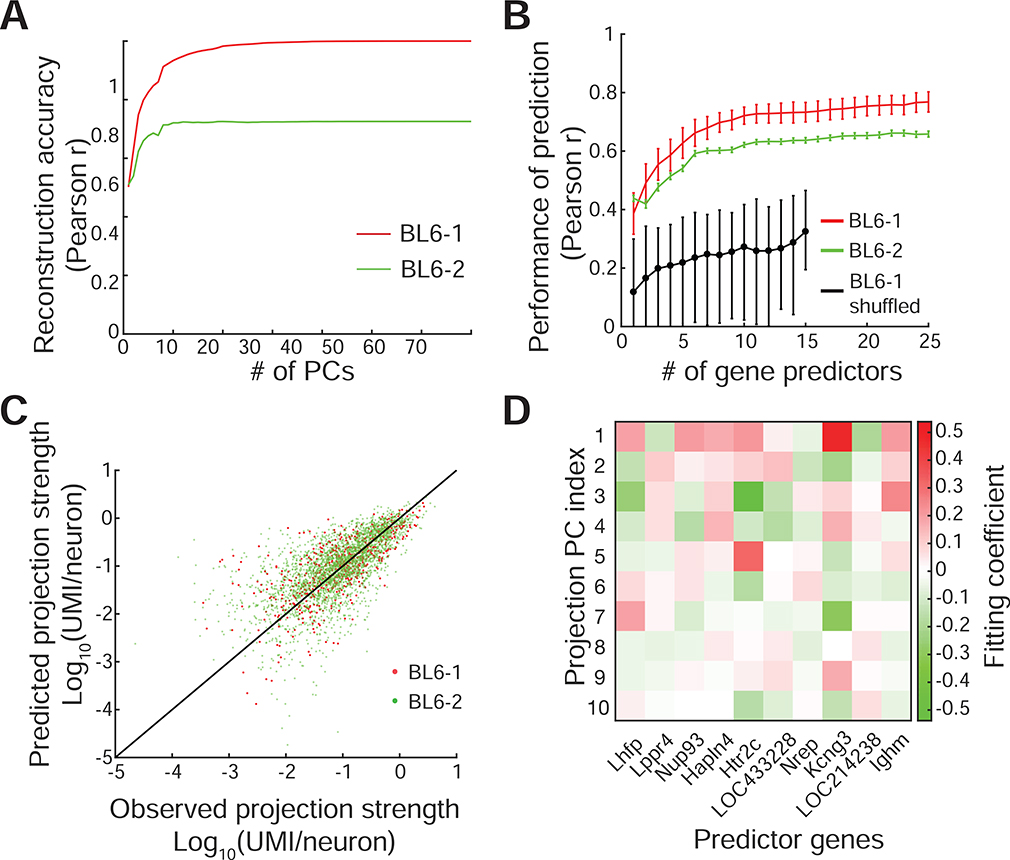
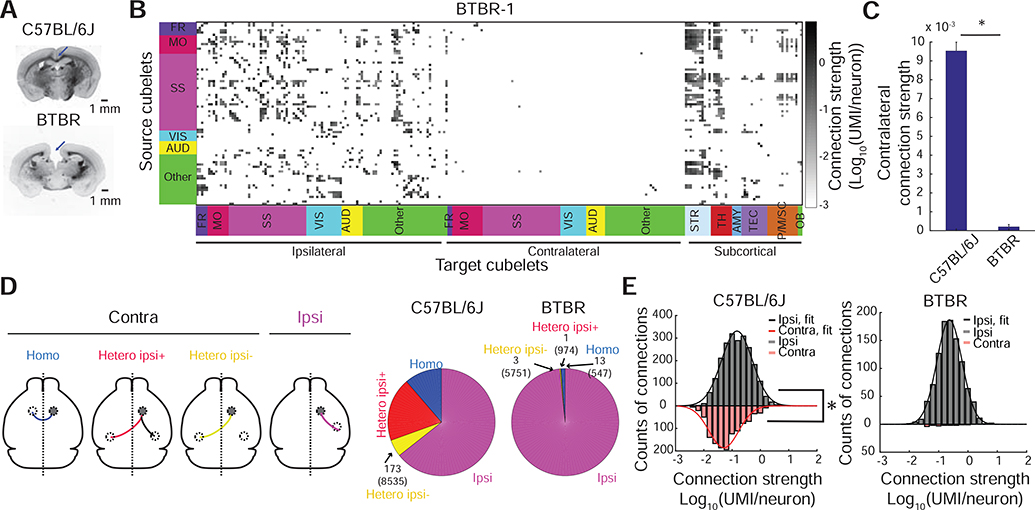
Comprehensive analysis of neuronal networks requires brain-wide measurement of connectivity, activity, and gene expression. Although high-throughput methods are available for mapping brain-wide activity and transcriptomes, comparable methods for mapping region-to-region connectivity remain slow and expensive because they require averaging across hundreds of brains. Here we describe BRICseq (brain-wide individual animal connectome sequencing), which leverages DNA barcoding and sequencing to map connectivity from single individuals in a few weeks and at low cost. Applying BRICseq to the mouse neocortex, we find that region-to-region connectivity provides a simple bridge relating transcriptome to activity: the spatial expression patterns of a few genes predict region-to-region connectivity, and connectivity predicts activity correlations. We also exploited BRICseq to map the mutant BTBR mouse brain, which lacks a corpus callosum, and recapitulated its known connectopathies. BRICseq allows individual laboratories to compare how age, sex, environment, genetics, and species affect neuronal wiring and to integrate these with functional activity and gene expression.

Keywords: BRICseq; MAPseq; connectome; high-throughput sequencing; mesoscale.


Conflict of interest statement

Declaration of Interests A.M.Z. is a founder of Cajal Neuroscience and a member of its scientific advisory board.

Figures

Figure 1.
Figure 1.. Mapping brain-wide cortico-cortical projections with BRICseq.
A. In conventional fluorophore-based tracing, a separate brain is needed for each source area. B. In MAPseq, barcoded Sindbis virus is injected into a single source, and RNA barcodes from target areas of interest are extracted and sequenced. MAPseq multiplexes single neuron projections from a single source area. (BC = barcodes). C. In BRICseq, barcoded Sindbis is injected into multiple source areas. BRICseq multiplexes projections from multiple source areas, each at single neuron resolution. D. In the soma-max strategy for soma calling, the cubelet with the highest abundance of a particular barcode is posited to be the cubelet that contains the source of that barcode. E. Distributions of barcode abundance in source cubelets and target cubelets. F. Experimental validation of the soma-max strategy reveals an error rate <0.5%. G. BRICseq pipeline.
Figure 2.
Figure 2.. Brain-wide corticocortical projectome mapped by BRICseq and its validation.
A,B. Cubelet-to-cubelet connectivity of mouse BL6–1. In B, Each row is a source cubelet, and each column is a target cubelet. Cubelets are assigned to their primary brain area. FR, frontal areas; MO, motor areas; SS, somatosensory areas; VIS, visual areas; AUD, auditory areas; STR, striatum; TH, thalamus; AMY, amygdala; TEC, tectum; P/M/SC, pons/medulla/spinal cord; OB, olfactory bulb.
Figure 3.
Figure 3.. Validation of BRICseq.
A. Reproducibility of brain area-to-brain area connection maps between two mice, BL6–1 and BL6–2. The unity line is in black. Blue bars show mean±S.D. B. The histogram of Pearson correlations between all pairs of C57BL/6J brains. C,D. Connectivity determined by BRICseq agrees with the Allen Connectome Atlas. C, An example comparison of PTLp between the Allen Atlas and BRICseq of mouse BL6–1. D, Comparison of the Allen Connectome with either the Allen Connectome or the whole network determined by BRICseq of mouse BL6–1. Connections strengths were quantified in log scale (connections lower than 10−7 were set to 10−7), and then z-scored. The unity line is in black.
Figure 4.
Figure 4.. BRICseq predicts functional connectivity.
A. BRICseq connectivity compared with cortex-wide Ca2+ imaging. B. The auditory decision making task. C. A single frame example of cortex-wide wide-field calcium imaging in a behaving animal. D. The activity traces of two example pairs of cubelets. c, connection strength (UMI/neuron); r, Pearson correlation. The shaded boxes represent duration of stimulation. The two vertical lines represent the time of trial initialization (left) and licking spout available (right). E. Activity correlation between pairs of cubelets (mouse mSM64 in day E2) vs. reciprocal connection strengths between them (BL6–1). The median line is in red. F. Similar in E, but the activity-connectivity correlation (x axis) was quantified for all pairs of imaging experiments and BRICseq experiments. G. Residual activity correlation vs residual reciprocal connection strengths after removing distance-dependent components.
Figure 5.
Figure 5.. Gene expression patterns predict connectivity determined by BRICseq.
A. PCA-based reconstruction of connectivity, using PCs and coefficients obtained from mouse BL6–1. The correlation coefficient is plotted between the connectivity reconstructed from first n PCs and either mouse BL6–1 (red) or BL6–2 (green). B,C. The performance of linear regression models using selected gene predictors. The linear models were trained using a training set in BL6–1, and then tested using the remaining testing set in BL6–1 as well as in BL6–2. B. The Pearson correlation between observed and predicted connectivity increases with the number of predictor genes. Red, the performance in the testing set in BL6–1. Green, the performance in BL6–2. Black, the null performance with the gene expression data shuffled before feature selection and linear regression. Error bars in red and green represent S.E.M.; error bars in black represent 95% confidence intervals. C. The scatter plot of observed versus predicted connectivity, using 10 gene predictors. Red, the testing set in BL6–1. Green, BL6–2. D. The fitting coefficients of top 10 gene predictors for top 10 connectivity PCs.
Figure 6.
Figure 6.. Comparison of the BTBR and C57BL/6J cortical connectivity.
A. Bright field images of a C57BL/6J brain slice and a BTBR brain slice. Blue arrows indicate absence of the corpus callosum. B. Cubelet-to-cubelet connection matrix showing connection strengths in the BTBR mouse (BTBR-1). C. Quantification of contralateral connection strengths in C57BL/6J and BTBR. *, Mann-Whitney test, p < 10−30, n = 456 source cubelets from 6 C57BL/6J mice, n = 77 source cubelets from 2 BTBR mice. Error bars represent S.E.M. D. Nonzero connections in C57BL/6J (BL6–1) and BTBR (BTBR-1). Numbers inside the parentheses indicate total counts of possible connections. Numbers outside the parentheses indicate total counts of non-zero connections. E. Distributions of ipsilateral/contralateral corticocortical connection strengths in C57BL/6J (BL6–1) and BTBR (BTBR-1). *, p < 10−69, Kolmogorov-Smirnov test.
Figure 7.
Figure 7.. Topological properties of the ipsilateral cortical network.
A,B. Abundance of 2-node and 3-node motifs in cortical network in C57BL/6J (BL6–1) compared to randomly generated networks. *, p < 0.001. C, Sorted cubelet-to-cubelet connection matrix based on modules in BL6–1. D. Connection-based modules in C57BL/6J (BL6–1). The same colors denote the same modules in C and D. The outlines of gross brain areas defined in Allen atlas are overlaid on top of D. The names of cortical areas based on the Allen atlas are shown in Figure S7O.

Comment in

  • Connectomics in high throughput.
    Vogt N. Vogt N. Nat Methods. 2020 Sep;17(9):873. doi: 10.1038/s41592-020-0948-z. Nat Methods. 2020. PMID: 32873982 No abstract available.

References

    1. Abdeladim L, Matho KS, Clavreul S, Mahou P, Sintes J-M, Solinas, Xavier Arganda-Carreras I, Turney SG, Lichtman JW, Chessel A, Bemelmans, Alexis-Pierre Loulier K, et al. (2019). Multicolor multiscale brain imaging with chromatic multiphoton serial microscopy. Nat Commun 10, in press. - PMC - PubMed
    1. Banerjee A, Phelps SM, and Long MA (2019). Singing mice. Curr. Biol 29, R190–R191. - PubMed
    1. Bedford NL, and Hoekstra HE (2015). Peromyscus mice as a model for studying natural variation. Elife 4. - PMC - PubMed
    1. Bock DD, Lee WCA, Kerlin AM, Andermann ML, Hood G, Wetzel AW, Yurgenson S, Soucy ER, Kim HS, and Reid RC (2011). Network anatomy and in vivo physiology of visual cortical neurons. Nature 471, 177–184. - PMC - PubMed
    1. Bohland JW, Wu C, Barbas H, Bokil H, Bota M, Breiter HC, Cline HT, Doyle JC, Freed PJ, Greenspan RJ, et al. (2009). A proposal for a coordinated effort for the determination of brainwide neuroanatomical connectivity in model organisms at a mesoscopic scale. PLoS Comput. Biol 5. - PMC - PubMed

Publication types