. 2020 Jul 2;27(1):35-49.e6.
doi: 10.1016/j.stem.2020.06.004.

A Multiplex Human Pluripotent Stem Cell Platform Defines Molecular and Functional Subclasses of Autism-Related Genes

Affiliations

A Multiplex Human Pluripotent Stem Cell Platform Defines Molecular and Functional Subclasses of Autism-Related Genes

Gustav Y Cederquist et al. Cell Stem Cell. .

Abstract

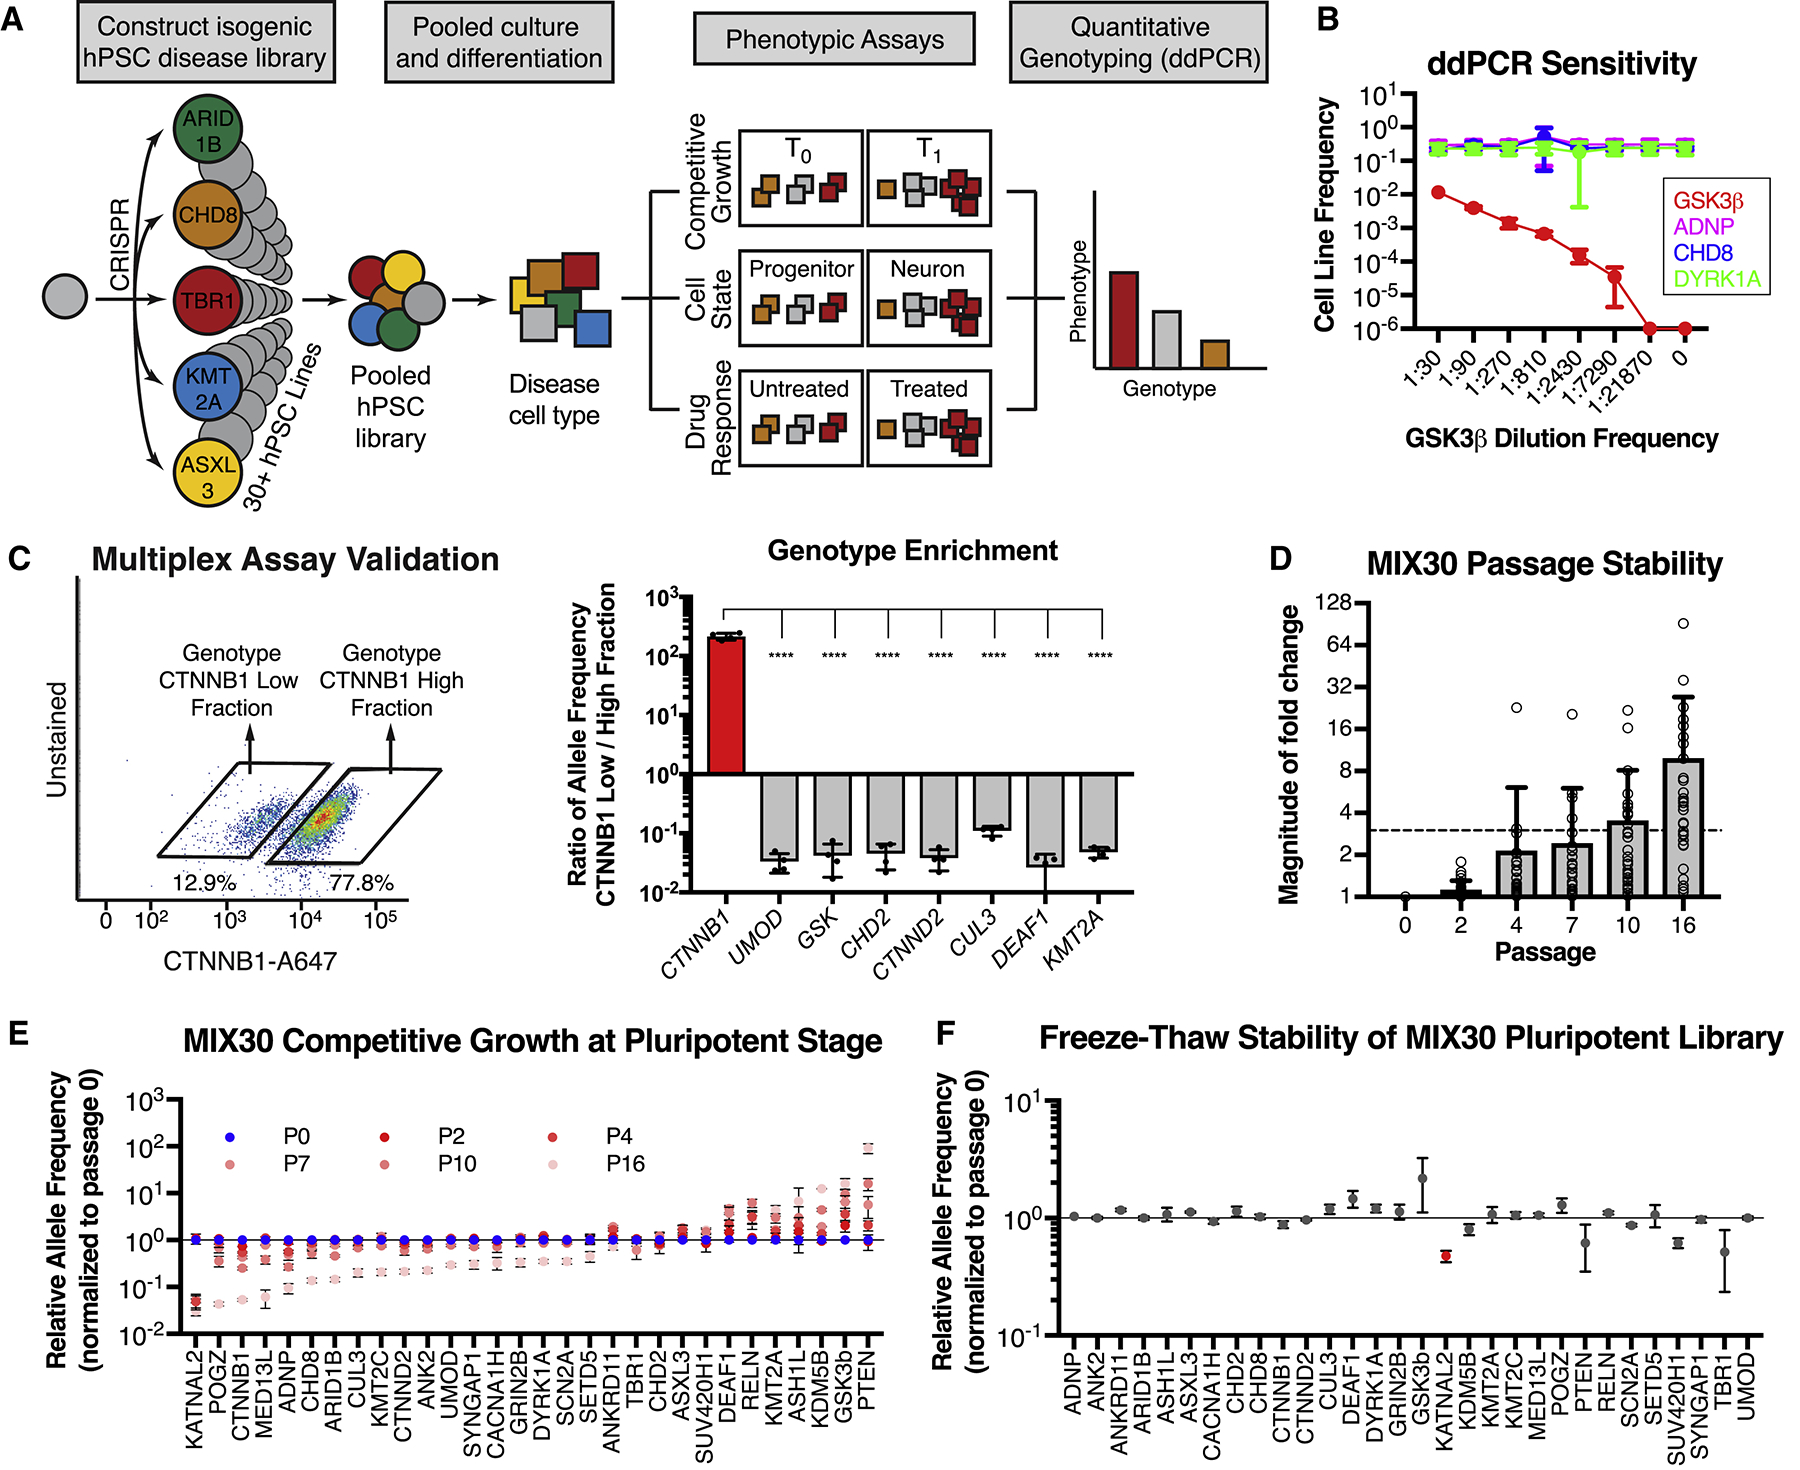
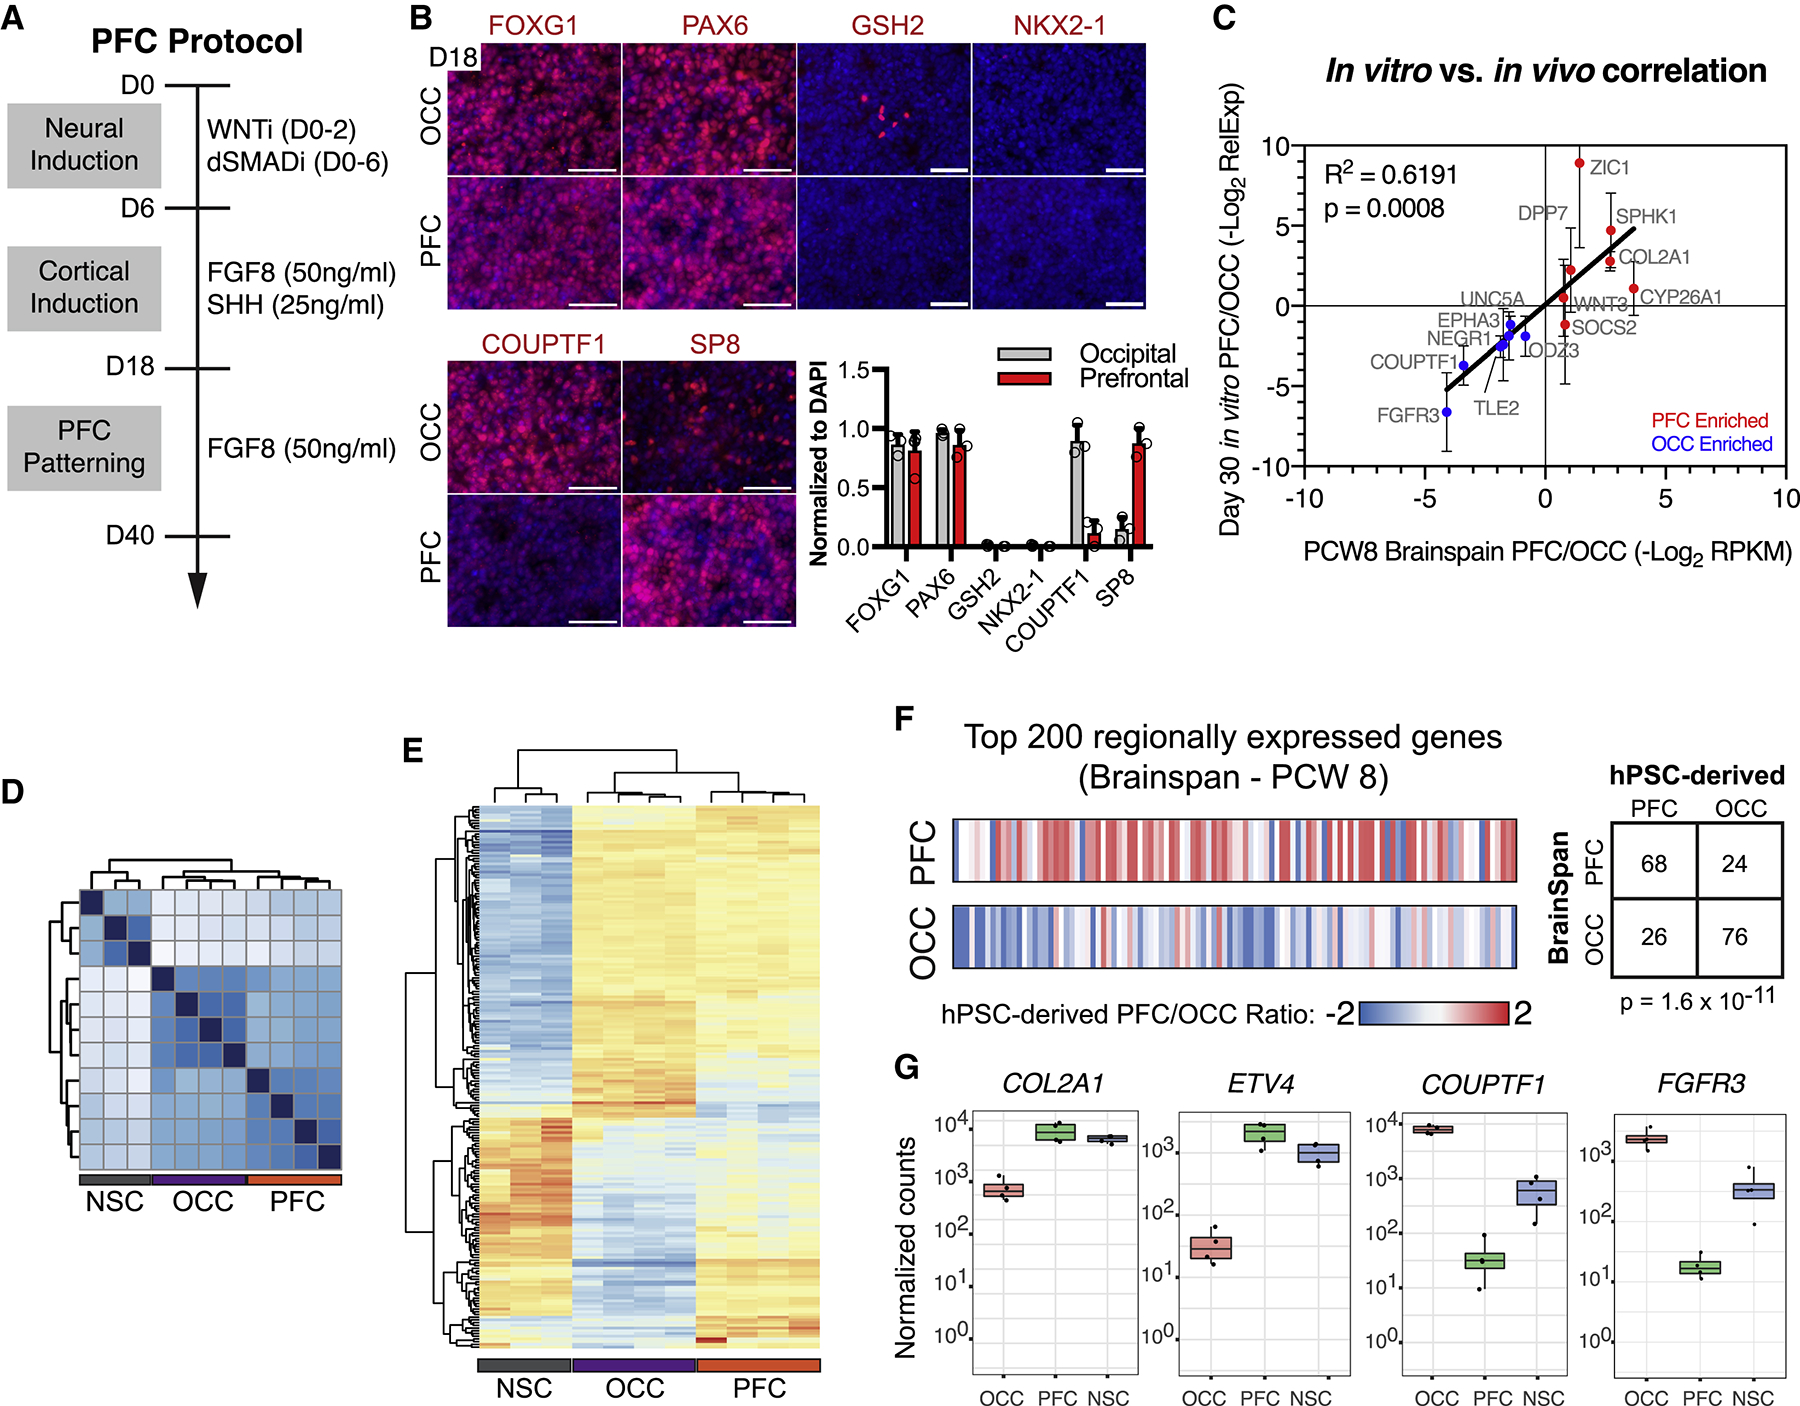
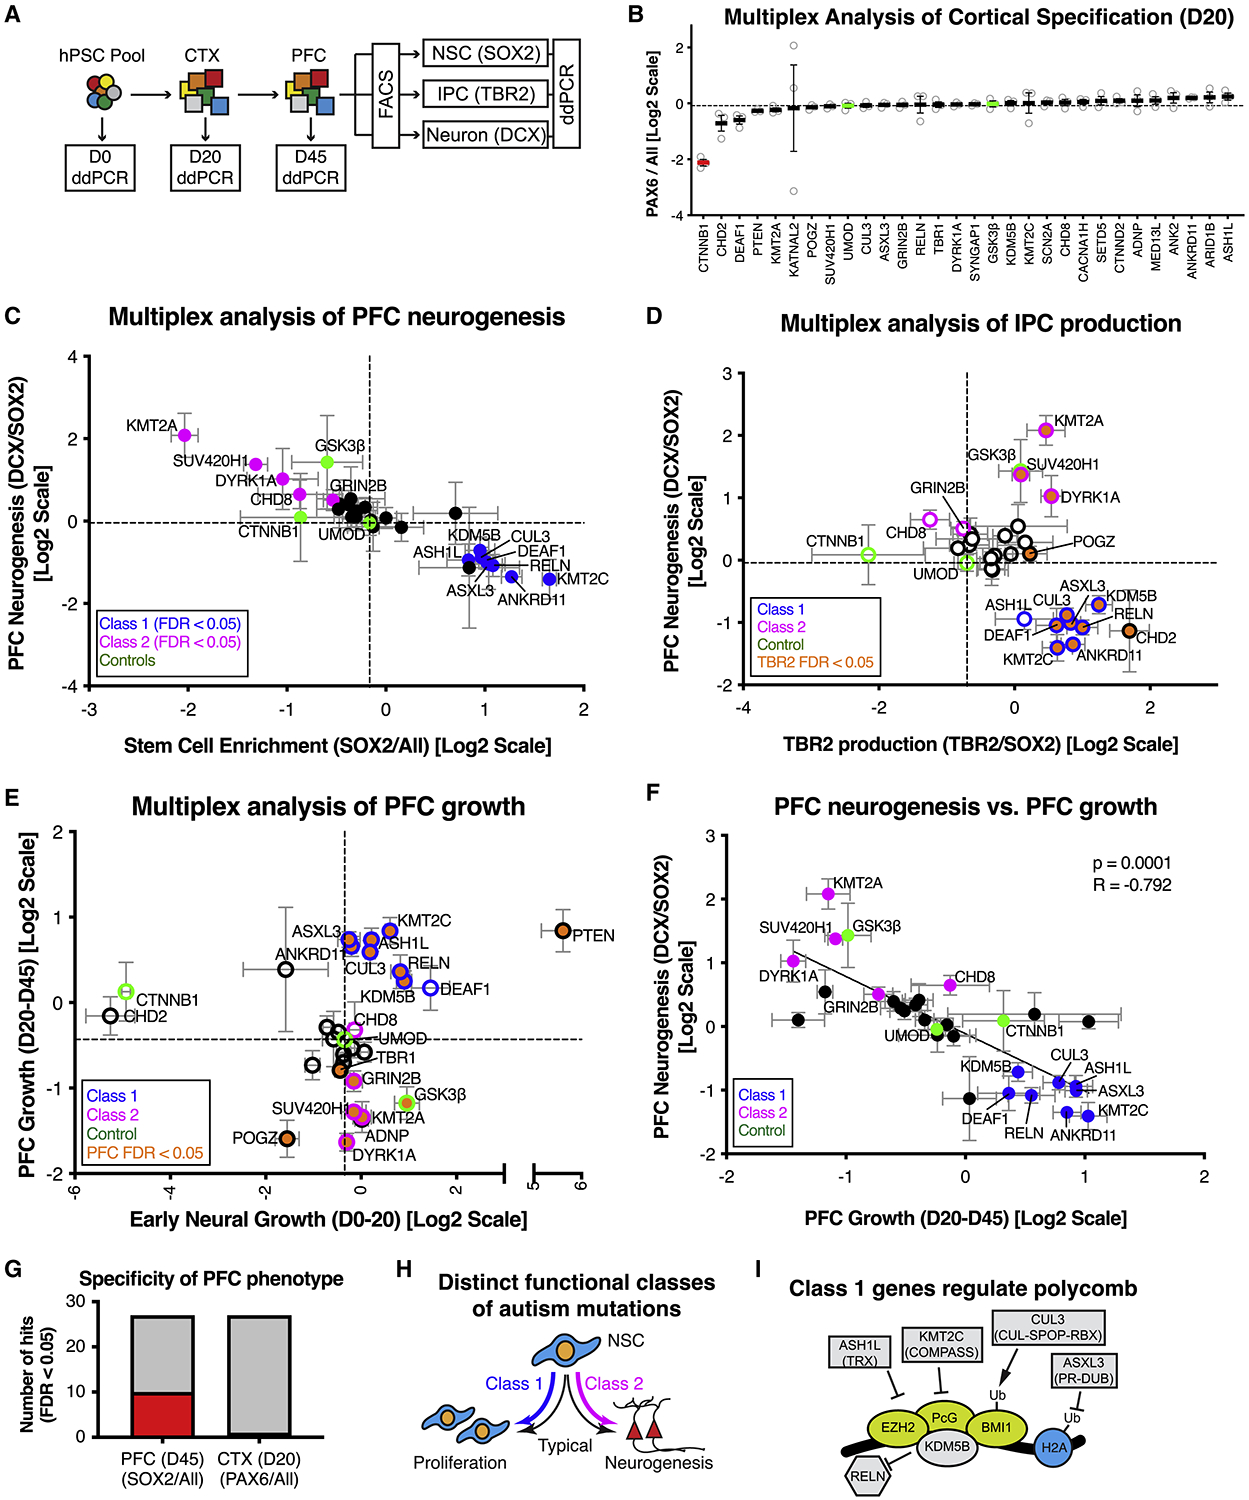
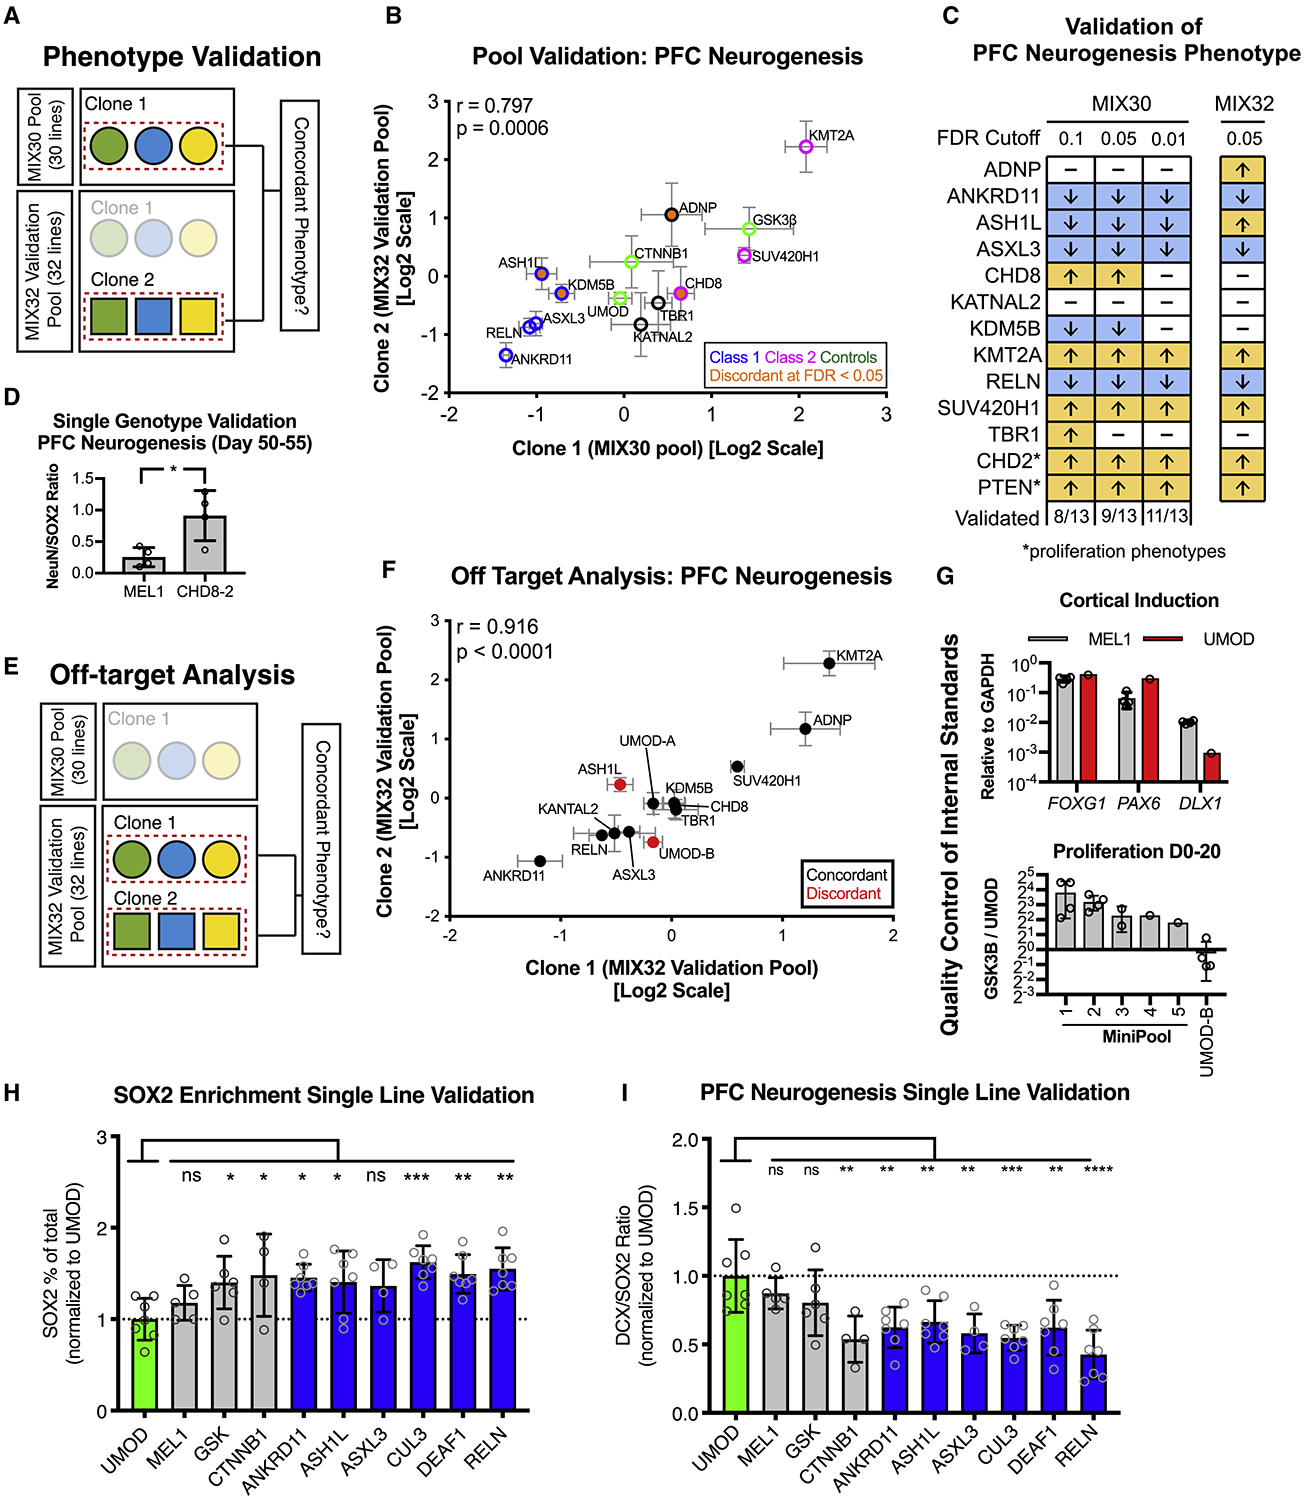
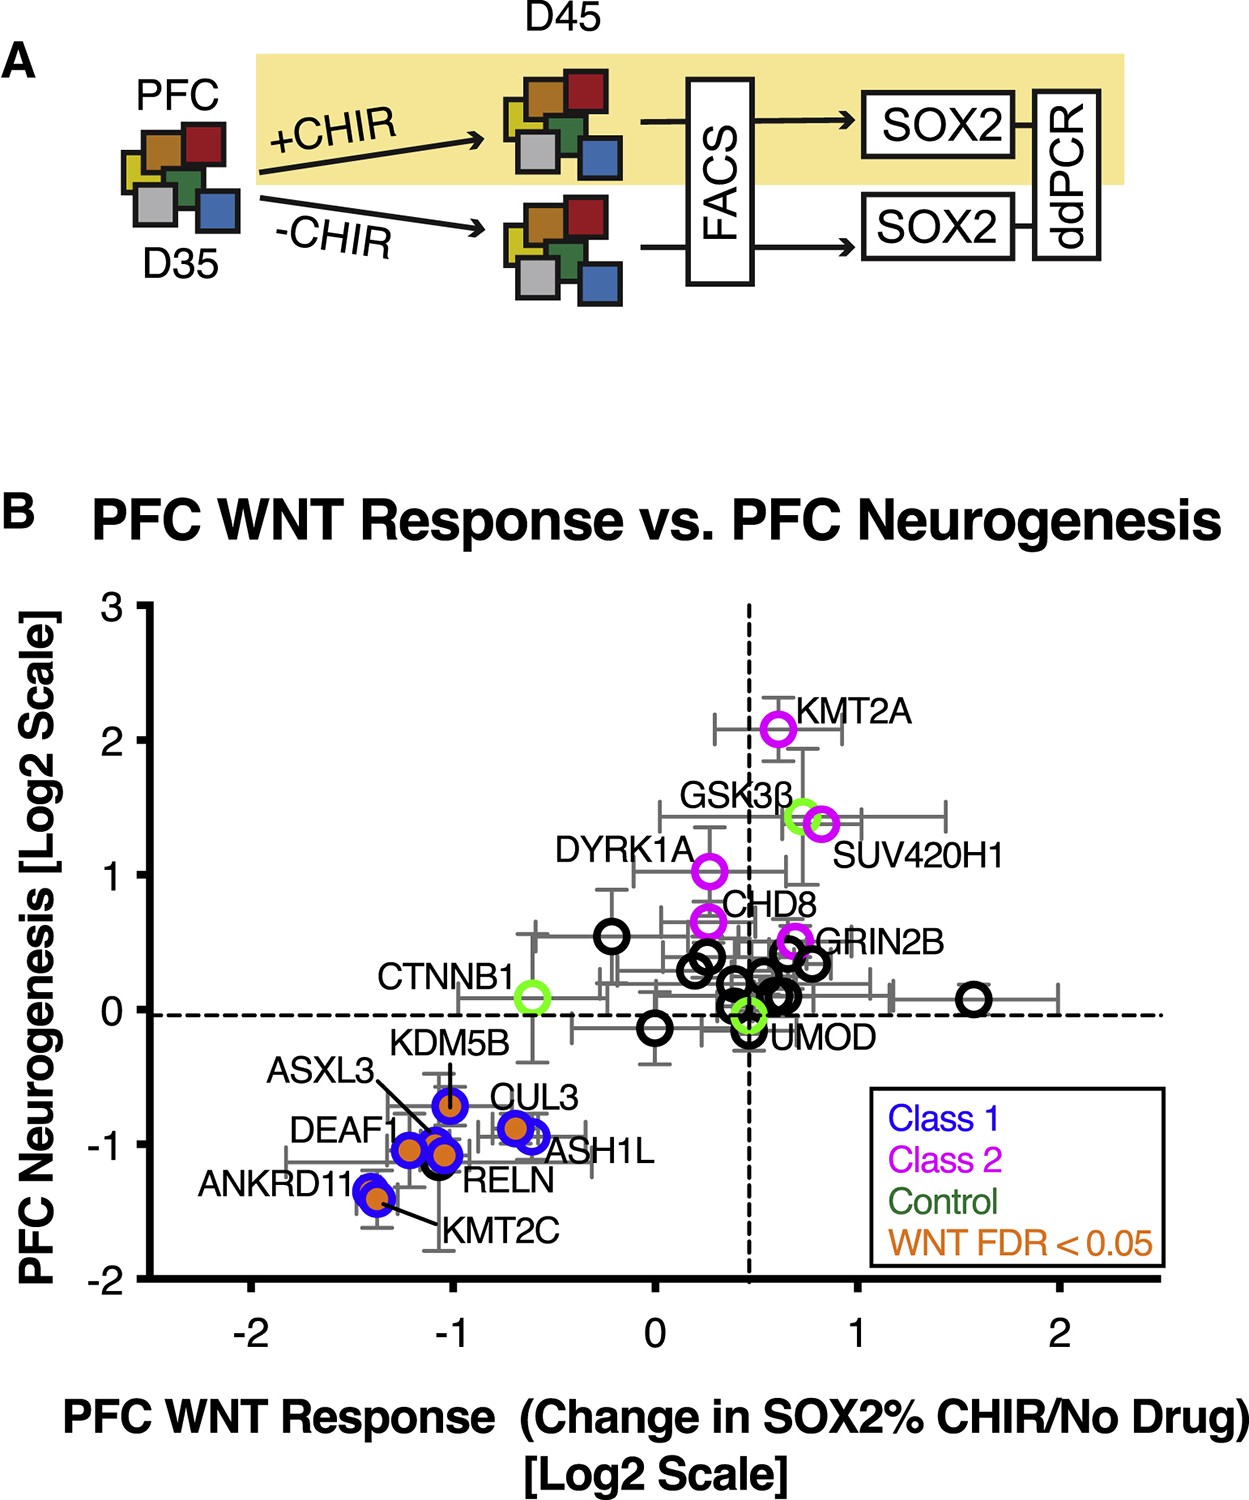
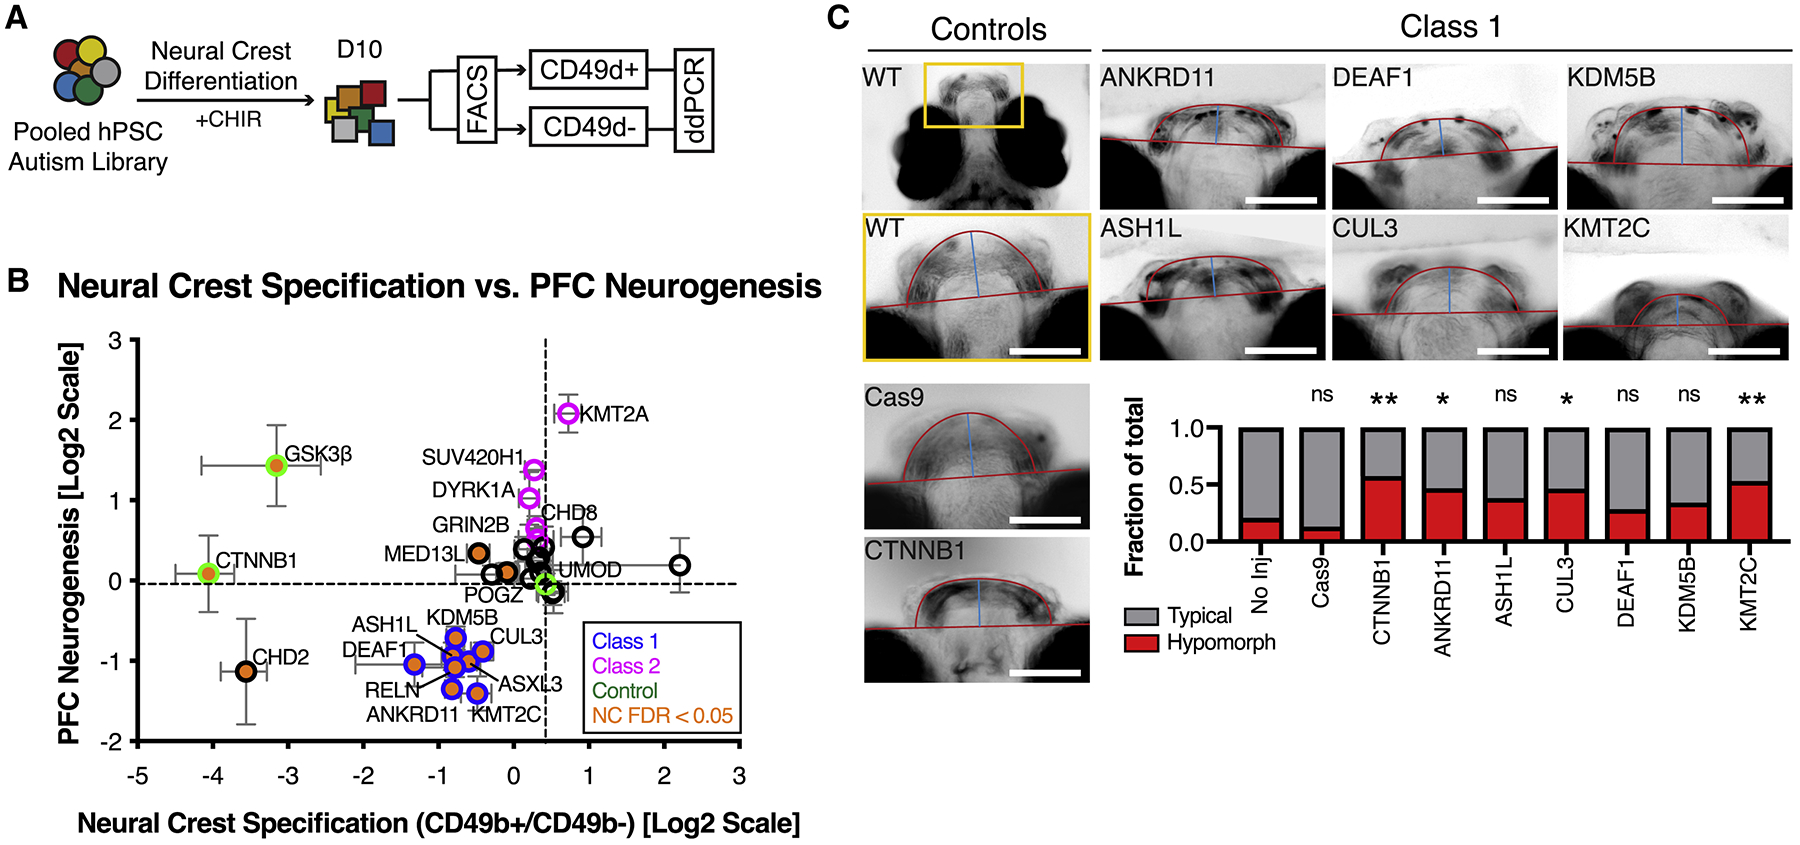
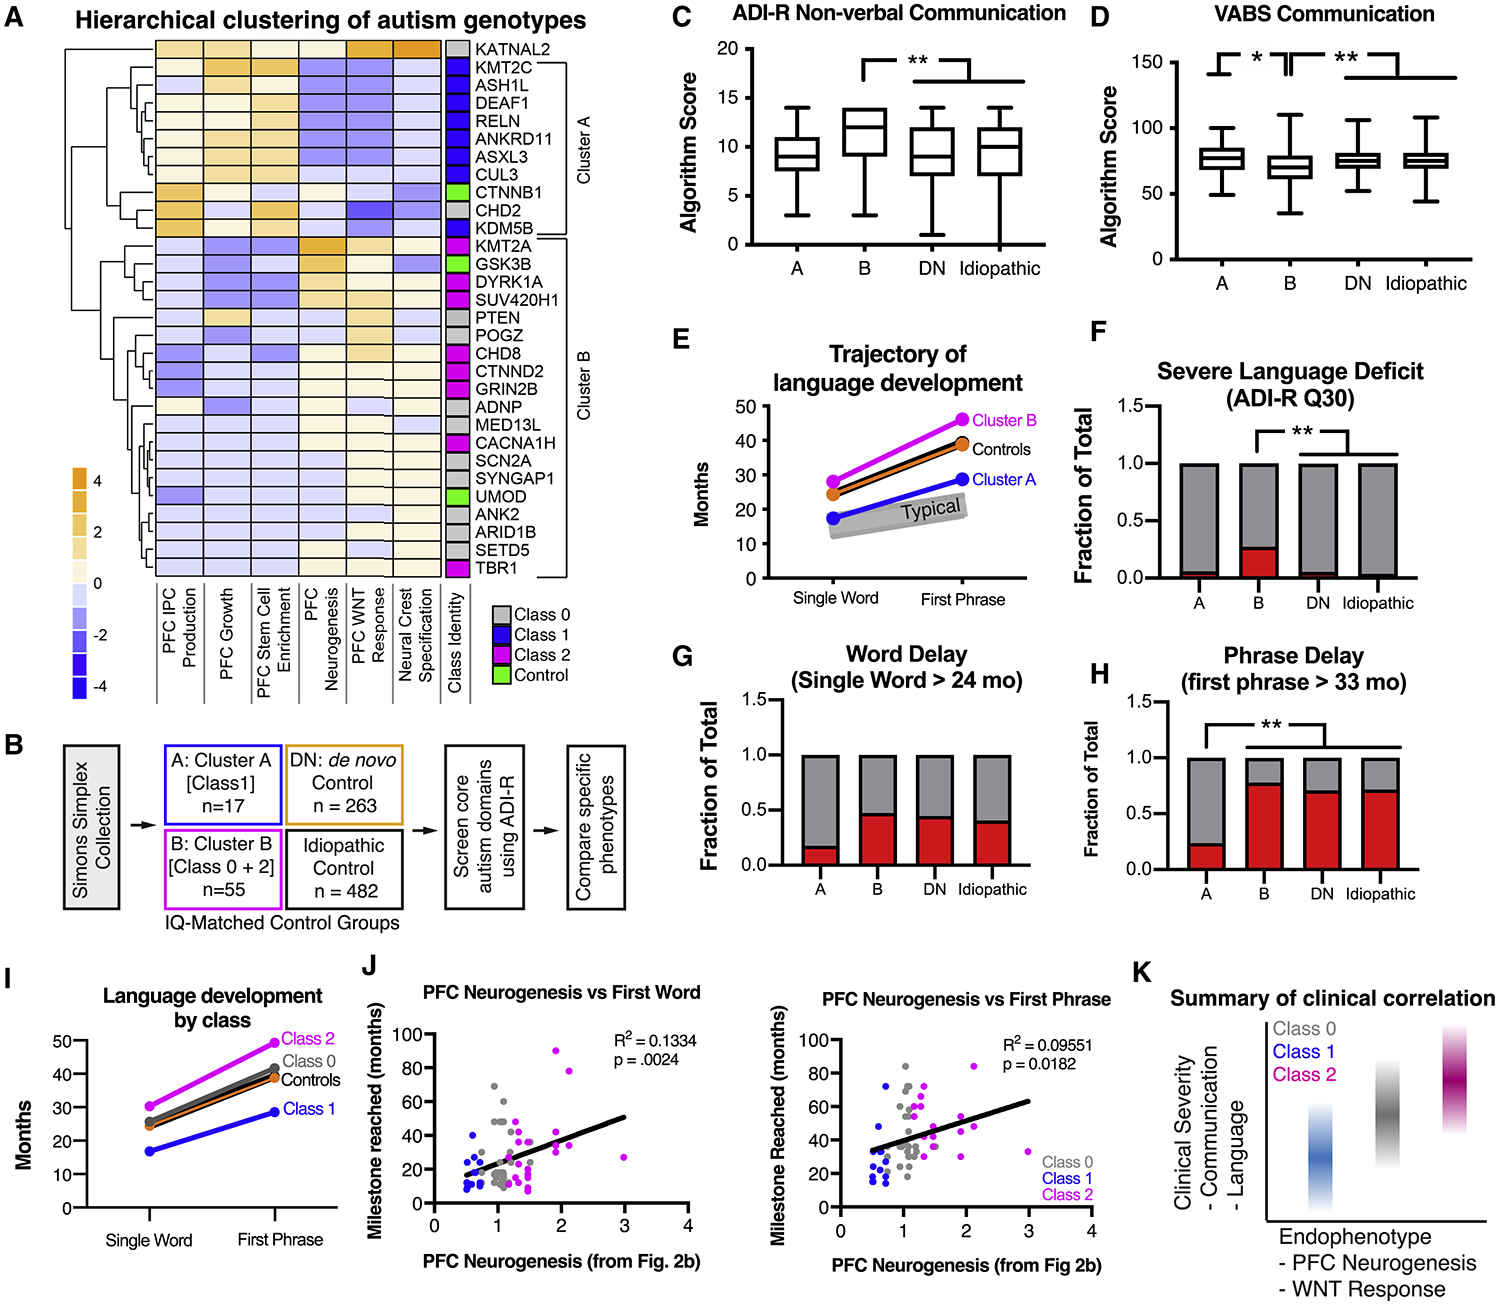
Autism is a clinically heterogeneous neurodevelopmental disorder characterized by impaired social interactions, restricted interests, and repetitive behaviors. Despite significant advances in the genetics of autism, understanding how genetic changes perturb brain development and affect clinical symptoms remains elusive. Here, we present a multiplex human pluripotent stem cell (hPSC) platform, in which 30 isogenic disease lines are pooled in a single dish and differentiated into prefrontal cortex (PFC) lineages to efficiently test early-developmental hypotheses of autism. We define subgroups of autism mutations that perturb PFC neurogenesis and are correlated to abnormal WNT/βcatenin responses. Class 1 mutations (8 of 27) inhibit while class 2 mutations (5 of 27) enhance PFC neurogenesis. Remarkably, autism patient data reveal that individuals carrying subclass-specific mutations differ clinically in their corresponding language acquisition profiles. Our study provides a framework to disentangle genetic heterogeneity associated with autism and points toward converging molecular and developmental pathways of diverse autism-associated mutations.

Keywords: autism; genetics; human pluripotent stem cells; neural development; prefrontal cortex.


Conflict of interest statement

Declaration of Interests G.Y.C. and L.S. are listed as inventors of a related patent application filed by the Memorial Sloan Kettering Cancer Center. L.S. is a co-founder and paid consultant of BlueRock Therapeutics.

Figures

Figure 1.
Figure 1.. Design and validation of hPSC-based multiplex analysis platform.
(A) Multiplex assay design. Individual disease-associated hPSC lines are generated using CRISPR/Cas9, pooled, and differentiated into a disease-relevant tissue. The pooled differentiation can be assayed for growth, cell-state, or drug-response phenotypes by determining relative allele frequencies for each line in comparison to an internal standard (negative control). For example, growth phenotypes are determined by measuring changes in allele frequency over time (T1 vs T0). Cell-state phenotypes are determined by measuring differences in allele frequency between physically separated populations (e.g. neurons versus progenitors separated via fluorescence activated cell sorting (FACS) or magnetic sorting (MACS), cells exposed (or not) to a given drug or cells separated based on migratory potential). Drug response phenotypes are determined by measuring differences in allele frequency between treated and untreated pools. Allele frequencies are measured using ddPCR. (B) ddPCR is a sensitive and accurate method to measure allele frequency, as determined by a serial dilution assay. ddPCR could detect the GSK3β line within a 4-line mixture until it reached a frequency between 1:7290 and 1:21870, using a read depth of ~15,000. n = 3 dilution series, mean ± S.D. (C) Validation of multiplex assay. A pool of 8 hPSC lines, including CTNNB1, UMOD, and GSK3β mutant lines, was separated into CTNNB1-low and CTNNB1-high expressing fractions using intracellular FACS with a CTNNB1 antibody. Each fraction was genotyped with ddPCR to calculate relative allele frequencies (allele frequency in sorted fraction / allele frequency in unsorted fraction). The CTNNB1 mutant line was enriched in the CTNNB1-low fraction while all other lines were depleted in this fraction. Graph depicts mean ± S.D. dots represent individual multiplex assays. One-way ANOVA followed by Dunnett’s test. **** p < 0.0001. n = 4 independent trials. (D) Average magnitude of allele frequency fold change in MIX30 library, normalized to passage 0, remained < 3x for 7 passages. Individual data points represent average fold change per line across MIX30 pools (n = 3). Mean ± S.D., dots represent individual lines within pooled cultures. (E) Competitive growth dynamics of all lines in MIX30 library at pluripotency stage. Lines with selective growth advantage (e.g. PTEN and GSK3β) appear to suppress growth of most other lines by passage 16. n = 3 MIX30 pools, mean ± S.E.M. (F) Allele frequencies measured one day after thawing are largely unaffected by freeze-thaw cycle. Graph depicts mean ± S.E.M, two-sided t-test using Benjamini-Hochberg method for multiple comparison. Red indicates line with significantly reduced allele frequency (FDR < 0.05). n = 3 MIX30 pools. ddPCR, droplet digital PCR. See also Figure S1 and Table S1.
Figure 2.
Figure 2.. Deriving human prefrontal cortex-like tissue from hPSCs.
(A) Schematic illustration for hPSC-derived PFC cultures. (B) PFC and OCC cultures express appropriate regional markers, assessed by immunocytochemistry. FOXG1+/PAX6+/GSH2−/NKX2.1- indicates general cortical identity. FOXG1 (PFC, 81.6±16.1%; OCC, 86.5±8.5%), PAX6 (PFC, 86.5±11.2%; OCC, 96.9±3.3%), GSH2 (PFC, 0.0±0.0%; OCC, 1.0±0.9%) and NKX2.1 (PFC, 0.0±0.0%; OCC, 0.1±0.1%). SP8 and COUPTF1 are PFC and OCC markers, respectively. SP8 (PFC, 88.0±12.4%; OCC, 15.0±10.0%), COUPTF1 (PFC, 12.0±10.8%; OCC, 90.3±12.9%). Graph depicts mean ± S.D., dots represent individual differentiations. n = 3 differentiations. (C) Differential transcript expression of 14 genes between human fetal PFC and OCC, defined using BrainSpan transcriptional atlas (see methods), were highly correlated in vitro and in vivo, R2 = 0.6191, p = 0.0008; n = 5 differentiations, mean ± S.D. (D) Unsupervised clustering of RNA-seq data from NSC, OCC, and PFC cultures. (E) Unsupervised clustering of differentially expressed genes between NSC, OCC, and PFC cultures. (F) Ratio of hPSC-derived PFC to OCC gene expression for the top 200 genes more highly expressed in human fetal PFC versus OCC (top row) and the top 200 genes more highly expressed in human fetal OCC versus PFC (bottom row). Chi-squared p = 1.6×10⁻¹¹, n = 4 PFC and OCC differentiations each. (G) Four examples of genes with differential gene expression from RNA-seq analysis. dSMADi, dual-SMAD inhibitors SB431542 and LDN193189; PCW, post-conception week; PFC, prefrontal cortex; OCC, occipital cortex; NSC, neural stem cell; WNTi, tankyrase inhibitor XAV939. Scale bars = 100 μm. See also Figure S2 and Table S2.
Figure 3.
Figure 3.. Multiplex analysis reveals functional subgroups of autism-associated mutations that dysregulate PFC neurogenesis.
(A) Schematic illustration of multiplex strategy to test autism mutations for alterations in PFC growth and neurogenesis. Growth phenotypes are determined by measuring changes in allele frequency from D0 to D20 (early neural growth), and D20 and D45 (PFC growth). PFC neurogenesis phenotypes are determined by measuring changes in allele frequency between NSC (SOX2), IPC (TBR2), and Neuron (DCX) sorted fractions. (B) Multiplex assay testing each autism line for cortical specification. Average relative cell line enrichment in PAX6+ fraction, relative to an unsorted day 20 MIX30 fraction (ANOVA p < 0.0001). Red bars indicate cell lines with significant increases or decreases in enrichment score compared to UMOD (FDR < 0.05). Graph depicts mean ± S.E.M., dots represent individual differentiations. FDR calculated using Welch ANOVA with post-hoc comparison to UMOD, p values corrected using Benjamini, Krieger, Yekutieli method. n = 3 differentiations. (C) Scatter plot of multiplex neurogenesis assay showing changes in neuronal production (DCX/SOX2 ratio) and stem cell enrichment (SOX2/All ratio). Class 1 mutations (8/27, blue: FDR < 0.05) exhibit decreased neuronal production or increased stem cell enrichment. Class 2 mutations (5/27, magenta: FDR <0.05) exhibit increased neuronal production or decreased stem cell enrichment. n = 5 differentiations from three MIX30 pools. (D) Scatter plot of multiplex neurogenesis assay showing changes in IPC production (TBR2/SOX2 ratio) correlated with PFC neurogenesis phenotypes (DCX/SOX2 ratio), normalized to a negative control (UMOD). 7/8 Class 1 mutations (blue edge) exhibit increased IPC production (orange, FDR<0.05), while Class 2 (magenta edge) mutations are variable in IPC production phenotypes. n ≥ 3 differentiations from at least two MIX30 pools. (E) Scatter plot of multiplex assay showing competitive growth phenotypes during early neural (D20/D0 ratio) and PFC growth phases (D45/D20 ratio). 7/8 Class 1 mutations (blue edge) show increased PFC growth (orange, FDR<0.05) while 4/5 Class 2 mutations (magenta edge) exhibit decreased PFC growth (orange, FDR<0.05). n = 5 differentiations from three MIX30 pools. (F) Significant negative correlation between PFC neurogenesis and PFC growth parameters (r = −0.792, p=0.0001). For all scatter plots, FDR calculated using Welch ANOVA with post-hoc Benjamini, Krieger, Yekutieli method for multiple comparisons. Dotted lines demarcate negative control UMOD. (G) 10/27 cell lines exhibited a stem cell enrichment phenotype (SOX2/All) during PFC development at day 45, while 0/27 lines exhibited a neural induction phenotype (PAX6/All) during an earlier cortical development phase at day 20. Red and grey bars indicate number of cell lines with positive and negative phenotypes respectively. (H) Summary of class-specific PFC development phenotypes. NSC behavior is characterized by a balance between proliferation and neurogenesis (black arrows). Autism mutations skew this balance toward proliferation (Class 1, blue arrow) or neurogenesis (Class 2, magenta arrow). (I) Five of eight class 1 genes are known regulators of polycomb signaling. ASH1L is a trithorax group protein (Gregory et al., 2007), and KMT2C is a member of the COMPASS complex (Piunti and Shilatifard, 2016). ASXL3 is part of the Polycomb repressive deubiquitinase complex (Srivastava et al., 2016). CUL3 regulates polycomb through ubiquitination (Hernandez-Munoz et al., 2005). KDM5B occupies over 50% of polycomb sites (Schmitz et al., 2011). In addition, DEAF1 mutant mice have a homeotic transformation phenotype (Hahm et al., 2004). All error bars are mean ± S.E.M. Internal standards are colored green. CTX, cerebral cortex; D, day; ddPCR, droplet digital PCR; FACS, fluorescent activated cell sorting; hPSC; human pluripotent stem cell; NSC, neural stem cell; PFC, prefrontal cortex; IPC, intermediate progenitor cell. See also Figure S3 and Table S3.
Figure 4.
Figure 4.. Validation of multiplex neurogenesis assay.
(A) Strategy for phenotypic validation using the MIX32 validation pool. The validation pool contains 13 pairs of autism clones, the first clone of each pair was from the original MIX30 pool, while the second was an independent clone. 9 independent clones were generated with distinct guide RNAs. A pool-based validation was performed in which the phenotype from the original MIX30 pool (clone 1) was compared to the phenotype of the independent clone (clone 2) from the validation pool. Pairs that showed discordance could then be tested in single line assays. (B) Scatter plot showing comparison of phenotypes between clone 1 (MIX30 pool) and clone 2 (validation pool). Overall correlation r = 0.797, p = 0.0006. Graph depicts mean ± S.E.M. Test pool n = 5 differentiations from three MIX30 pools, Validation pool n = 4 differentiations from three MIX32 pools. (C) Schematic comparing PFC neurogenesis phenotypes from the original MIX30 pool to the validation pool. Proliferation phenotypes are compared for CHD2 and PTEN. 9/13 clones validated using an FDR cut-off of 0.05. Increasing MIX30 FDR stringency to 0.01 increases validation rate to 11/13. Arrows represent direction of phenotype. FDR calculated using Welch ANOVA with post-hoc comparisons to UMOD, p-values corrected for multiple comparisons using Benjamini, Krieger, Yekutieli method. Test pool n = 5 differentiations from three MIX30 pools, Validation pool n = 4 differentiations from three MIX32 pools. (D) Testing of CHD8 clone 2 in a single genotype PFC differentiation shows increased ratio of NeuN/SOX2 compared to MEL1 control at day 45. Graph depicts mean±S.D., dots represent individual differentiations. Two-sided student t-test. * p = 0.022. MEL1 n = 4 differentiations, CHD8-2 n = 4 differentiations. (E) Strategy to quantify off-target rate in the MIX30 pool. A validation pool was generated that contains 15 pairs of clones, 13 autism-associated and 2 control pairs. One clone of each pair was from the original MIX30 pool, while the second clone of each pair is an independent clone. 9 independent clones were generated with distinct guide RNAs, 6 independent clones were generated with the same guide RNA. Off-target effects were determined by assessing phenotypic concordance using the multiplex PFC neurogenesis assay (see Fig. 2a). (F) Scatter plot showing comparison of phenotypes between clone pairs in validation pool. Overall correlation r = 0.916, p < 0.0001. (G) Description of quality control to ensure that internal standard is suitable controls. Upper panel, cortical patterning of the UMOD is comparable to that of MEL1. MEL1 n = 3 differentiation, UMOD n = 1 differentiation. Lower panel, proliferation of the UMOD line was compared to the positive control line GSK3β, showing an expected lower proliferation rate than GSK3β across 5 mini-pools. As an example of the importance of quality control measures, the UMOD-B clone from the MIX32 pool, which showed off-target effect, would not have passed quality control as it did not show a lower proliferation rate than GSK3β. Minipool 1, n = 4; minipool 2, n = 4; minipool 3, n = 2; minipool 4, n = 1; minipool 5, n =1; UMOD-B, n = 4 differentiations. (H) Percent of SOX2 cells per differentiation, normalized to UMOD. 5/6 class 1 genes (blue) showed the expected increase in SOX2 percentage, while MEL1 was similar to UMOD. ANOVA p = 0.0025\. (I) DCX/SOX2 ratio for each line, normalized to UMOD. 6/6 class 1 genes (blue) showed the expected increase in DCX/SOX2 ratio, while MEL1 was similar to UMOD. ANOVA p < 0.0001. Graphs depict mean ± S.D., dots represent individual differentiations. Comparisons made using one-way ANOVA with post-hoc comparisons to UMOD, corrected using Dunnett test. Samples scaled to group mean. For all panels, UMOD, n = 7; MEL1, n = 5; GSK3β, n = 6; CTNNB1, n = 4; ANKRD11, n = 7; ASH1L, n = 7; ASXL3, n = 4; CUL3, n = 7; DEAF1, n = 7; RELN, n =7 differentiations. FACS, fluorescent activated cell sorting. See also Figure S4.
Figure 5.
Figure 5.. Class-specific dysregulation of WNT signaling.
(A) Schematic illustration of multiplex strategy to test autism mutations for WNT/βcatenin response during PFC growth. D35 Pooled PFC cultures are treated with the CHIR99021 (GSK3 inhibitor, 3μM) for 10 days and compared to untreated cultures. Stem cell proliferation is used as a read-out of WNT activity. (B) Correlation of PFC WNT response with PFC neurogenesis phenotype. 7/8 Class 1 mutations (blue edge) are hyporesponsive to WNT signaling (orange, FDR < 0.05). FDR calculated using Welch ANOVA with post-hoc comparisons to UMOD, p-values corrected for multiple comparisons using Benjamini, Krieger, Yekutieli method n = 4 differentiations from three MIX30 pools. See also Figure S5 and Table S3.
Figure 6.
Figure 6.. Class-specific dysregulation of neural crest development.
(A) Schematic illustration of multiplex strategy to test autism mutations for WNT/βcatenin response during neural crest development. MIX30 hPSC pools are differentiated toward neural crest for 10 days using an established WNT-dependent protocol. Allele frequencies are then compared between cranial neural crest positive (CD49d+) and negative (CD49d-) sorted fractions. (B) Correlation of neural crest specification with PFC neurogenesis phenotypes reveals that 8/8 Class 1 mutations (blue edge) impair cranial neural crest specification (orange, FDR < 0.05). All error bars are mean ± S.E.M. FDR calculated using Welch ANOVA with post-hoc comparisons to UMOD, p-values corrected for multiple comparisons using Benjamini, Krieger, Yekutieli method. Internal standards are colored green. (C) Analysis of zebrafish jaw development in F0 mosaic loss-of-function animals imaged ventrally at 7 dpf. Top left image depicts area of high magnification. Cas9 alone and CTNNB1 gRNA injections serve as controls. Class 1 mutations exhibit hypomorphic jaw phenotypes that resemble those of CTNNB1 mutants (CTNNB1 p = 0.0064, ANKRD11 p = 0.0488, CUL3 = 0.0488, KMT2C = 0.0088). p values calculated using Fisher’s exact test corrected for multiple comparisons using Benjamini-Hochberg method. No injection n = 43, Cas9 alone n = 23, CTNNB1 n = 40, ANKRD11 n = 32, ASH1L n = 68, CUL3 n = 43, DEAF1 n = 28, KDM5B n = 41, KMT2C n = 47 fish. All injections performed on at least 2 clutches. Dpf, days post fertilization. Scale bars, 100μm. See also Figure S6 and Table S3.
Figure 7.
Figure 7.. Distinct functional subgroups of autism mutations correlate with differing clinical profiles of language development.
(A) Unbiased hierarchical clustering of phenotypic data from six multiplex assays reveals two major functional groups of autism mutations from the MIX30 library. Class 1 mutations fall into cluster A, while Class 2 mutations fall into cluster B. (B) Strategy for clinical phenotype analysis. Probands from the Simons Simplex Collection (SSC) were segregated into cohorts based on the presence of a de novo mutation in genes from Cluster A (17 patients) or Cluster B (55 patients). Control groups were generated by defining IQ-matched patient cohorts with any other de novo mutation not in the MIX30 library (de novo control, 263 patients) or patients without any known de novo mutation (idiopathic control, 482 patients). First, the ADI-R was used to screen for differences in core autism behavioral domains (communication, social behavior, restricted and repetitive behaviors). Specific behavioral phenotypes were further investigated based on the initial screening. (C), Cluster B patients exhibit increased severity in ADI-R non-verbal communication scores (Kruskal-Wallis p = 0.0072, corrected for multiple comparison of each behavioral domain using Holm-Sidak method; post-hoc Dunn’s multiple comparison test, B vs. DN p = 0.0025; B vs. Idiopathic corrected p = 0.0008). (D) Cluster B patients are on average reduced in the communication domain of the Vineland adaptive behavior scale (ANOVA p = 0.0004; Tukey’s multiple comparison’s test, A vs. B p = 0.037, B vs. DN p = 0.0027, B vs. Idiopathic p = 0.0002). (E) Average trajectories of language development. Control cohorts speak single words at ~24 months (DN=24.4 mo; idiopathic=24.4 mo) and speak their first phrases at ~39 months (other=38.8 mo; idiopathic=39.3 mo). Cluster B patients speak words at 28.02 months and first phrases at 46.1 months. Cluster A patients speak single words at 17.4 months and first phrases at 28.7 months. Typical language development is depicted in gray. (F) Cluster B cohort contains an increased fraction of patients with severe language deficit when compared to control cohorts (chi-squared p < 0.0001; Fisher’s exact tests with Holm-Sidak correction for multiple comparison B vs. DN p = 0.0018, B vs. Idiopathic p = 0.0018). (G) No significant difference in word delay across groups (chi-squared p = 0.114). (H) Cluster A contains a decreased fraction of patients with phrase delay compared to other cohorts (Chi-squared p = 0.0002; Fisher’s exact tests with Holm-Sidak correction for multiple comparison A vs. B p = 0.0018, A vs. DN p = 0.0018, A vs. idiopathic p = 0.0018). (I) Class 0 exhibits an intermediate phenotype of average language development, between Class 1 and 2. (J) Correlation of language development with in vitro PFC neurogenesis. PFC neurogenesis values (Fig. 2b, DCX/SOX2 ratio) were assigned to probands using proband genotypes. Both first word (R2 = 0.1334, p = 0.0024) and first phrases milestone (R2 = 0.09551, p = 0.0182) showed significant positive correlations with the extent of PFC neurogenesis. Each dot represents one proband. (K) Summary of phenotypic segregation of autism patients defined using hPSC-based multiplex analysis platform. ASD, autism spectrum disorder. ADOS, Autism Diagnostic Observation Schedule. ADI-R, Autism Diagnostic Interview-Revised. See also Figure S7.

Comment in

Similar articles

Cited by

References

    1. Ahn J, Jang J, Choi J, Lee J, Oh SH, Lee J, Yoon K, and Kim S (2014). GSK3beta, but not GSK3alpha, inhibits the neuronal differentiation of neural progenitor cells as a downstream target of mammalian target of rapamycin complex1. Stem Cells Dev 23, 1121–1133. - PMC - PubMed
    1. Anders S, Pyl PT, and Huber W (2015). HTSeq--a Python framework to work with high-throughput sequencing data. Bioinformatics 31, 166–169. - PMC - PubMed
    1. Arranz J, Balducci E, Arato K, Sanchez-Elexpuru G, Najas S, Parras A, Rebollo E, Pijuan I, Erb I, Verde G, et al. (2019). Impaired development of neocortical circuits contributes to the neurological alterations in DYRK1A haploinsufficiency syndrome. Neurobiol Dis 127, 210–222. - PMC - PubMed
    1. Balasubramanian M, Willoughby J, Fry AE, Weber A, Firth HV, Deshpande C, Berg JN, Chandler K, Metcalfe KA, Lam W, et al. (2017). Delineating the phenotypic spectrum of Bainbridge-Ropers syndrome: 12 new patients with de novo, heterozygous, loss-of-function mutations in ASXL3 and review of published literature. J Med Genet 54, 537–543. - PubMed
    1. Bernier R, Golzio C, Xiong B, Stessman HA, Coe BP, Penn O, Witherspoon K, Gerdts J, Baker C, Vulto-van Silfhout AT, et al. (2014). Disruptive CHD8 mutations define a subtype of autism early in development. Cell 158, 263–276. - PMC - PubMed

Publication types