. 2020 Jul 2;27(1):50-63.e5.
doi: 10.1016/j.stem.2020.06.001.

Wnt Activation and Reduced Cell-Cell Contact Synergistically Induce Massive Expansion of Functional Human iPSC-Derived Cardiomyocytes

Affiliations

Wnt Activation and Reduced Cell-Cell Contact Synergistically Induce Massive Expansion of Functional Human iPSC-Derived Cardiomyocytes

Jan W Buikema et al. Cell Stem Cell. .

Abstract

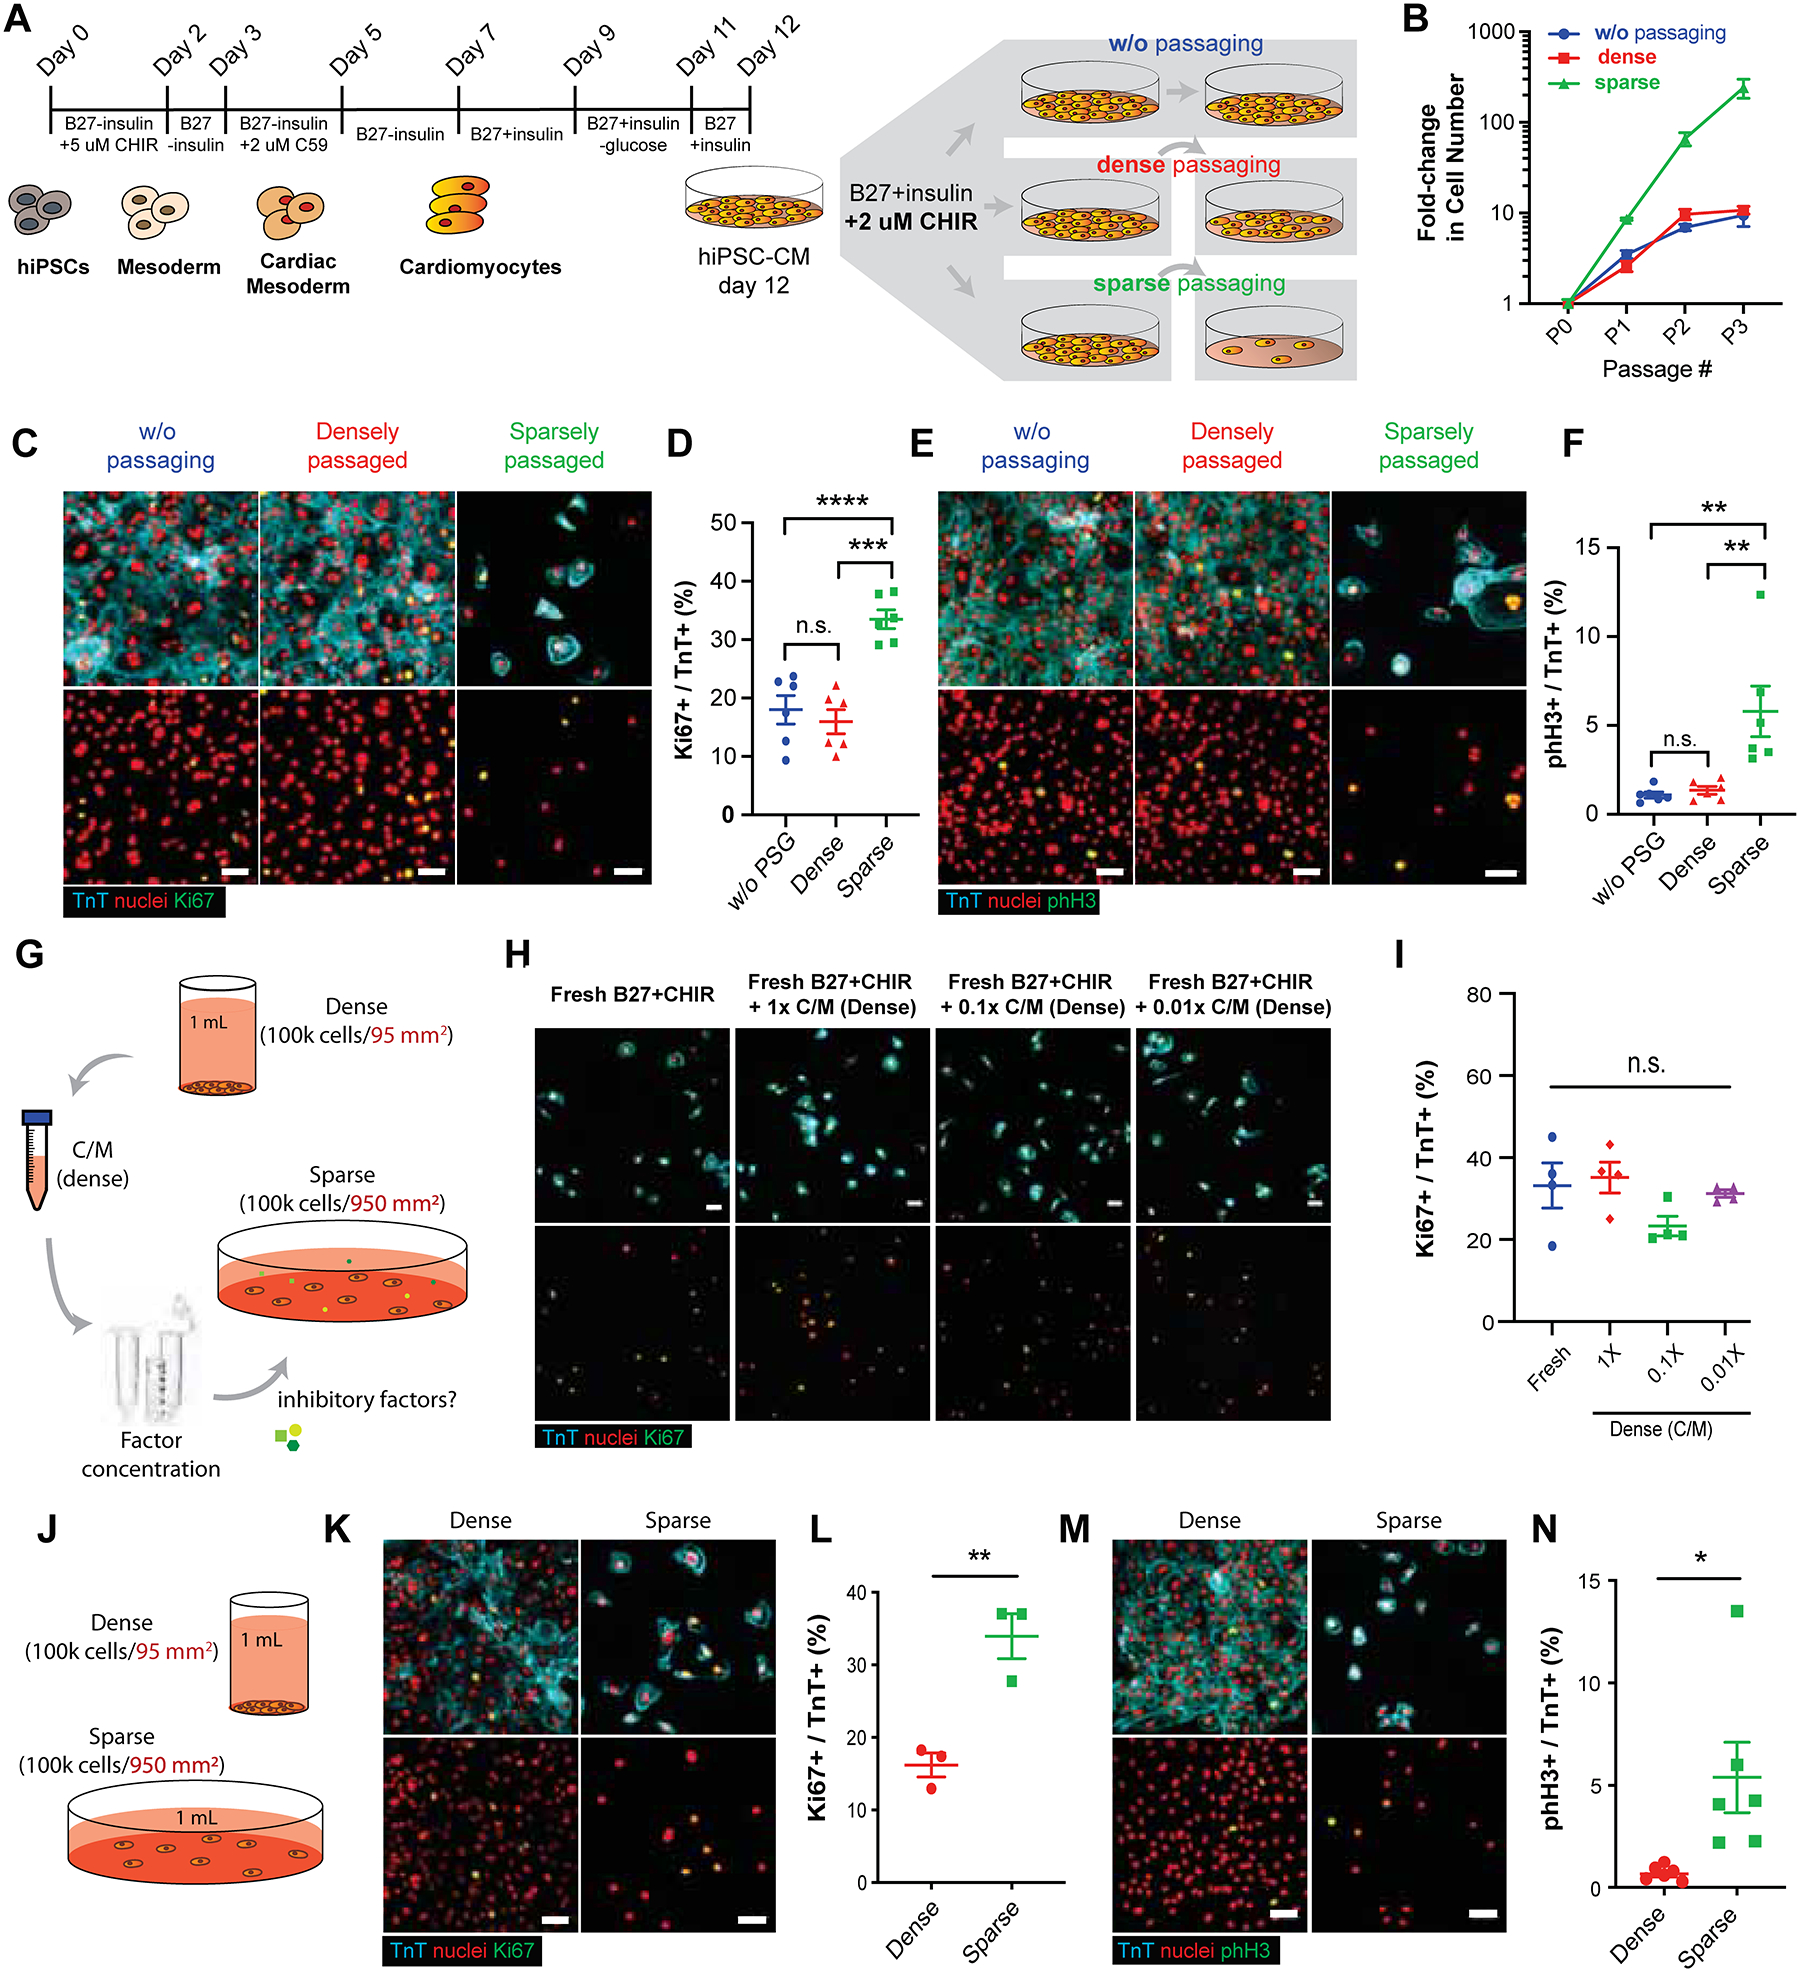
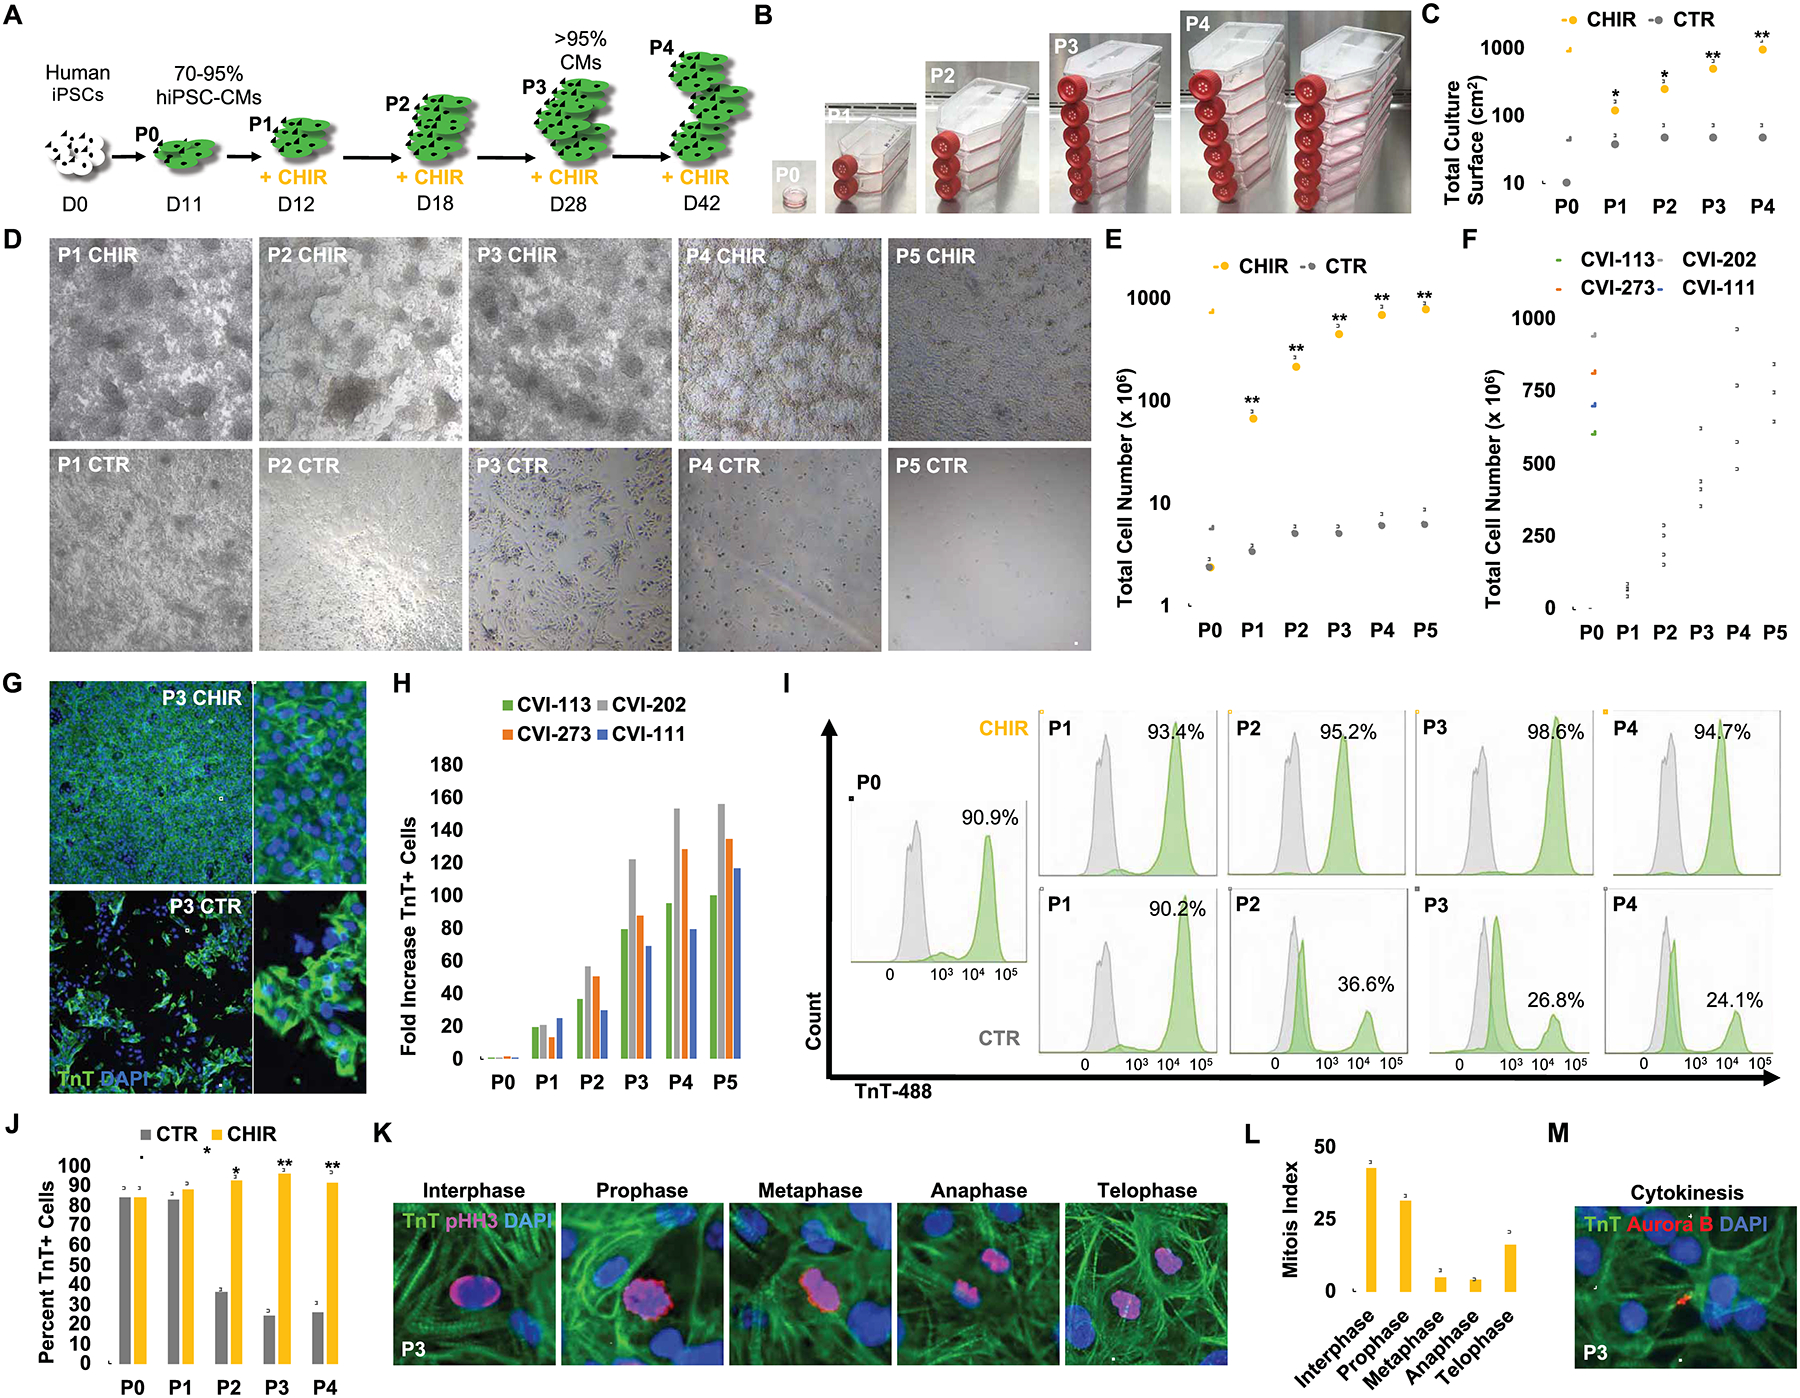
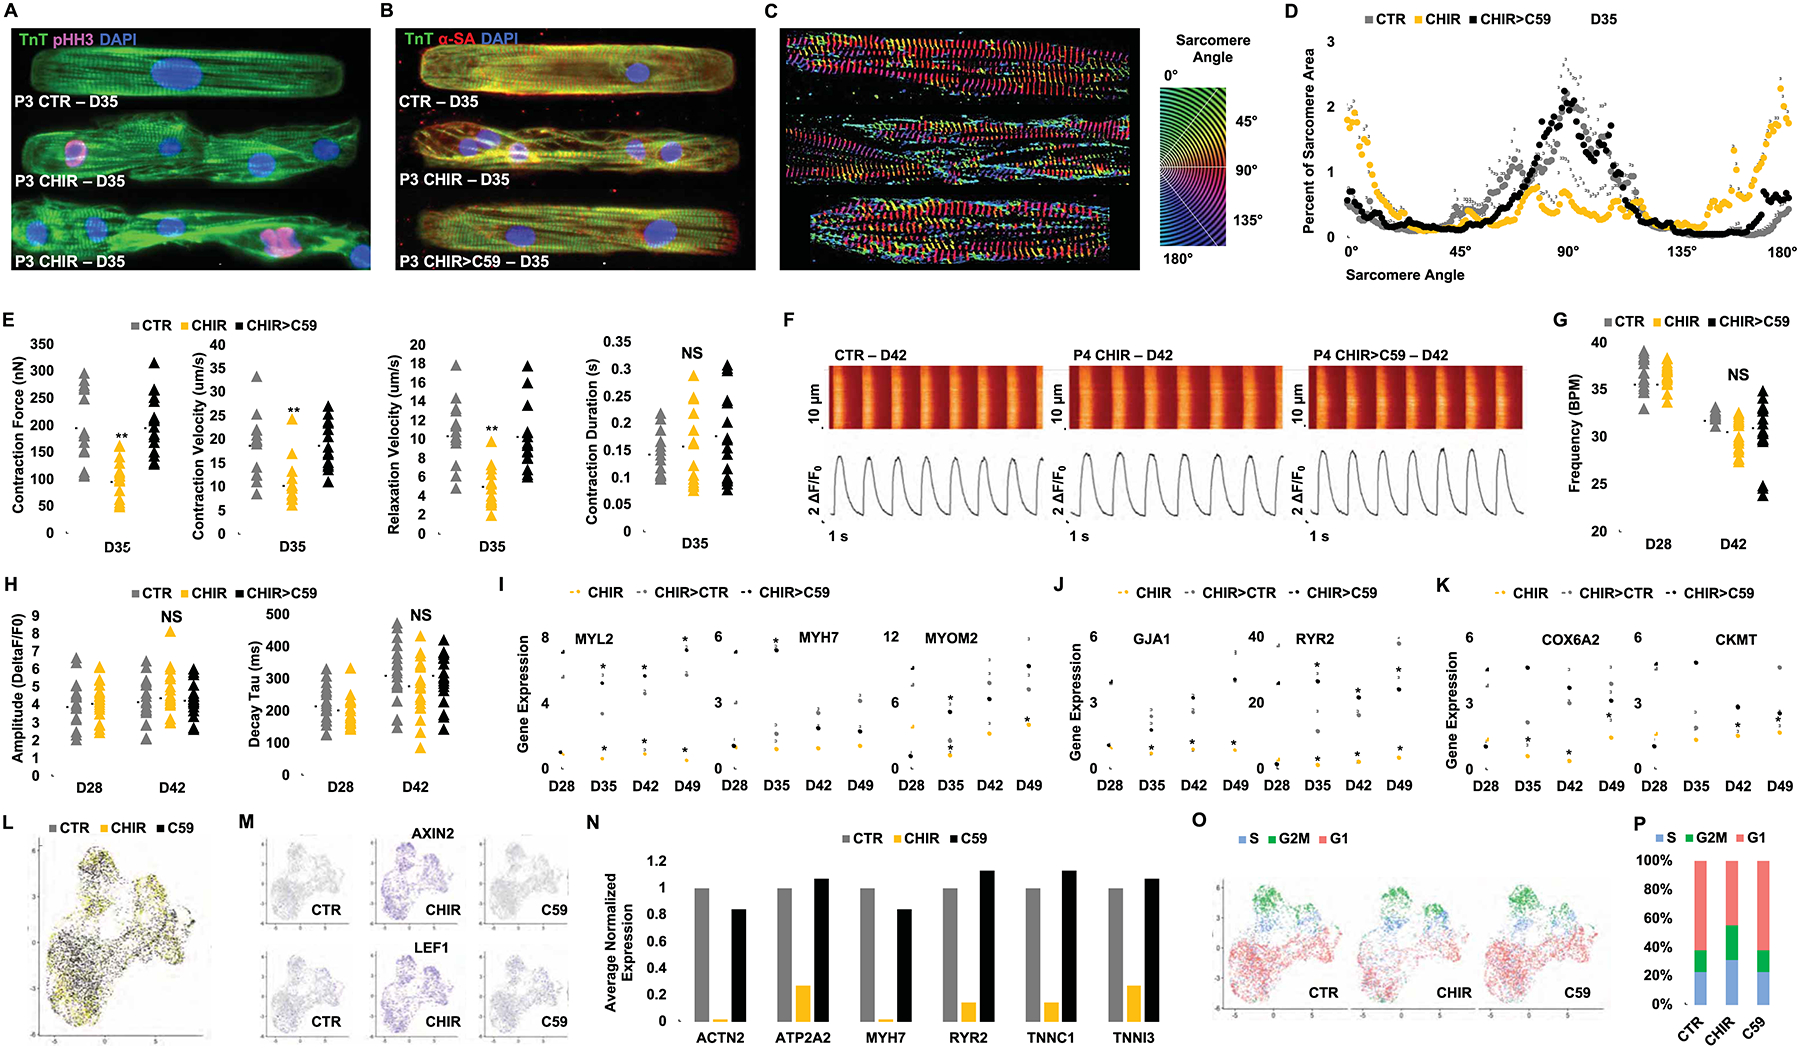
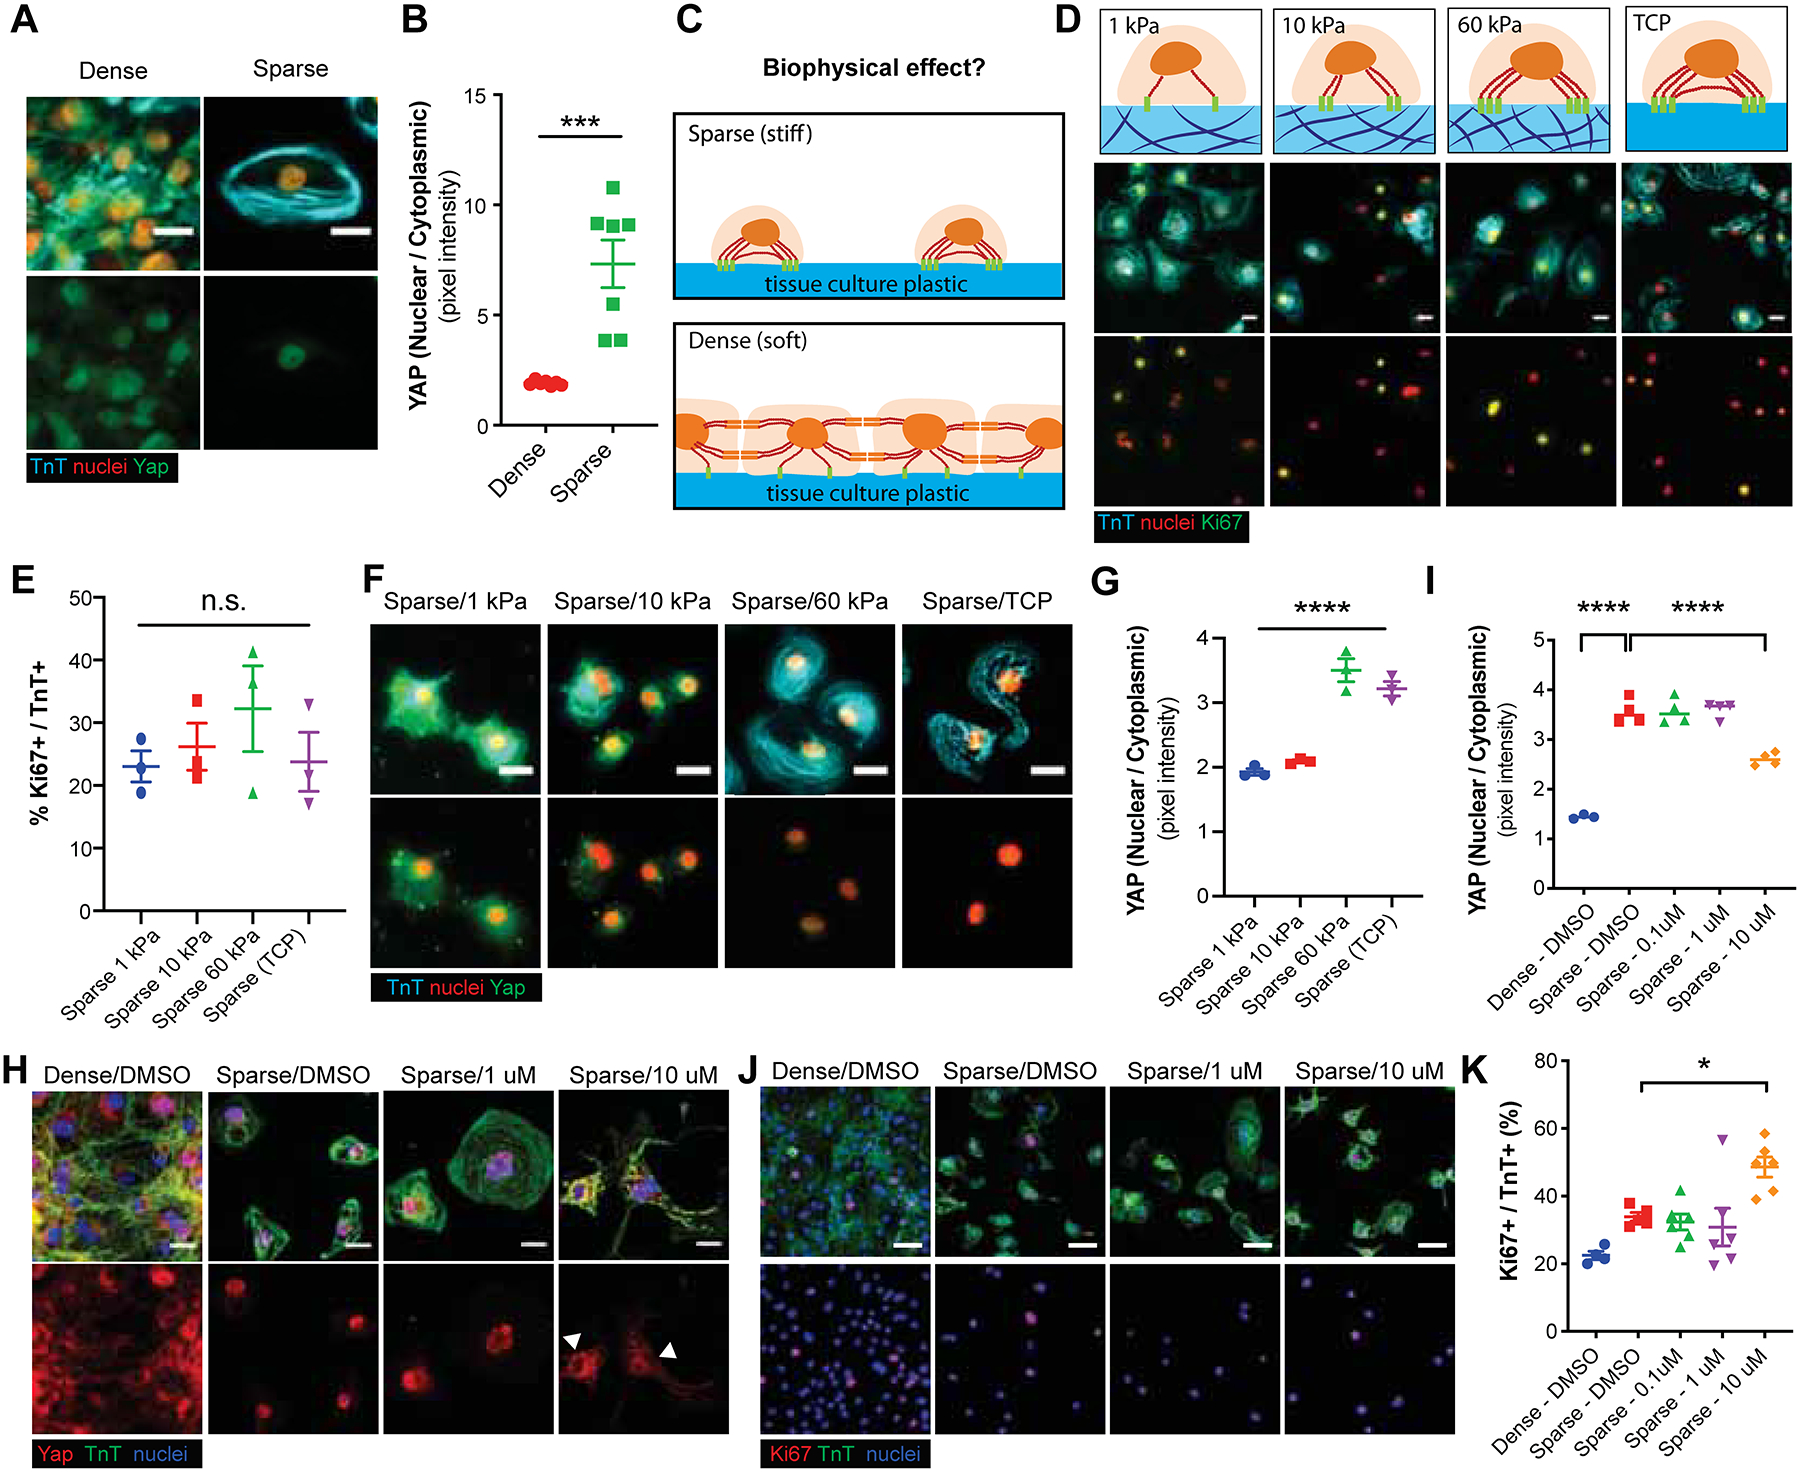
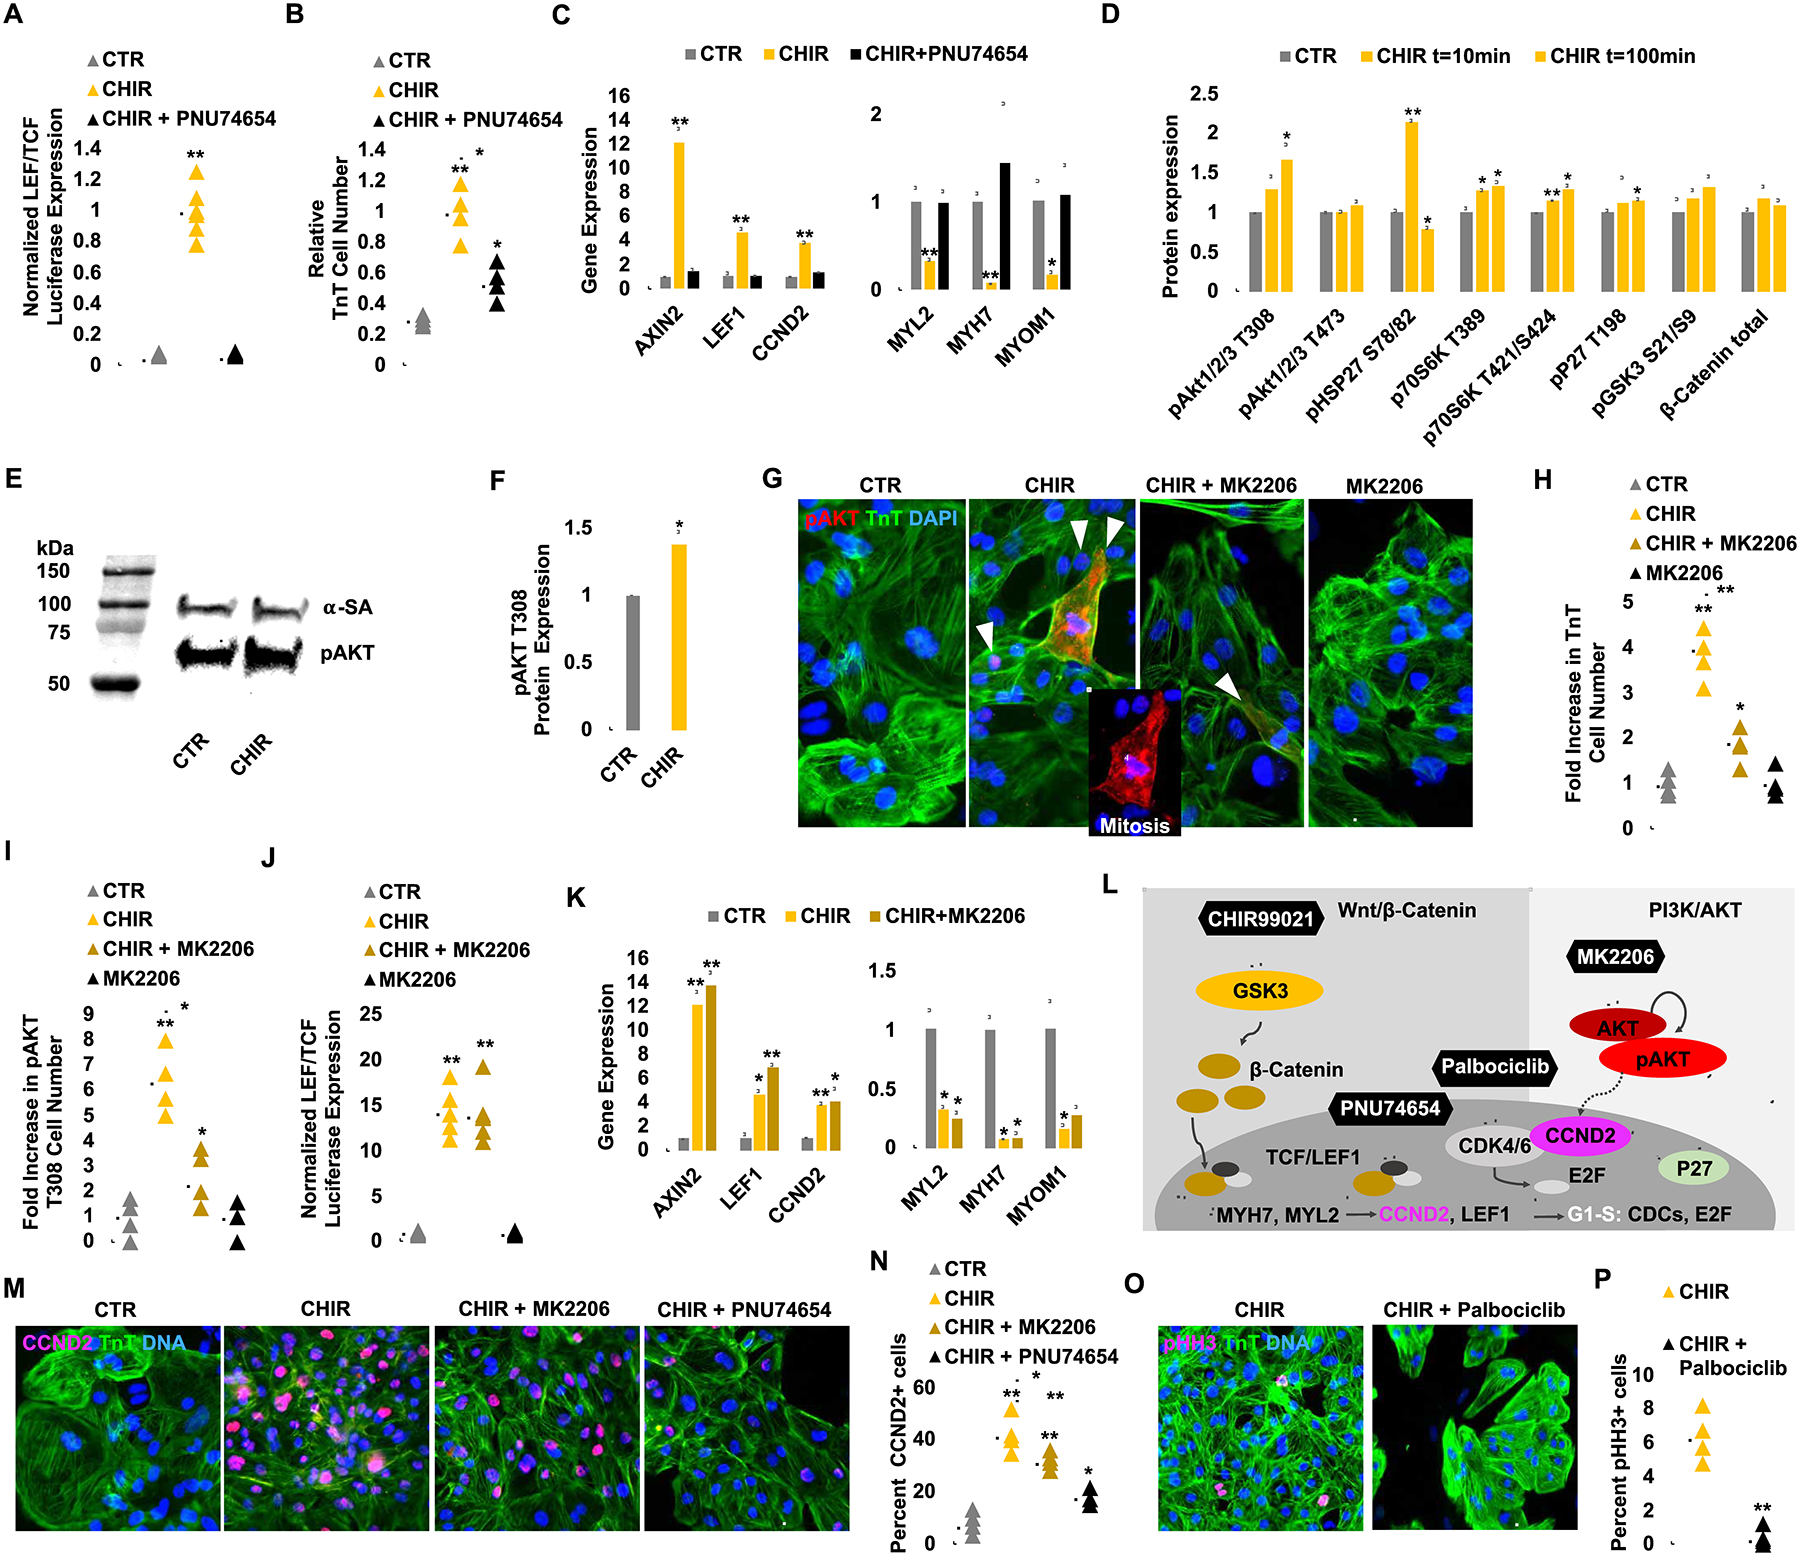
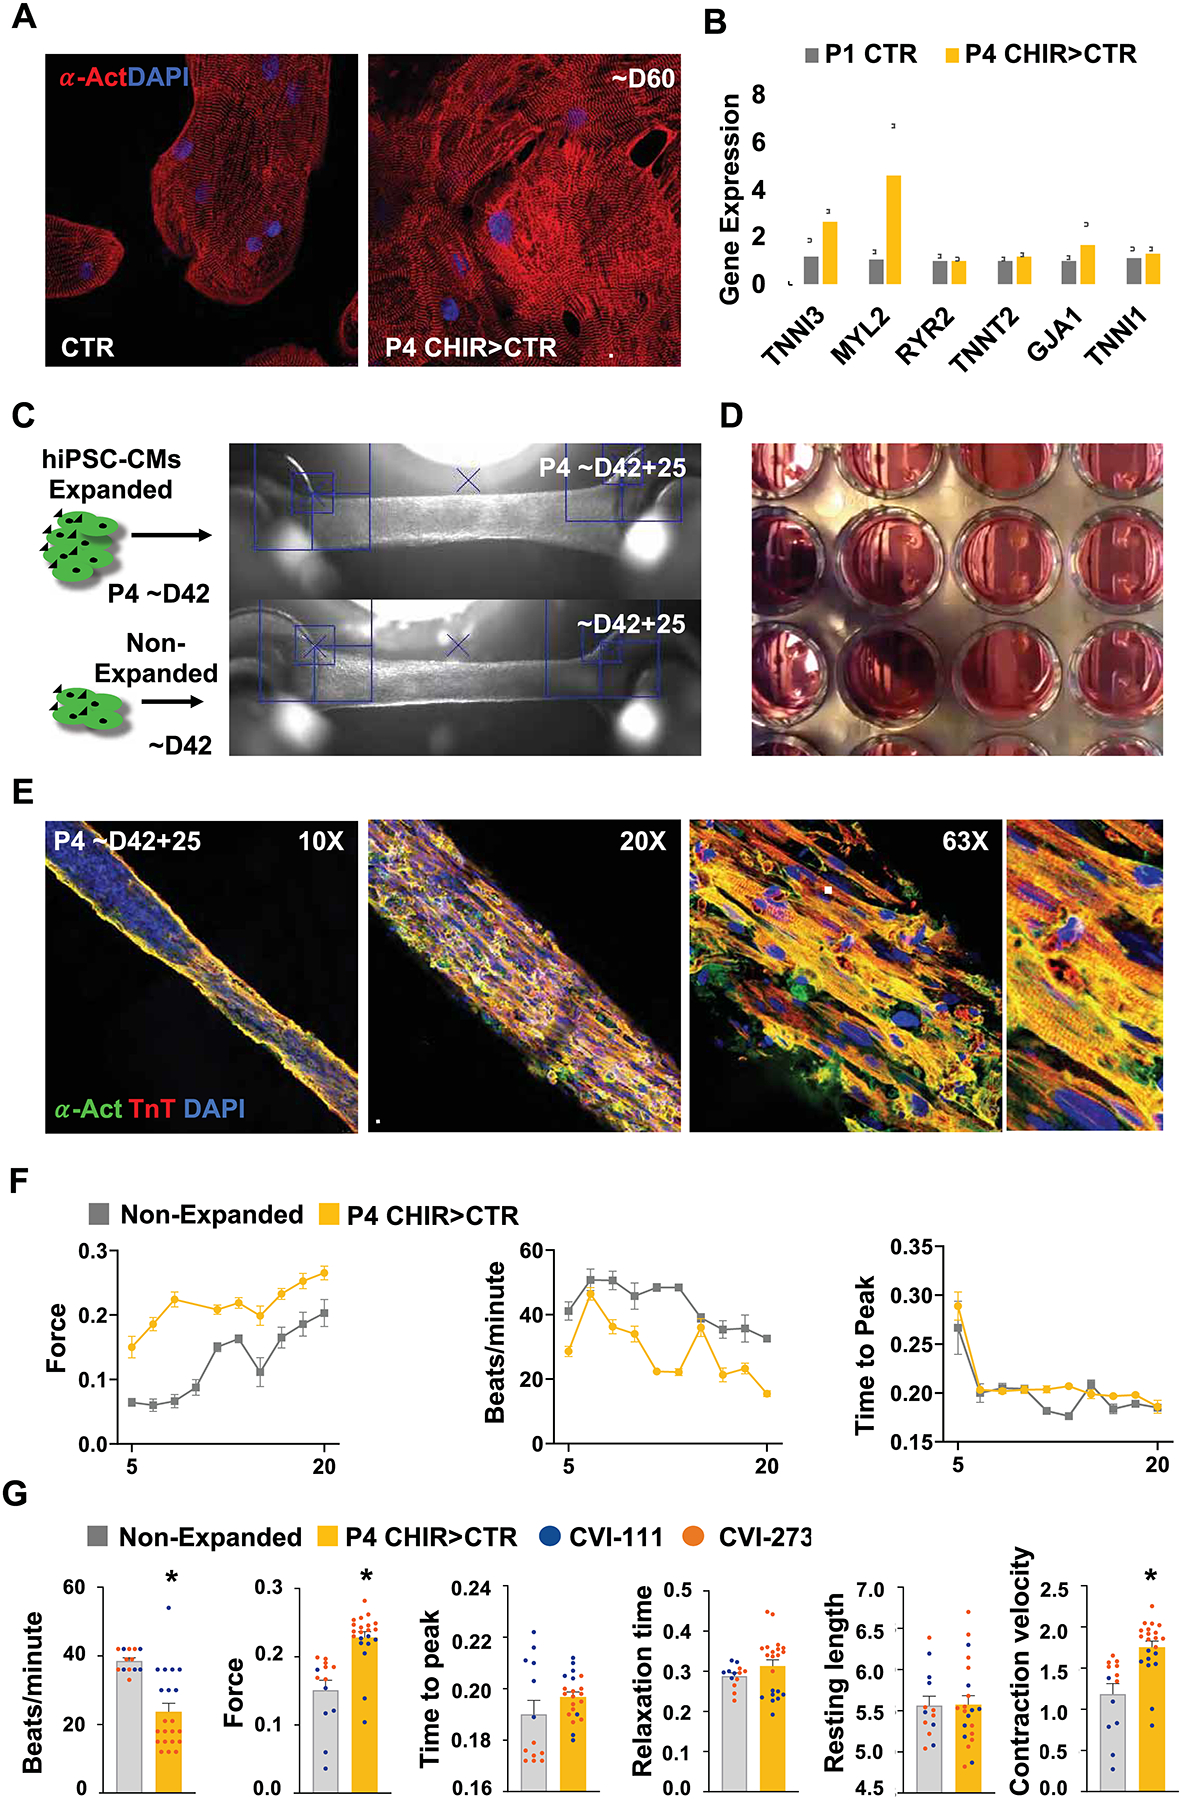
Modulating signaling pathways including Wnt and Hippo can induce cardiomyocyte proliferation in vivo. Applying these signaling modulators to human induced pluripotent stem cell-derived cardiomyocytes (hiPSC-CMs) in vitro can expand CMs modestly (<5-fold). Here, we demonstrate massive expansion of hiPSC-CMs in vitro (i.e., 100- to 250-fold) by glycogen synthase kinase-3β (GSK-3β) inhibition using CHIR99021 and concurrent removal of cell-cell contact. We show that GSK-3β inhibition suppresses CM maturation, while contact removal prevents CMs from cell cycle exit. Remarkably, contact removal enabled 10 to 25 times greater expansion beyond GSK-3β inhibition alone. Mechanistically, persistent CM proliferation required both LEF/TCF activity and AKT phosphorylation but was independent from yes-associated protein (YAP) signaling. Engineered heart tissues from expanded hiPSC-CMs showed comparable contractility to those from unexpanded hiPSC-CMs, demonstrating uncompromised cellular functionality after expansion. In summary, we uncovered a molecular interplay that enables massive hiPSC-CM expansion for large-scale drug screening and tissue engineering applications.

Keywords: GSK3; Wnt signaling; cardiomyocytes; expansion; induced pluripotent stem cells; maturation; proliferation.


Conflict of interest statement

Declaration of Interests A provisional patent has been filed with the US Patent and Trademark Office regarding the effect of bioactive lipids plus Wnt signaling activation on hiPSC-CM proliferation/expansion.

Figures

Figure 1:
Figure 1:
GSK-3β inhibition promotes hiPSC-CM proliferation in a cell-density dependent manner. (A) Schematic of Wnt-modulated directed cardiac differentiation and subsequent expansion. Day 12, hiPSC-CMs were plated densely (~100,000 cells/cm2), sparsely (~10,000 cells/cm2) for serial passaging or cultured without passaging (~500,000–1M cells/cm2) in the presence of CHIR99021 (CHIR) (2.0 μM). (B) Expansion of hiPSC-CMs represented as fold increase over day 12 for each passage (P) number. (C) Immunofluorescence images and (D) the quantification of proliferation marker Ki67 (green), cardiac troponin T (TnT) (cyan) and nuclei (red) in hiPSC-CMs. (E) Immunofluorescence images and (F) the quantification of mitotic cardiomyocytes assessed by phospho-histone H3 (pHH3) (green), TnT (cyan) and nuclei (red). (B, D, F) Data are means ± SEM. *p<0.05, ****p<0.001, n.s. p>0.05 by One-way ANOVA with Tukey’s post hoc multiple comparisons test. (G) Illustration of conditioned media collection of densely cultured cells, subsequent factor concentration and application to sparsely cultured hiPSC-CMs. (H) Immunofluorescence images of Ki67 (green), TnT (cyan), and nuclei (red). (I) Quantification of the percentages of Ki67+/TnT+ cells in H. Data are means ± SEM. n.s. p>0.05 by One-way ANOVA Dunnett’s post hoc multiple comparisons to control “no C/M” group (blue circle). (J) Schematic of culturing the fixed number of hiPSC-CMs in dense or sparse condition. (K, M) Immunofluorescence and (L, N) the quantification of the percent (K, L) proliferative cardiomyocytes (Ki67+/TnT+) or (M, N) mitotic cardiomyocytes (pHH3+/TnT+). Data are means ± SEM. *p<0.05, **p<0.01 by unpaired t-test. Supplementary Table 1 specifies the replicates per experiment.
Figure 2:
Figure 2:
GSK-3β inhibition and long-term low-density passaging results in massive expansion of beating hiPSC-CMs. (A) Schematic timeline of hiPSC-CM expansion and passaging. (B) Representative images of hiPSC-CM flasks from initial 10 cm2 confluent dish at passage 0 (P0) to multiple T-175 cm2 cell culture flasks at end of passage 4. (C) Total surface area (cm2) coverage by hiPSC-CMs at each passage. (D) Representative bright-field images of hiPSC-CMs treated with CHIR (2.0 μM) or DMSO (CTR) prior to being passaged. Note that CHIR-treated cells reach confluence again prior to next passaging while DMSO-treated cells become progressively more sparse. Same dilution factor was applied to both treatment conditions. (E) Quantification of total cell numbers from P0 to P5. (F) Graph displaying the expansion for multiple passages (P) of low-density cultured and CHIR treated CMs derived from four different hiPSC lines. (G) Immunofluorescence analysis for TnT expression at P3 for hiPSC-CMs treated with DMSO (CTR) or CHIR. (H) Fold increase in TnT+ cells at each passage in CHIR-treated over DMSO treated cells for 4 indicated hiPSC lines. (I) Representative flow cytometry plots of TnT expression (green) and unstained controls (grey) in DMSO (CTR) and CHIR-treated cells over multiple passaging. (J) Average percentages of TnT+ cells from flow cytometric analysis in (I). (K) Representative confocal microscopy images of P3 (> day 28) CHIR-treated hiPSC-CMs at different phases of mitosis. (L) Quantification of proliferating hiPSC-CMs at distinct mitotic phases from (K). (M) Immunofluorescence image of Aurora B kinase expression in TnT+ cells undergoing cytokinesis. Scale bars represent 100μm, Bar charts represent mean±SD. *p<0.05 and **p<0.005 by unpaired t-test. Supplementary Table 1 specifies the replicates per experiment.
Figure 3:
Figure 3:
Phenotypic assessment of hiPSC-CMs following GSK-3β inhibition and removal of contact inhibition (A, B) Confocal microscopy images of P3 (D35) hiPSC-CMs treated with either DMSO (1:5000) (CTR) or CHIR (2.0 μM) since P0 and (for CHIR-treated cells in B) subsequently treated for 6 days with either continuation of CHIR (2.0 μM) or replacement of CHIR with C59 (2.0 μM) (CHIR>C59) and immunostained on micropatterned surfaces for the expression of troponin T (TnT) and sarcomeric α-actinin (α-SA) or phospho Histone H3 (pHH3). Treated hiPSC-CMs were micropatterned as single cells to adopt rectangular morphology with 7:1 aspect ratio. (C-D) Representative images of distribution of sarcomere alignment. Color codes represent angle of α-SA with respect to cellular long axis (e.g. Z-disc-registered α-SA angle = 90°) (n=10) (E) Contractility measurements in cells treated in (B). (F) Ca2+ transients (Fluo-4AM) fluorescence expressed relative to baseline [F/F0] in hiPSC-CMs at day (D) 42 in hiPSC-CMs treated with DMSO (CTR), CHIR (CHIR) or CHIR followed by C59 (CHIR>C59). Plots displaying the Ca2+ transient (G) Frequency, (H) Amplitude and Decay for each group. Fold increases in the expression of sarcomere (I), electrophysiological (J), and metabolic genes (K) at the indicated days in hiPSC-CMs treated with CHIR from D12 to D28 followed by either continued treatment with CHIR, CHIR withdraw (CHIR>CTR) or replacement of CHIR with C59 (CHIR>C59). (L) UMAP plots of day 12 hiPSC-CMs treated with DMSO (1:2500) (grey), CHIR (4.0 μM) (yellow), or C59 (4.0 μM) (black) for 24 hrs. (M) FeaturePlot of Wnt target genes. (N) Average expression of the selected mature cardiac genes normalized to CTR. (O) UMAP plots for cell cycle analysis, S-phase (S) (blue), G2/M-phase (G2M) (green) and G1-phase (red). (P) Bar graph of the percentage of cells in different cell cycle phases. Scale bars represent 100μm. Dot plots represent biological replicates and average. Bar charts represent mean. Graphs represent average±SD. *p<0.05 and **p<0.005 by unpaired t-test. NS=not significant. Supplementary Table 1 specifies the replicates per experiment.
Figure 4:
Figure 4:
Density-dependent CHIR-induced hiPSC-CM proliferation is uncoupled from YAP activity. (A) Representative immunofluorescence images for yes-associated protein (YAP) (green), cardiac troponin T (TnT) (cyan) and nuclei (red) in dense or sparse culture conditions. (B) Quantification of nuclear to cytoplasmic YAP ratios. Data are means ± SEM. ****p<0.0001 by unpaired t test. (C) Schematic displaying potential biophysical effects on sparse and dense cell culture. (D) Immunofluorescence for Ki67 (green), TnT (cyan) and nuclei (red) in hiPSC-CMs cultured on substrates with varying stiffness (kPa) or on tissue culture plastic (TCP) (~GPa). (E) Quantification of the percent Ki67+/TnT+ cells in D. (F, G) Effect of substrate stiffness on YAP localization. (F) Representative immunofluorescence images and (G) the quantification of nuclear/cytoplasmic ratios of YAP in hiPSC-CMs. (I, H) YAP localization in hiPSC-CMs cultured in sparse or dense culture conditions with or without YAP inhibitor Verteporfin (1.0 or 10 μM). (J, K) Representative immunofluorescence images and the quantification of Ki67+ (red), TnT+ (green) cells (blue) for the same conditions as in H. Data are means ± SEM. *p<0.05. ****p<0.0001 by One-way ANOVA Dunnett’s post hoc multiple comparisons to control “Sparse-DMSO” group. Supplementary Table 1 specifies the replicates per experiment.
Figure 5:
Figure 5:
CHIR and low-density plating activate β-catenin and AKT signaling to enhance hiPSC-CM proliferation via Cyclin D2-dependent kinases and prevent maturation via repression of sarcomere gene expression. (A) TOPFlash (TCF/LEF) luciferase analysis of hiPSC-CMs treated with CTR or CHIR with or without PNU74654 for 24 hrs. (B) Fold increase in TnT+ cell number after DMSO (CTR) or CHIR (2.0 μM) treatment with or without PNU74654 (32 μM). (C) Normalized gene expression of Wnt target genes and maturation markers. Note the complete recovery of maturation gene expression when canonical Wnt signaling is abolished by PNU74654 treatment. (D) A mini-screen of 43 kinase targets after CHIR treatment demonstrated an increase in phosphorylation (p) levels at AKT, HSP27, and others. (E) Confirmation of AKT T308 phosphorylation by western blot. Control lanes were removed. (F) Quantification of pAKT protein expression level after CHIR treatment. (G) Immunofluorescence analysis for pAKT T308 expression in TnT+ (green) day 20 hiPSC-CMs cultured for 6 days with the indicated treatment. (H, I) Quantification of the number of TnT+ (H) and pAKT T308+ (I) cells in G. (J) TOPFlash luciferase analysis of hiPSC-CMs after treatment of CHIR for 24 hrs with or without MK2206 (1.0 μM). (K) Expression of Wnt target genes and maturation markers after treatment with the indicated compounds. Note that AKT signaling is not changing the Wnt dependent maturation related gene expression. (L) A schematic diagram of the inhibitory relationship between GSK3 and downstream canonical Wnt signaling and their de-repression with CHIR. The role of PNU74654 to inhibit β-catenin-TCF/LEF activity is highlighted. Dashed lines indicate a correlation between AKT-CCND2. (M) Immunofluorescence analysis for Cyclin D2 (CCND2) (pink) expression in TnT+ (green) day 20 hiPSC-CMs cultured for 6 days with the indicated compounds. Quantification of the number of CCND2+/TnT+ cells per treatment group (N). (O) Immunofluorescence analysis for phospho Histone H3 (pHH3) (pink) and TnT (green) expression at day 20 hiPSC-CMs cultured for 6 days with the indicated compounds. Quantification of the number of pHH3+/TnT+ cells per treatment group (P). Scale bars represent 100μm, Dot plots represent biological replicates and average. Bar charts represent mean±SD. *p<0.05 and **p<0.005 by unpaired t-test. Supplementary Table 1 specifies the replicates per experiment.
Figure 6:
Figure 6:
Long-term GSK3β inhibition with low-density plating does not preclude hiPSC CMs terminal differentiation and maturation in functional cardiac tissue. (A) Immunofluorescence image of alpha-actinin (α-Act) and (B) qPCR analysis of sarcomeric gene expression in passage 4 (P4) expanded vs non-expanded hiPSC-CMs at day 42 (~D42) of differentiation. (C) Brightfield images of engineered heart tissues produced from non-expanded or P4 expanded hiPSC-CMs at ~D42 and further cultured for 25-days. (D) Brightfield image of engineered heart tissues in a 24-well plate format. (E) Immunofluorescence microscopy images of alpha-actinin (α-Act) and Troponin T (TnT) in cardiac tissue generated from previously expanded hiPSC-CMs. (F) Graphs displaying development of contraction force (mN), beating rate and time to peak (T1) in heart tissues generated from previously expanded (P4 CHIR>CTR) (yellow) or non-expanded (grey) hiPSC-CMs measured at time points between day (D) 5 tot 20. (G) Plots for contraction analysis (contraction force (mN), beating rate, time to peak (T1), relaxation time (s), resting length (mm), contraction velocity (mN/s) in engineered heart tissue 14 days after formation for the indicated treatment and hiPSC lines. Scale bars represent 100μm. Bar charts represent mean±SD. Dot plots represents biological replicates and mean±SEM. *p<0.05 by unpaired t-test. Supplementary Table 1 specifies the replicates per experiment.

References

    1. Bassat E, Mutlak YE, Genzelinakh A, Shadrin IY, Umansky KB, Yifa O, Kain D, Rajchman D, Leach J, Bassat DR, et al. (2017). The extracellular matrix protein agrin promotes heart regeneration in mice. Nature 547, 179–184. - PMC - PubMed
    1. Bersell K, Arab S, Haring B, and Kühn B (2009). Neuregulin1/ErbB4 signaling induces cardiomyocyte proliferation and repair of heart injury. Cell 138, 257–270. - PubMed
    1. Beurel E, Grieco SF, and Jope RS (2015). Glycogen synthase kinase-3 (GSK3): regulation, actions, and diseases. Pharmacol. Ther 148, 114–131. - PMC - PubMed
    1. Birket MJ, Ribeiro MC, Verkerk AO, Ward D, Leitoguinho AR, den Hartogh SC, Orlova VV, Devalla HD, Schwach V, Bellin M, et al. (2015). Expansion and patterning of cardiovascular progenitors derived from human pluripotent stem cells. Nat. Biotechnol 33, 970–979. - PubMed
    1. Buikema JW, Zwetsloot P-PM, Doevendans PA, Sluijter JPG, and Domian IJ (2013a). Expanding Mouse Ventricular Cardiomyocytes through GSK-3 Inhibition. Curr Protoc Cell Biol 61, 23.9.1–23.9.10. - PMC - PubMed

Publication types

Substances