. 2020 Jul 22;11(1):11-24.e4.
doi: 10.1016/j.cels.2020.05.012. Epub 2020 Jun 2.

Ultra-High-Throughput Clinical Proteomics Reveals Classifiers of COVID-19 Infection

Affiliations

Ultra-High-Throughput Clinical Proteomics Reveals Classifiers of COVID-19 Infection

Christoph B Messner et al. Cell Syst. .

Abstract

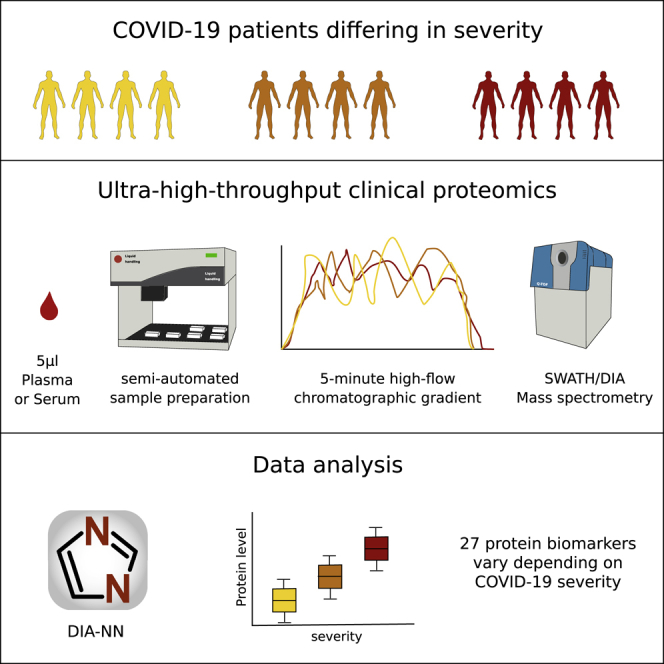
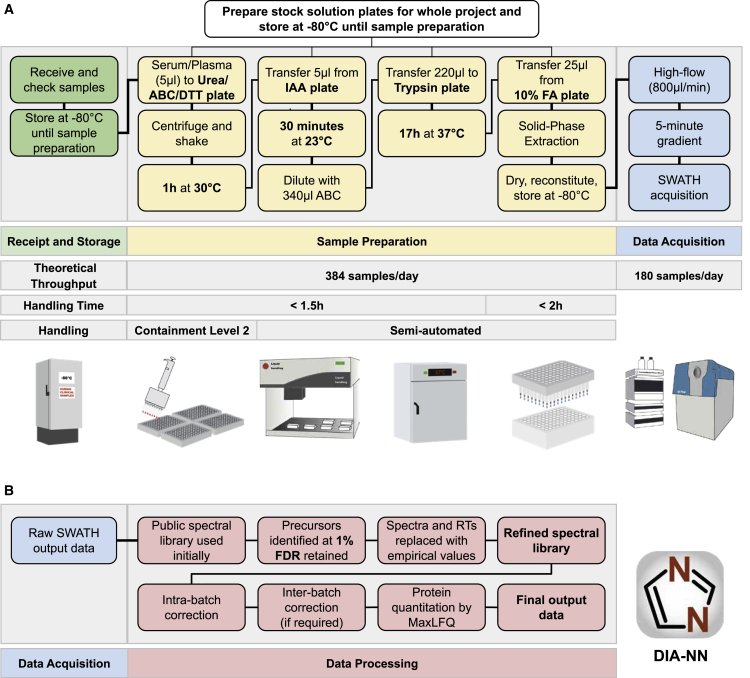
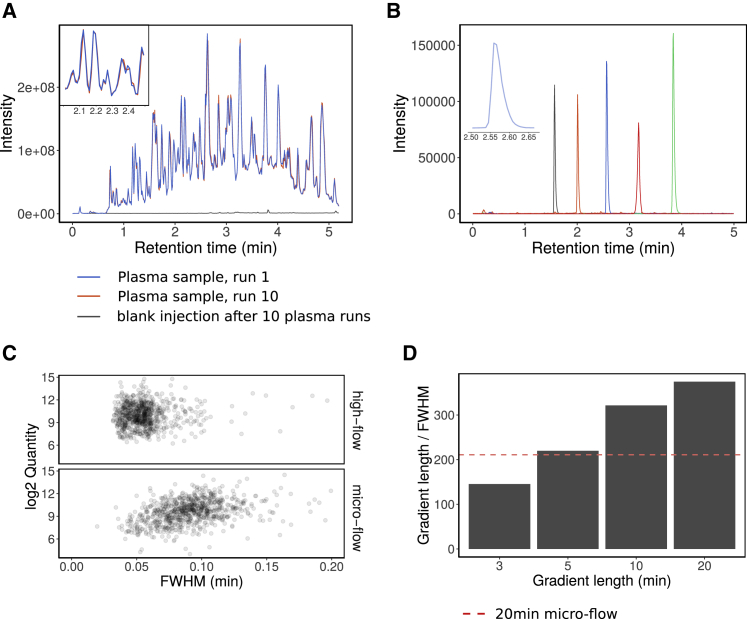
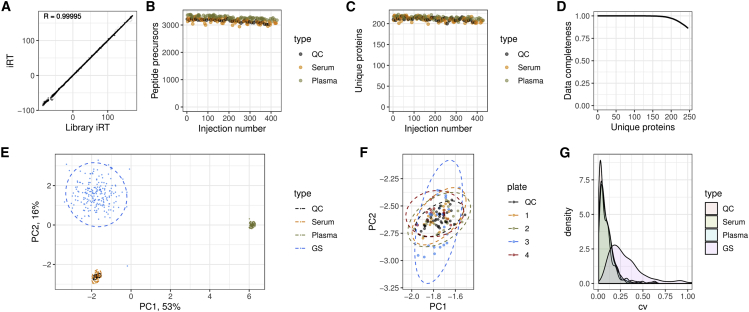
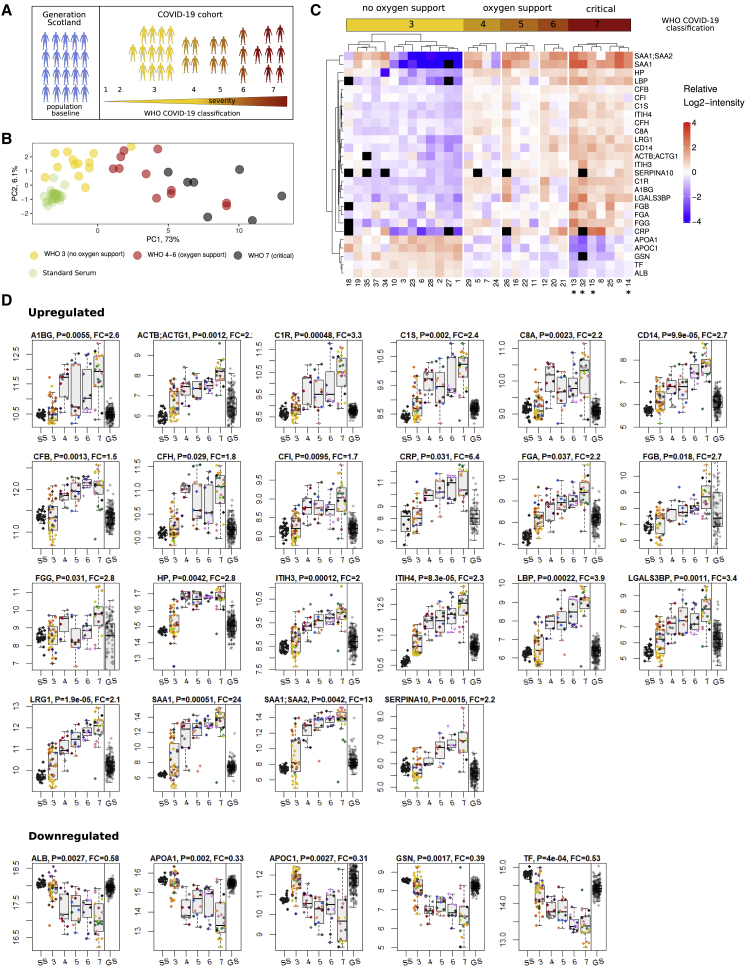
The COVID-19 pandemic is an unprecedented global challenge, and point-of-care diagnostic classifiers are urgently required. Here, we present a platform for ultra-high-throughput serum and plasma proteomics that builds on ISO13485 standardization to facilitate simple implementation in regulated clinical laboratories. Our low-cost workflow handles up to 180 samples per day, enables high precision quantification, and reduces batch effects for large-scale and longitudinal studies. We use our platform on samples collected from a cohort of early hospitalized cases of the SARS-CoV-2 pandemic and identify 27 potential biomarkers that are differentially expressed depending on the WHO severity grade of COVID-19. They include complement factors, the coagulation system, inflammation modulators, and pro-inflammatory factors upstream and downstream of interleukin 6. All protocols and software for implementing our approach are freely available. In total, this work supports the development of routine proteomic assays to aid clinical decision making and generate hypotheses about potential COVID-19 therapeutic targets.

Keywords: COVID-19 infection; SWATH-MS; antiviral immune response; clinical classifiers; high-throughput proteomics; mass spectrometry.


Conflict of interest statement

Declaration of Interests The authors declare no competing interests.

Figures

None
Graphical abstract
Figure 1
Figure 1
A High-Throughput Proteomics Platform for Large-Scale and Longitudinal Clinical Proteomic Studies (A) Experimental part of the workflow. Receipt and storage (green boxes): clinical or epidemiological samples are collected using a standard operating procedure, received, and stored at −80°C, then aliquoted to 96-well plates alongside control samples. For plasma and serum, 5 μL are processed and yield sufficient tryptic digest for five measurements on the high-flow rate LC-MS platform. Sample preparation (yellow boxes): the sample preparation workflow is designed for handling 384 samples per batch (four 96-well plates). Batch effects are mitigated by using pre-aliquoted stock solution plates—prepared for whole projects and stored at −80°C—that enter the workflow at different steps, as well as by using a liquid handling robot for pipetting and mixing. Sample cleanup is done with 384 samples/batch by using 96-well solid-phase extraction plates (BioPureSPE, the Nest Group) and a liquid handler for pipetting. The hands-on time for cleanup is <2 h and although the digestion is done overnight, the total hands-on time for the sample preparation is <3.5 h. Data acquisition (blue boxes): ultra-fast measurements of the digested samples are facilitated in 300-s chromatographic gradients using high-flow chromatography (800 μL/min) with a short reversed phase C18 column (50 × 2.1 mm, 1.8 μm particle size) to accelerate equilibration and washing steps. A 700 ms duty cycle, required to record sufficient data points per chromatographic peaks that elute at FWHM of about 3 s is achieved with an optimized SWATH data acquisition method. The theoretical throughput of data acquisition for one mass spectrometer is 180 samples/day. (B) Data processing (red boxes): the analysis of the highly complex short-gradient DIA data is achieved with an optimized version (1.7.10) of DIA-NN (Demichev et al., 2020). DIA-NN is based on neural networks to enable confident peptide identification with fast gradients and achieves a throughput of >2,000 samples/day on a conventional PC. First, a spectral library is automatically “refined” using the dataset in question: only detectable peptide precursors are retained, and their reference spectra and retention times are replaced with empirically observed. Reanalysis with this refined library is then followed by batch correction and, finally, protein quantification using MaxLFQ (Cox et al., 2014). Abbreviations: ABC, ammonium bicarbonate; DTT, dithiothreitol; IAA, iodoacetamide; FA, formic acid.
Figure 2
Figure 2
High-Flow LC and Its Application to Short-Gradient MS-Based Proteomics (A) A tryptic digest of human blood plasma was injected 10 times. The peptides were separated with a 300 s linear water to acetonitrile chromatographic gradient using an Agilent 1290 Infinity II LC system coupled to a TripleTOF 6600 mass analyzer. The TICs of the first and last injection were overlaid and colored with blue and red, respectively. The time from the start of one run to the next was reduced to 8 min (including instrument overheads), which enables a throughput of ~180 samples/day. After the 10 plasma injections, water was injected and the TIC (black line) shows no significant carryover despite the short washing time. (B) Extracted ion chromatograms of 5 synthetic peptides (AETSELHTSLK [m/z 408.55, black line], LDSTSIPVAK [m/z 519.80, orange line], ALENDIGVPSDATVK [m/z 768.90, blue line], AVYFYAPQIPLYANK [m/z = 883.47, green line], and TVESLFPEEAETPGSAVR [m/z 964.97741, red line]) from a synthetic peptide mixture (Pepcal, Sciex) as separated on the 300 s linear gradient. Chromatograms were extracted from TOF MS data, width = 0.1 Da. (C) A tryptic digest of K562 human cell lines was separated with a 20-min linear gradient ramping from 3% ACN 0.1% FA to 36% ACN, 0.1% FA on high-flow (800 μL/min; C18 column 50 mm × 2.1, column length). Peak widths at FWHM of the eluting peptides were compared to a 20-min micro-flow run (5 μL/min; 15-cm column; Demichev et al., 2020), analyzed on the same mass spectrometer (Sciex TripleTOF 6600). (D) Peak capacities (gradient length divided by FWHM) for 3, 5, 10, and 20-min linear gradients (3% ACN/0.1% FA to 36% ACN/0.1% FA) on high-flow compared with 20-min micro-flow chromatographic gradients (red dashed line).
Figure 3
Figure 3
Robustness and Quantitative Precision of the Proteomic Platform Applied to a Population-Based Epidemiological Cohort 409 serum proteomes were analyzed for characterizing 199 participants of the GS study. The sample series are composed of 39 repeat injections (“QC”), 79 serum and 91 plasma commercial sample preparation controls, and 200 serum samples derived from the 199 participants of the GS study (“GS”). (A) Overlaid aligned retention times (Biognosys iRT scale) of all peptide identifications in the whole experiment. Median iRT standard deviation (SD) was 0.22 (relative SD = 0.0009) and correlation between the observed iRT and library iRT was 0.99995, indicating very high retention time stability. (B and C) (B) Numbers of peptide precursors and (C) unique proteins identified in control samples. (D) Data completeness in the whole experiment plotted against the number of proteins identified. The data completeness for all 245 unique proteins was 87%, whereas 182 proteins were identified with data completeness 99%. (E) PCA using consistently identified proteins (log-transformed quantities). (F) The “serum” cluster on the PCA plot, with samples prepared on different 96-well plates colored differently. No bias between the plates can be detected. (G) CV. After accounting for instrument drift, median CV values are 5.4% for replicate injections (“QC”), 7.6% for serum controls, 7.3% for plasma controls, and 25.6% for the participants' samples.
Figure 4
Figure 4
Protein Signatures Indicate Clinical Severity in COVID-19 (A) Study design. 199 random individuals from the GS study were measured to assess the performance of the platform and to obtain a population baseline. Protein responses based on COVID-19 severity were obtained from a cohort of 31 hospitalized SARS-CoV-2 infected patients. Severity of COVID-19 was graded using the WHO ordinal outcome scale of clinical improvement (World Health Organization, 2020). (B) PCA based on proteins found differentially expressed depending on COVID-19 severity. Median quantities across all time points were calculated for each patient and 29 proteins without missing values were used to generate the PCA plot (quantities were standardized). Cases with the severity “3” on the WHO scale (hospitalized, no oxygen therapy) are well separated from cases with the severity “7” along the first principle component, with “4”–“6” cases in between. (C) Heatmap shows protein signatures that report on COVID-19 severity. Visualization was performed using the ComplexHeatmap R package (Gu et al., 2016). Black “squares” indicate missing values. Patients labeled with an asterisk () had a fatal outcome of the disease. (D) Proteins upregulated (top panel) and downregulated (lower panel) depending on COVID-19 severity (WHO grade; SS, standard serum; GS, Generation Scotland), as well as the population spread of the protein abundance in 199 randomly selected individuals of an independent cohort (Generation Scotland; GS). As the absolute quantities from the COVID-19 and GS studies cannot be compared directly (samples were obtained in a different manner), we simplified the visual assessment of the population spread, by normalizing by the median of GS quantities to the median of WHO grade 3 (no oxygen support) COVID-19 cases (the normalized values were used for illustration purposes only and not used for testing for statistical significance). The boxes show first and third quartile as well as the median (middle) and the whiskers extend to the most extreme data point, which is no more than 1.5 times the interquartile range from the box. Proteins upregulated with increasing severity of COVID-19: A1BG, ACTB;ACTG1, C1R (complement C1r), C1S (complement C1s), C8A (complement C8 alpha chain), CD14 (monocyte differentiation antigen CD14), CFB (complement factor B), CFH (complement factor H), CFI, CRP, FGA, FGB and FGG, HP, ITIH3, ITIH4, LBP, LGALS3BP, LRG1, SAA1, SAA1;SAA2, and SERPINA10; proteins downregulated with increasing severity of COVID-19: ALB, APOA1, APOC1, GSN, and TF.

References

    1. Ahadi S., Zhou W., Schüssler-Fiorenza Rose S.M., Sailani M.R., Contrepois K., Avina M., Ashland M., Brunet A., Snyder M. Personal aging markers and ageotypes revealed by deep longitudinal profiling. Nat. Med. 2020;26:83–90. - PMC - PubMed
    1. Anas A., van der Poll T., de Vos A.F. Role of CD14 in lung inflammation and infection. Crit. Care. 2010;14:209. - PMC - PubMed
    1. Anderson N.L., Anderson N.G. The human plasma proteome: history, character, and diagnostic prospects. Mol. Cell. Proteomics. 2002;1:845–867. - PubMed
    1. Asare-Werehene M., Communal L., Carmona E., Le T., Provencher D., Mes-Masson A.M., Tsang B.K. Pre-operative circulating plasma gelsolin predicts residual disease and detects early stage ovarian cancer. Sci. Rep. 2019;9:13924. - PMC - PubMed
    1. Bache N., Geyer P.E., Bekker-Jensen D.B., Hoerning O., Falkenby L., Treit P.V., Doll S., Paron I., Müller J.B., Meier F. A novel LC system embeds analytes in pre-formed gradients for rapid, ultra-robust proteomics. Mol. Cell. Proteomics. 2018;17:2284–2296. - PMC - PubMed

Publication types

MeSH terms