. 2020 Aug 26;11(2):176-185.e6.
doi: 10.1016/j.cels.2020.06.006. Epub 2020 Jul 2.

Quantitative Translation of Dog-to-Human Aging by Conserved Remodeling of the DNA Methylome

Affiliations

Quantitative Translation of Dog-to-Human Aging by Conserved Remodeling of the DNA Methylome

Tina Wang et al. Cell Syst. .

Abstract

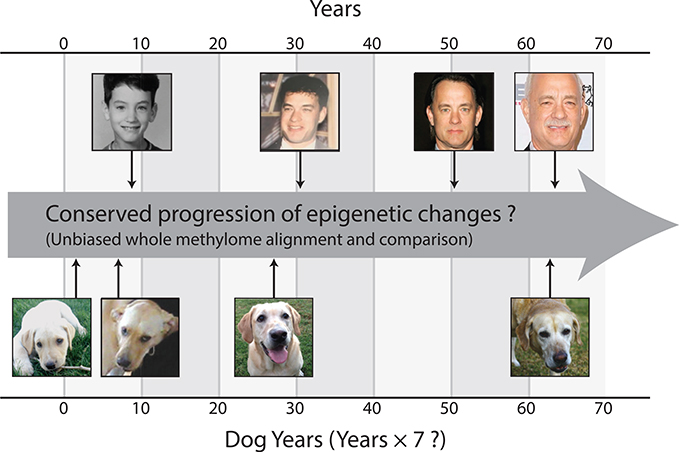
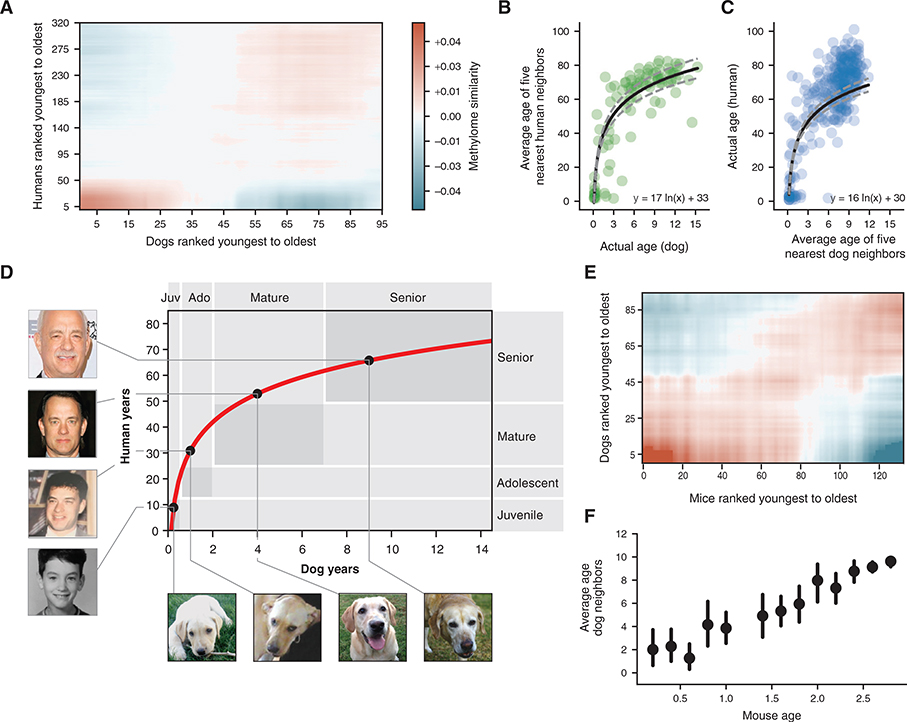
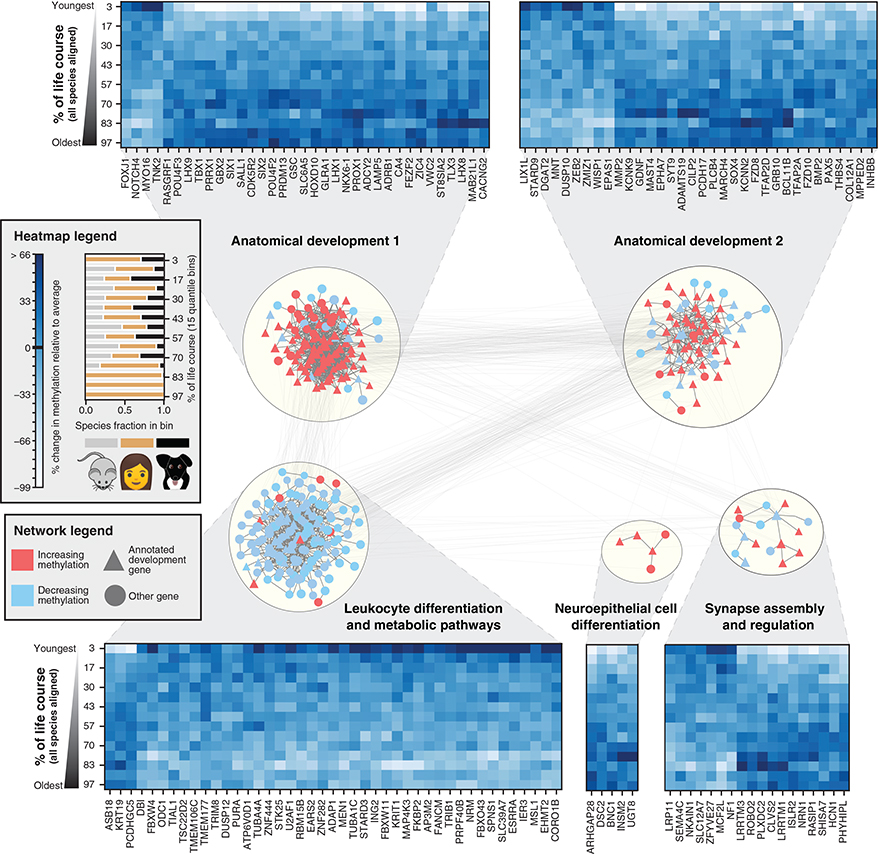
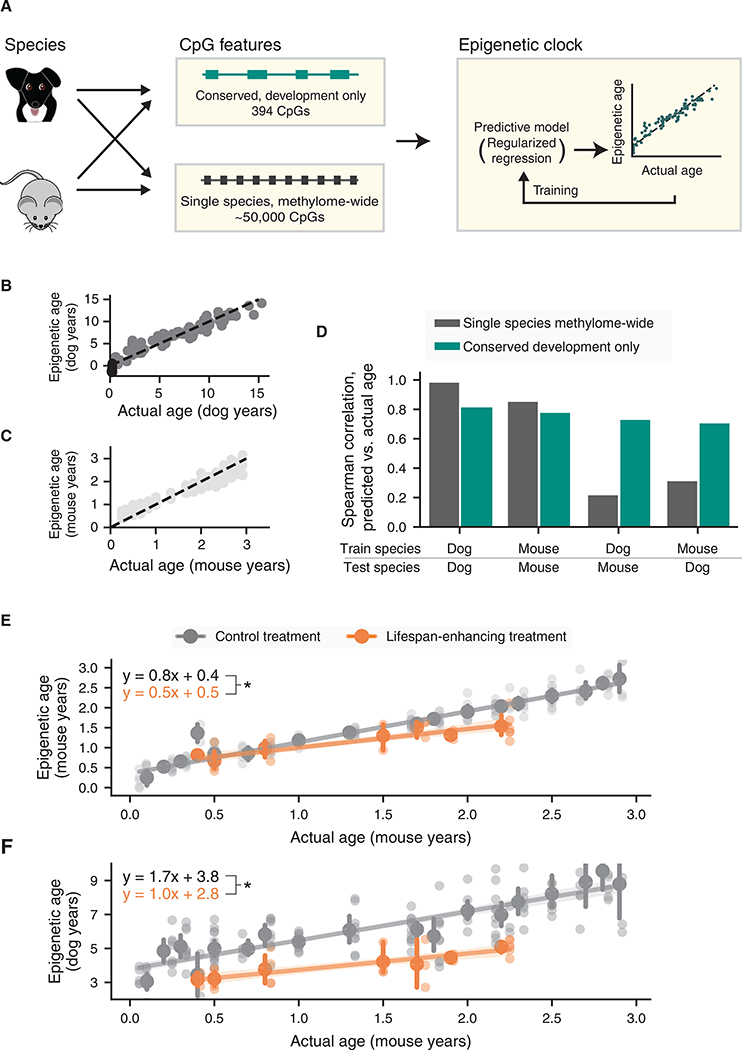
All mammals progress through similar physiological stages throughout life, from early development to puberty, aging, and death. Yet, the extent to which this conserved physiology reflects underlying genomic events is unclear. Here, we map the common methylation changes experienced by mammalian genomes as they age, focusing on comparison of humans with dogs, an emerging model of aging. Using oligo-capture sequencing, we characterize methylomes of 104 Labrador retrievers spanning a 16-year age range, achieving >150× coverage within mammalian syntenic blocks. Comparison with human methylomes reveals a nonlinear relationship that translates dog-to-human years and aligns the timing of major physiological milestones between the two species, with extension to mice. Conserved changes center on developmental gene networks, which are sufficient to translate age and the effects of anti-aging interventions across multiple mammals. These results establish methylation not only as a diagnostic age readout but also as a cross-species translator of physiological aging milestones.

Keywords: aging; canine; dog; epigenetic aging; epigenetic clock; epigenetics; epigenome; evolution; methylation; methylome.


Conflict of interest statement

Declaration of Interests T.I. is co-founder of Data4Cure Inc, is on the Scientific Advisory Board, and has an equity interest. T.I. is on the Scientific Advisory Board of Ideaya Biosciences, has an equity interest, and receives sponsored research funding. The terms of these arrangements have been reviewed and approved by the University of California San Diego in accordance with its conflict of interest policies. T.I. and T.W. hold a patent entitled “Methylome profiling of animals and uses thereof,” international patent application #PCT/US18/49103, US application #16/638,454.

Figures

Figure 1.
Figure 1.. Physiological versus Epigenetic Change during Development and Aging
Aging yields similar physiological changes in humans and dogs, yet these changes occur along different time scales. Are these different timescales reflected in the progression of epigenetic changes observed during aging? If so, is this progression consistent with the adage “one dog year equals seven human years,” or does it suggest a different cross-species alignment of time?
Figure 2.
Figure 2.. Interrogating Mammalian Methylomes by Syntenic Bisulfite Sequencing (SyBS)
(A) Strategy used to profile and compare CpG methylation states within blocks of synteny in the mammalian genome. Capture oligonucleotide design: regions of DNA (blue blocks) characterized by the Illumina 450K methylation array in humans are mapped to their syntenic region in dogs using whole-genome alignments between the two species. These regions are used to design oligonucleotides (yellow stars) for capture and enrichment of DNA in the second species. Data generation: A sequencing library is constructed from high quality DNA and bisulfite converted, analogously to WGBS. Syntenic sequences are captured, sequenced, and aligned to the mammalian genome under study. CpG methylation values are called and then filtered to select those conserved with humans for further analysis. For more details see STAR Methods. (B) Pie charts showing representation of targeted genomic regions. Regions exhibiting significant enrichment (p < 10−10) are indicated using asterisks with * indicating odds ratio > 2.5 and ** odds ratio > 4. UTR, untranslated region; TSS, transcription start site. (C) Ten dog methylomes were sequenced twice, either with enrichment for syntenic regions (SyBS hybridization) or without enrichment (WGBS). Methylation values (per CpG site per animal) are shown for SyBS (y axis) versus WGBS (x axis). Sites were considered if they were covered by >5 reads with both SyBS and WGBS. (D) Concordance of SyBS values for one canine DNA sample (S1), for which two independent captures were performed. In (C) and (D) the color captures the density of observations at each point (darker colors represent higher densities), and the r value is the Pearson correlation. (E) Average coverage of syntenic segments versus total reads in millions, contrasting SyBS with RRBS.
Figure 3.
Figure 3.. A Nonlinear Transformation from Dog-to-Human Age
(A) Dog-human methylome similarities (Pearson correlation, blue-red color range) are shown with dogs and humans ranked from youngest to oldest. Data are lightly smoothed in both dimensions using Gaussian interpolation in matplotlib. (B) The age of each dog methylome (x axis) is plotted against the average age of the five nearest human methylomes (y axis), 95 dogs are depicted. (C) Reciprocal plot in which the age of each human methylome (y axis) is plotted against the average age of the five nearest dog methylomes (x axis), 320 humans are depicted. (D) Logarithmic function for epigenetic translation from dog age (x axis) to human age (y axis). Outlined boxes indicate the approximate age ranges of major life stages as documented qualitatively based on common aging physiology. Juvenile refers to the period after infancy and before puberty, 2–6 months in dogs, 1–12 years in humans; adolescent refers to the period from puberty to completion of growth, 6 months to 2 years in dogs, approximately 12–25 years in humans; Mature refers to the period from 2–7 years in dogs and 25–50 years in humans; Senior refers to the subsequent period until life expectancy, 12 years in dogs, 70 years in humans. Dog life stages are based on veterinary guides and mortality data for dogs (Fleming et al., 2011; Bartges et al., 2012; Inoue et al., 2015). Human life stages are based on literature summarizing life cycle and lifetime expectancy (Bogin and Smith, 1996; CIA, 2013; Arias et al., 2017). Black dots on the curve connect to images of the same yellow Labrador taken at four different ages (courtesy of Sabrina and Michael Mojica, with permission) and to images of a representative human at the equivalent life stages in human years (photos of Tom Hanks drawn from a public machine-learning image repository, Chen et al., 2015). (E) Mouse-dog methylome similarities shown as in (A). (F) Data from (E) are summarized by sorting mice according to 0.2-year bins (x axis) and, for each mouse, plotting the average age of the 5 nearest dogs by methylome similarity (y axis). Points illustrate the mean of each bin and bars represent the 95% confidence interval obtained from bootstrapping.
Figure 4.
Figure 4.. Conserved Lifetime Methylation Changes Aggregate in Developmental Networks
Genes exhibiting conserved age-related methylation behavior were mapped onto a composite molecular interaction network which was subsequently clustered to reveal five major modules, labeled according to enriched Gene Ontology functions (STAR Methods). Colors represent the conserved direction of change with age, with red representing genes that increase in methylation with age and blue representing genes that decrease in methylation with age. Heatmaps show the conserved methylation patterns of a random subset of genes in each module. Columns represent distinct orthologs, while rows represent the average values of all species ranked according to their age in human years and divided into 15 age bins (quantiles). Values are normalized according to the mean and standard deviation of methylation for each ortholog. The fractional species composition of each bin is visualized in the legend.
Figure 5.
Figure 5.. A Conserved Development Clock Measuring Age and Physiological Aging
(A) Construction of epigenetic clocks. Four clocks are constructed, depending on whether the training data are from dogs or mice and whether the input features are from all methylome-wide CpGs or from CpGs in conserved developmental modules only. All four cases yield a regression model for predicting age from CpG markers (STAR Methods). (B) Scatterplot of predicted versus actual ages for the dog methylome-wide model. (C) Scatterplot of predicted versus actual ages for the mouse methylome-wide model. (D) Performance of single species methylome-wide clocks (gray) or conserved developmental clocks (turquoise) as measured by the Spearman correlation between predicted and actual ages within species or across species. (E) The conserved development clock distinguishes the effects of lifespan-enhancing treatments (orange) from control treatments (gray). For each treatment, mouse epigenetic ages are measured (y axis; conserved development clock trained in mice) and plotted against actual mouse ages binned in 0.1-year bins (x axis). Mean ± 95% confidence intervals shown for each bin and each observation. (F) As for (E) but training the conserved development clock using data for dogs. For each treatment (orange lifespan-enhancing; gray control), epigenetic ages of each mouse are measured and plotted against actual mouse ages binned in 0.1-year bins (x axis). * denotes p < 0.05 in all panels.

Comment in

  • From dog days to human years.
    Clyde D. Clyde D. Nat Rev Genet. 2020 Sep;21(9):508-509. doi: 10.1038/s41576-020-0267-3. Nat Rev Genet. 2020. PMID: 32681033 No abstract available.

References

    1. Alisch RS, Barwick BG, Chopra P, Myrick LK, Satten GA, Conneely KN, and Warren ST (2012). Age-associated DNA methylation in pediatric populations. Genome Res. 22, 623–632. - PMC - PubMed
    1. Andrews S, et al. (2010). FastQC: a quality control tool for high throughput sequence data.
    1. Arias E, Heron M, and Xu J (2017). United States life tables, 2013. Natl Vital Stat. Rep. 66, 1–64. - PubMed
    1. Aryee MJ, Jaffe AE, Corrada-Bravo H, Ladd-Acosta C, Feinberg AP, Hansen KD, and Irizarry RA (2014). Minfi: a flexible and comprehensive Bioconductor package for the analysis of infinium DNA methylation microarrays. Bioinformatics 30, 1363–1369. - PMC - PubMed
    1. Ashburner M, Ball CA, Blake JA, Botstein D, Butler H, Cherry JM, Davis AP, Dolinski K, Dwight SS, Eppig JT, et al. (2000). Gene ontology: tool for the unification of biology. The gene ontology consortium. Nat. Genet. 25, 25–29. - PMC - PubMed

Publication types