. 2020 Oct 1:344:108834.
doi: 10.1016/j.jneumeth.2020.108834. Epub 2020 Jun 30.

Noninvasive three-state sleep-wake staging in mice using electric field sensors

Affiliations

Noninvasive three-state sleep-wake staging in mice using electric field sensors

H Kloefkorn et al. J Neurosci Methods. .

Abstract

Study objective: Validate a novel method for sleep-wake staging in mice using noninvasive electric field (EF) sensors.

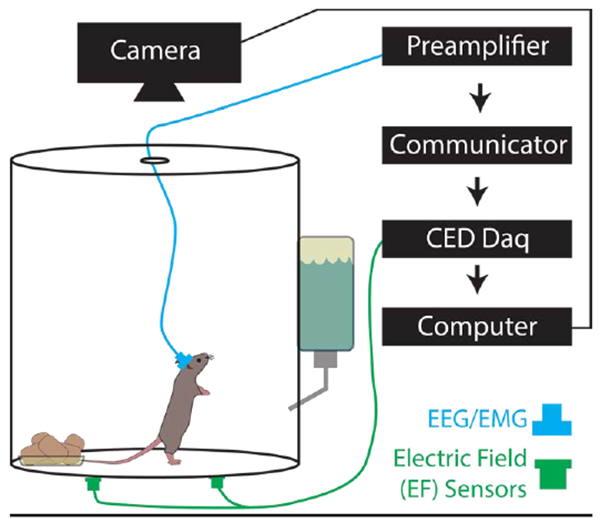
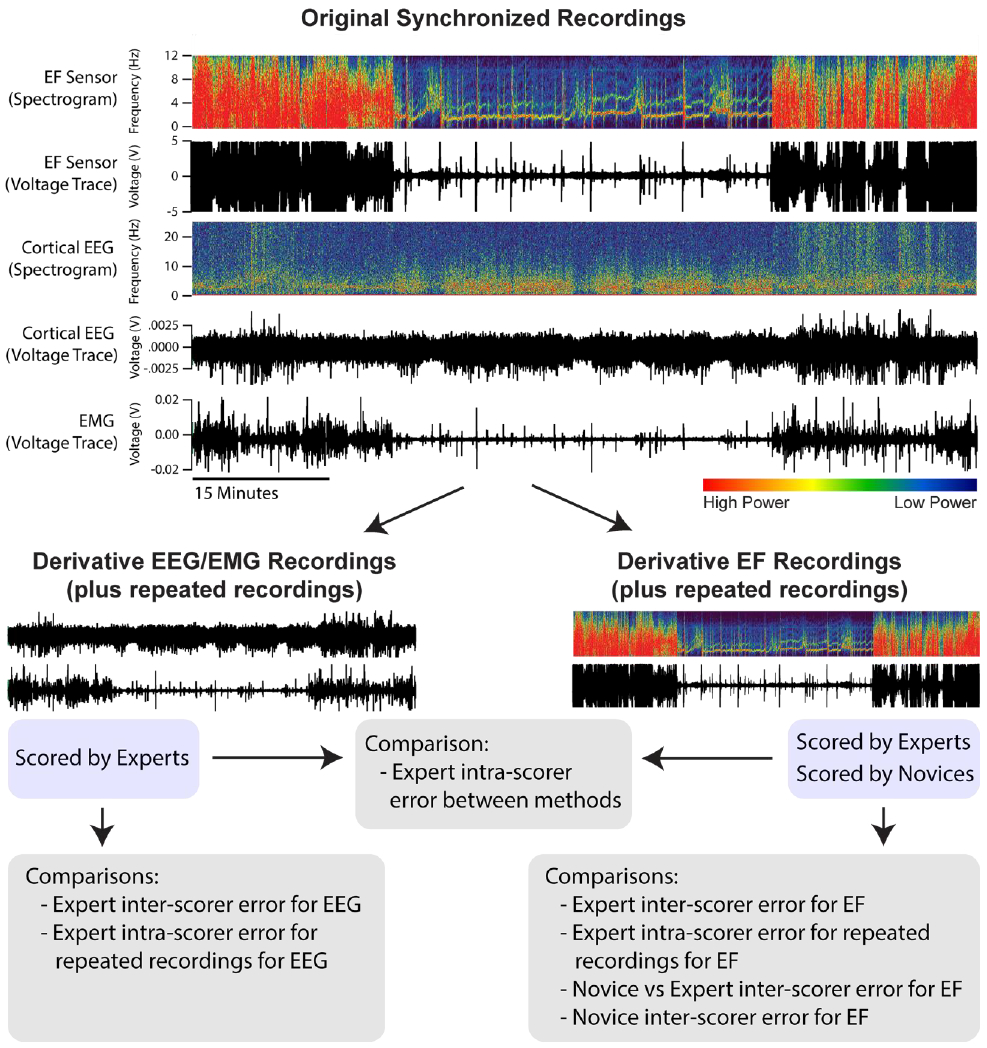
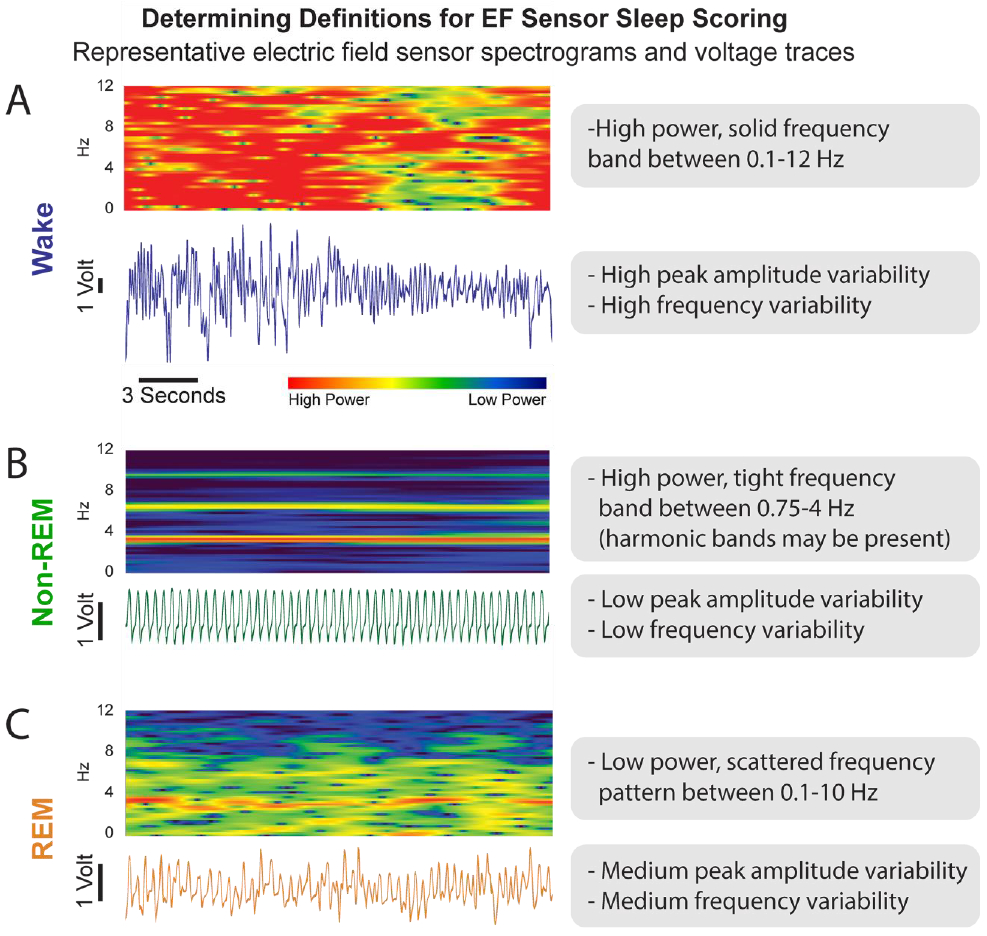
Methods: Mice were implanted with electroencephalogram (EEG) and electromyogram (EMG) electrodes and housed individually. Noninvasive EF sensors were attached to the exterior of each chamber to record respiration and other movement simultaneously with EEG, EMG, and video. A sleep-wake scoring method based on EF sensor data was developed with reference to EEG/EMG and then validated by three expert scorers. Additionally, novice scorers without sleep-wake scoring experience were self-trained to score sleep using only the EF sensor data, and results were compared to those from expert scorers. Lastly, ability to capture three-state sleep-wake staging with EF sensors attached to traditional mouse home-cages was tested.

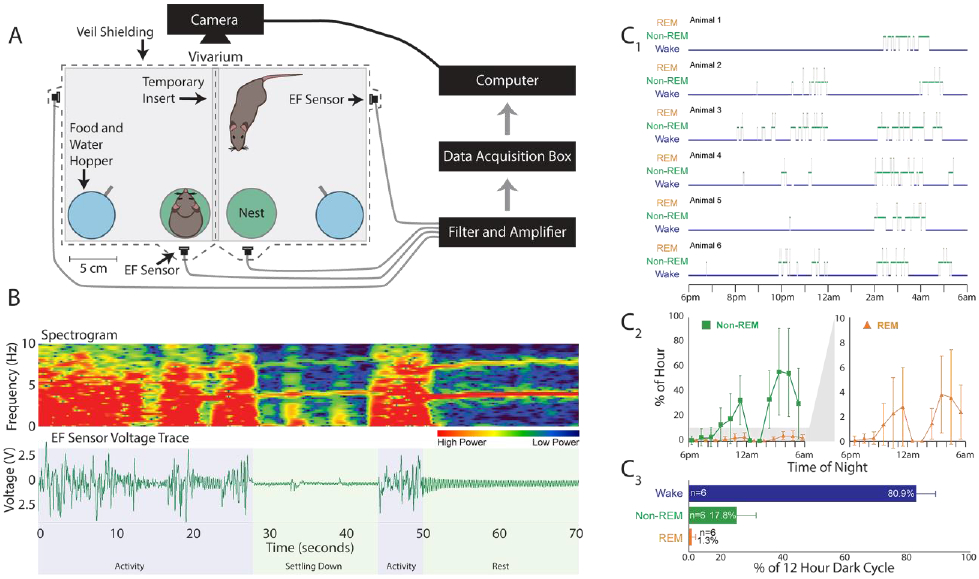
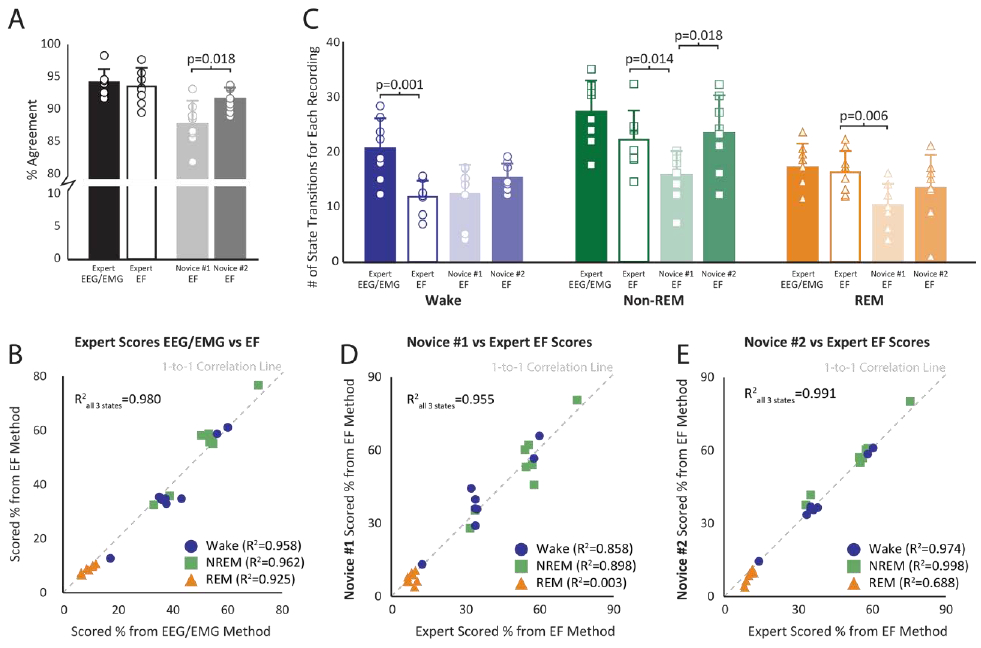
Results: EF sensors quantified wake, rapid eye movement (REM) sleep, and non-REM sleep with high agreement (>93%) and comparable inter- and intra-scorer error as EEG/EMG. Novice scorers successfully learned sleep-wake scoring using only EF sensor data and scoring criteria, and achieved high agreement with expert scorers (>91%). When applied to traditional home-cages, EF sensors enabled classification of three-state (wake, NREM and REM) sleep-wake independent of EEG/EMG.

Conclusions: EF sensors score three-state sleep-wake architecture with high agreement to conventional EEG/EMG sleep-wake scoring 1) without invasive surgery, 2) from outside the home-cage, and 3) and without requiring specialized training or equipment. EF sensors provide an alternative method to assess rodent sleep for animal models and research laboratories in which EEG/EMG is not possible or where noninvasive approaches are preferred.

Keywords: 3-State sleep; Electric field sensor; Noninvasive; REM Sleep; Rodent; Sleep-wake scoring.


Conflict of interest statement

Declaration of Competing Interest Financial Disclosure: HK, WG, and SH are co-inventors of US patent application 16/095,906, filed 10/23/2018, that includes use of EF sensor methodology for non-contact physio-behavioral monitoring of movements including respiration. NPP is a member of the scientific advisory board for Dixi Medical USA (unrelated to this work).

Figures

Figure 1.
Figure 1.. Cage Set-up for Electroencephalogram/Electromyogram (EEG/EMG) and Synchronized Electric Field (EF) Recordings.
The animals were singly housed in cylindrical acrylic chambers (150 oz. 8 inch diameter, 8 inches tall). Head stages (blue) were surgically mounted prior to recordings and contain EEG and EMG electrodes connected to a preamplifier, communicator, then a Cambridge data acquisition box (CED Power 1401). EF sensors (green) were attached to the exterior of the cage bottom approximately 2-3 inches from the cage wall and connected directly to the Power 1401.
Figure 2.
Figure 2.. Recording Set-Up for and Creating Definitions for Scoring.
Each recording is created as synchronous voltage traces from electric field (EF), electroencephalogram (EEG), and electromyogram (EMG). As an example, one EF and EEG voltage trace are also represented as a spectrogram – a graphic in which the x-axis is time, the y-axis is frequency, and the color intensity denotes the power of respective frequencies present in the voltage trace. Each synchronized recording (8 total) is divided into two files that contain either the EEG/EMG or EF voltage traces for subsequent scoring and comparison.
Figure 3.
Figure 3.. Wake, Non-REM Sleep, and REM Sleep Features are Unique for Electric Field (EF) Sensor Voltage Trace and Spectrogram.
A) The EF sensor wake state data appears as both a spectrogram (top) and voltage trace (bottom in blue). Each voltage trace is the direct output from the EF sensors and represent animal movement. B) EF data for non-REM sleep (green) behavior. C) EF data for REM sleep (orange) behavior.
Figure 4.
Figure 4.. Home-Cage Set-up with only Electric Field (EF) Sensors and Description of 12-Hour Dark Cycle Sleep-Wake Staging.
A) Home-cage set-up in which the animals are separated by a transparent shielded insert during testing that allows visual, olfactory, and thermal interactions between the animals. Each animal has free access to food and water and a 60 mm Petri dish to use as a nest. The electric field (EF) sensors are attached to the home-cage exterior and connected to a filter/amplifier box, an Axon instruments data acquisition box, then to the computer. B) Representative spectrogram and raw voltage trace from home-cages that are indistinguishable from the data collected on the electroencephalogram/electromyogram (EEG/EMG) validation cages. C1) three-state hypnogram describing the sleep results for 6 animals recorded overnight between 6pm and 6am. C2) The average percentage of sleep (non-rapid eye movement – non-REM – sleep plus REM sleep time) of all 6 animals per hour over the 12 hours. C3) The 12-hour average of all 6 animals for each arousal state. Data are presented as mean ± standard deviation.
Figure 5.
Figure 5.. Agreement Between Electric Field (EF) and Electroencephalogram/Electromyogram (EEG/EMG) Sleep-Wake Scoring Methods.
A) The black and white bars represent expert intra-scorer agreement for both electric field (EF) and electroencephalogram/electromyogram (EEG/EMG) methods. The light and dark gray bars represent novice agreements with expert scores for the EF sleep-wake scoring method. The bars represent the mean ± standard deviation. The circles represent the specific results from each of the 8 files. B) A correlation between the EEG/EMG and EF three-state sleep-wake scoring results for each of the 8 files. Percent time spent in wake (blue circle), non-rapid eye movement (non-REM) sleep (green square), and REM sleep (orange triangle) were calculated for each file and represent the average score from the three expert scorers. C) Bar (mean ± standard deviation) and raw data for each recording representing the number of calculated state transitions for each scoring method (EF vs EEG/EMG) and scorer skill (novice vs expert). D) Novice #1’s three-state scoring results for each file plotted against the average three expert scorers’ results for the EF sensor method. Novice #1 self-trained using only the Supplement 2 document. E) Novice #2’s three-state scoring results for each file plotted against the average three expert scorers’ results for the EF method. Novice #2 used both Supplement 2 and Supplement 3 to iteratively self-train and improve sleep skill prior to scoring data.

References

    1. Ramar K, Olson EJ. Management of Common Sleep Disorders. Am Fam Physician. 2013;88(4):231–238. - PubMed
    1. Irwin MR. Why Sleep is Important for Health: a Psychoneuroimmunology Perspective. Annu Rev Psychol. 2016;66:143–172. doi:10.1146/annurev-psych-010213-115205. - DOI - PMC - PubMed
    1. Jensen MP, Hirsh AT, Molton IR, Bamer AM. Sleep Problems in Individuals With Spinal Cord Injury: Frequency and Age Effects. Rehabil Psychol. 2010;54(3):323–331. doi:10.1037/a0016345. - DOI - PMC - PubMed
    1. Sadeh A Sleep assessment methods. Monogr ofthe Soc Res Child Dev. 2015;80:33–48. - PubMed
    1. Douglas NJ, White DP, Pickett CK, Weil J V, Zwillich C. Respiration during sleep in normal man. Thorax. 1982;37:840–844. - PMC - PubMed

Publication types

LinkOut - more resources