

Review
doi: 10.1038/s41386-020-0746-4.
Epub 2020 Jul 3.
Advances in the computational understanding of mental illness
Affiliations
- PMID: 32620005
- PMCID: PMC7688938
- DOI: 10.1038/s41386-020-0746-4
Item in Clipboard
Review
Advances in the computational understanding of mental illness
Neuropsychopharmacology.
2021 Jan.
Abstract
Computational psychiatry is a rapidly growing field attempting to translate advances in computational neuroscience and machine learning into improved outcomes for patients suffering from mental illness. It encompasses both data-driven and theory-driven efforts. Here, recent advances in theory-driven work are reviewed. We argue that the brain is a computational organ. As such, an understanding of the illnesses arising from it will require a computational framework. The review divides work up into three theoretical approaches that have deep mathematical connections: dynamical systems, Bayesian inference and reinforcement learning. We discuss both general and specific challenges for the field, and suggest ways forward.
Figures
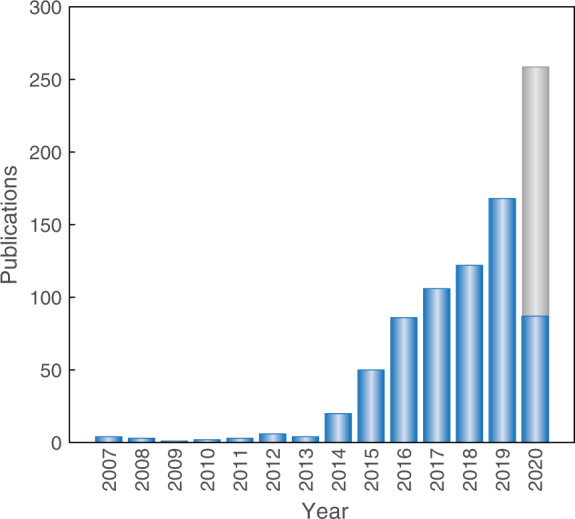
The grey bar is a linear extrapolation for 2020 based on citations up to 1 May 2020.
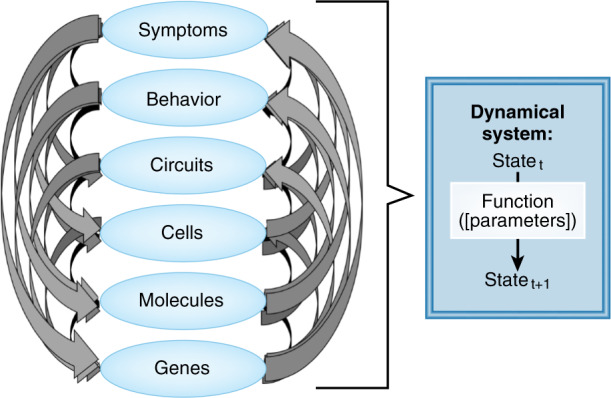
Multiple interactions between phenomena at different levelscan result in behavior that is described by a dynamical system, which is guided by a function that takes the state of the system at time t to some later time t + 1, with parameters that may transcend any individual level but can be observed across levels of analyses.
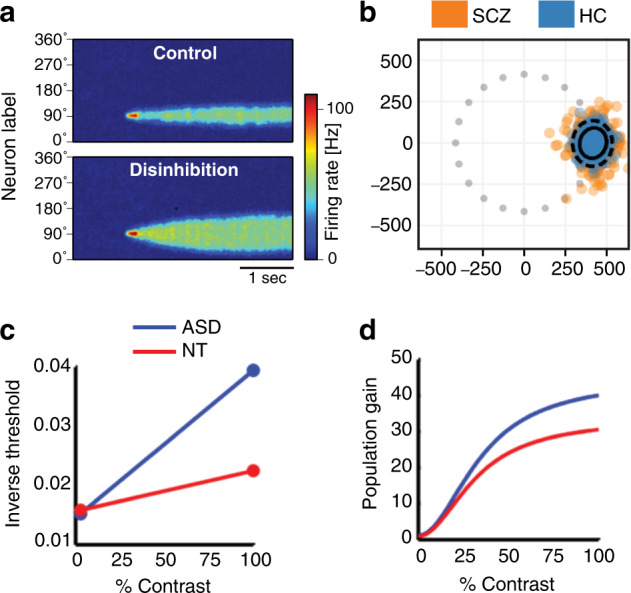
a This shows the activities of a set of neurons, each representing a particular direction after receiving a brief stimulation input at 90 deg. In the control network (top), the population activity is stable and remains tightly focused on the input, hence maintaining this information faithfully. A reduction of the inhibitory input due to a NMDA receptor dysfunction leads to gradually widening bump and hence a less specific representation. b In a delayed working memory task, patients with Schizophrenia (orange) show a greater increase in variance in remembered locations over time than healthy controls (blue). a and b adapted from [46]. c Neurotypicals (NT) and patients with autism spectrum disorder (ASD) perform equally well when judging the direction of motion of a low-contrast stimulus, but patients with autism perform better (they have higher inverse thresholds) at higher contrasts. d Reducing divisive normalization increases the population gain in the model and allows it to qualitatively capture the improvement seen in ASD. c and d reproduced from [63].
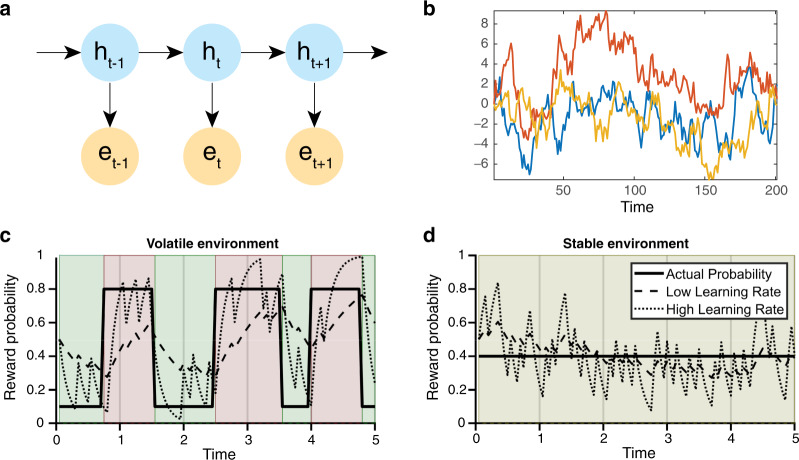
a Latent variable model with temporal dynamics. Here, the hidden variable ht evolves according to some dynamics, but is not observed. The observations et are directly informative about h at the same timepoint, but the extent to which they are informative about future time points depends on the dynamics of h. b Three example trajectories from an AR(1) Ornstein–Uhlenbeck process. This is the evolution of the underlying variable of interest assumed by a Rescorla–Wagner model with a fixed learning rate of 0.05. c, d Learning Rates should reflect the changeability of learned associations (Figure adapted from [103]). The reward expectations of learners with a high (dotted line) and low (dashed line) learning rate (LR) are shown in two different environments. Panel c illustrates a volatile environment in which the learned association is changing rapidly. As can be seen, the learner with a high learning rate α is better able to update its expectation following changes in association whereas the learner with a low learning rate α never catches up. In contrast, panel d illustrates a stable environment in which the learner with the low learning rate accurately estimates the underlying association, with the expectation of the learner with the high learning rate being pulled away from the true value by chance outcomes.
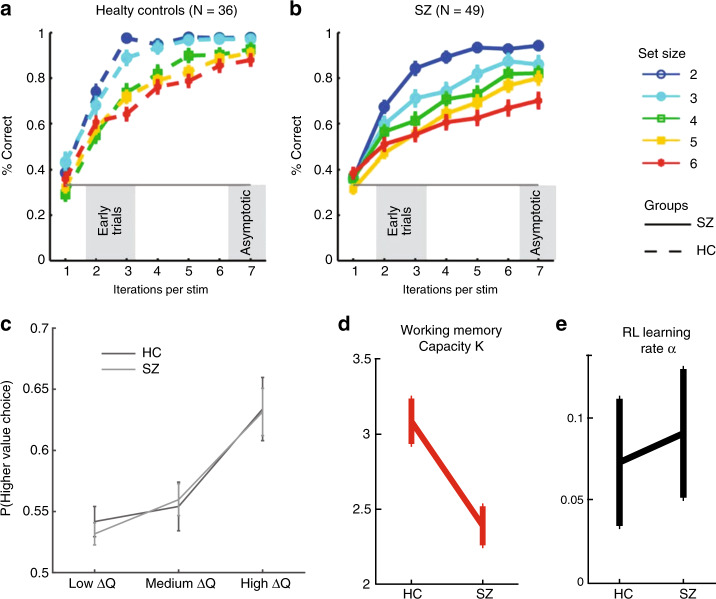
a Working memory effects on reinforcement learning. Learning curves in a simple instrumental learning task are sensitive to the number of stimulus-response contingencies that need to be acquired in the same block (set-size), even given the same number of experiences for each stimulus. These curves are inconsistent with pure RL models but can be captured by an interactive model in which capacity-limited and delay-sensitive working memory processes augment RL, speeding up learning in low set sizes, whereas more incremental but robust RL processes govern asymptotic behavior. b Patients with schizophrenia show profound initial learning deficits in these tasks. c However, the ability to discriminate amongst stimuli as a function of changes in model-free RL Q values in a transfer test is unimpaired. d Modeling isolated the patient deficits during learning to the WM contribution (reduced WM capacity parameter K) whereas RL learning rates α were intact. From [199] and [198].
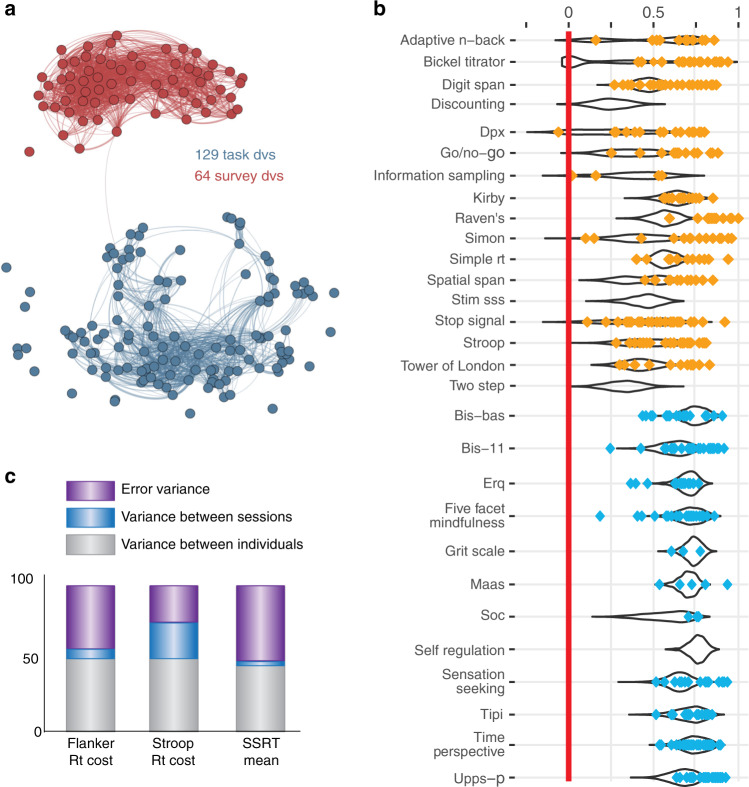
a Questionnaire (red) and task-derived measurements (blue) each cohere amongst each other, but there is little coherence between tasks and self-report measurements. Each node represents a measurement, while the edges represent the estimated regularized partial correlation between two measurements. Edges have been thresholded (partial correlation strength ≥ 0.05). From [288]. b Meta-analysis and replication of test-retest reliabilities of task- and questionnaire-derived measures in yellow and blue, respectively. Each dot shows a reported test-retest reliability. The black violin plots show results from a large online replication study. Adapted from [281]. c Tasks are often designed to show group-level effects, and hence to minimize between-subject variance. However, the low between-subject variance also reduces the scope to see reliable individual differences. The panel shows that only around half the test-retest variance can be accounted for by differences between individuals, meaning that highly robust group-level effects are accompanied by unreliable individual differences. Adapted from [280].
References
-
- Kendler KS. Toward a philosophical structure for psychiatry. Am J Psychiatry. 2005;162:433–40. - PubMed
-
- Dagher A, Robbins TW. Personality, addiction, dopamine: Insights from parkinson’s disease. Neuron. 2009;61:502–10. - PubMed
-
- Marr D. Vision. New York, NY, USA: Freeman; 1982.
-
- Kendler KS. David skae and his nineteenth century etiologic psychiatric diagnostic system: looking forward by looking back. Mol Psychiatry. 2017;22:802–7. - PubMed
Publication types
MeSH terms
Grants and funding
LinkOut - more resources
Full Text Sources
Medical
Research Materials
