. 2020 Aug 14;295(33):11891-11901.
doi: 10.1074/jbc.RA119.011419. Epub 2020 Jul 3.

The maturase HydF enables [FeFe] hydrogenase assembly via transient, cofactor-dependent interactions

Affiliations

The maturase HydF enables [FeFe] hydrogenase assembly via transient, cofactor-dependent interactions

Brigitta Németh et al. J Biol Chem. .

Abstract

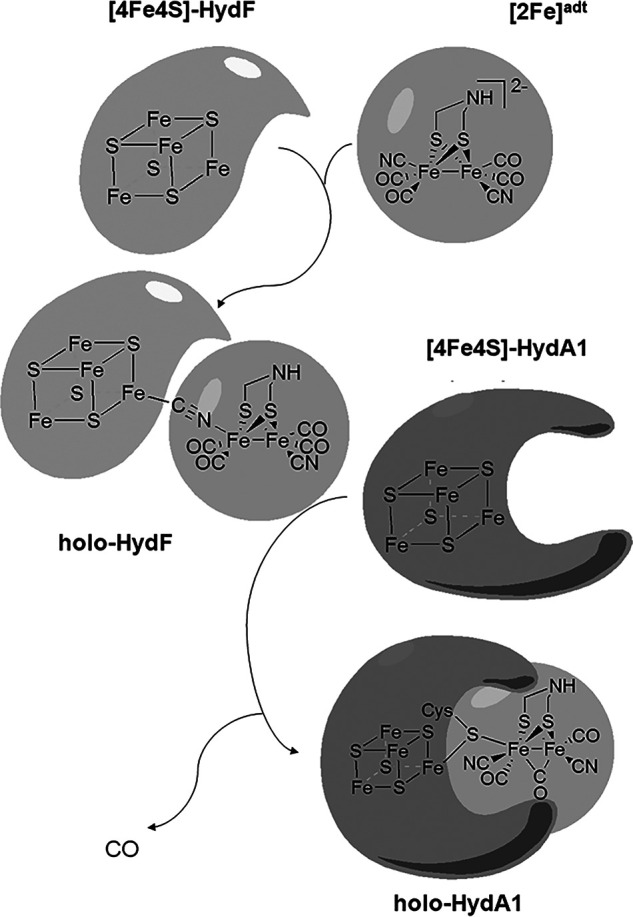
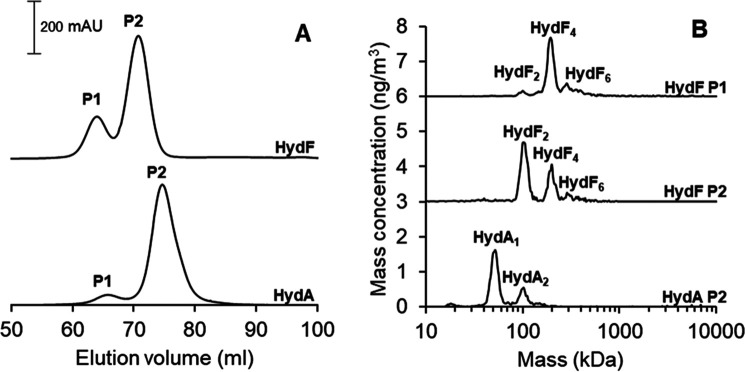
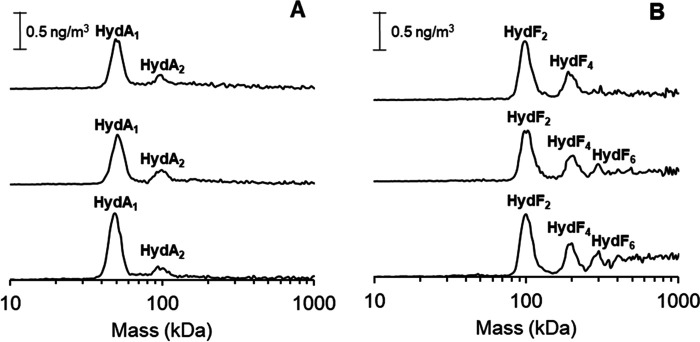
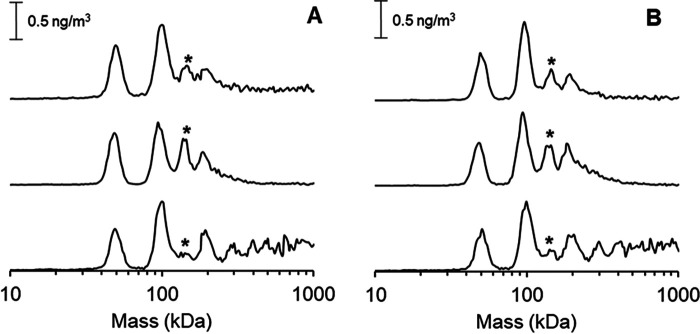
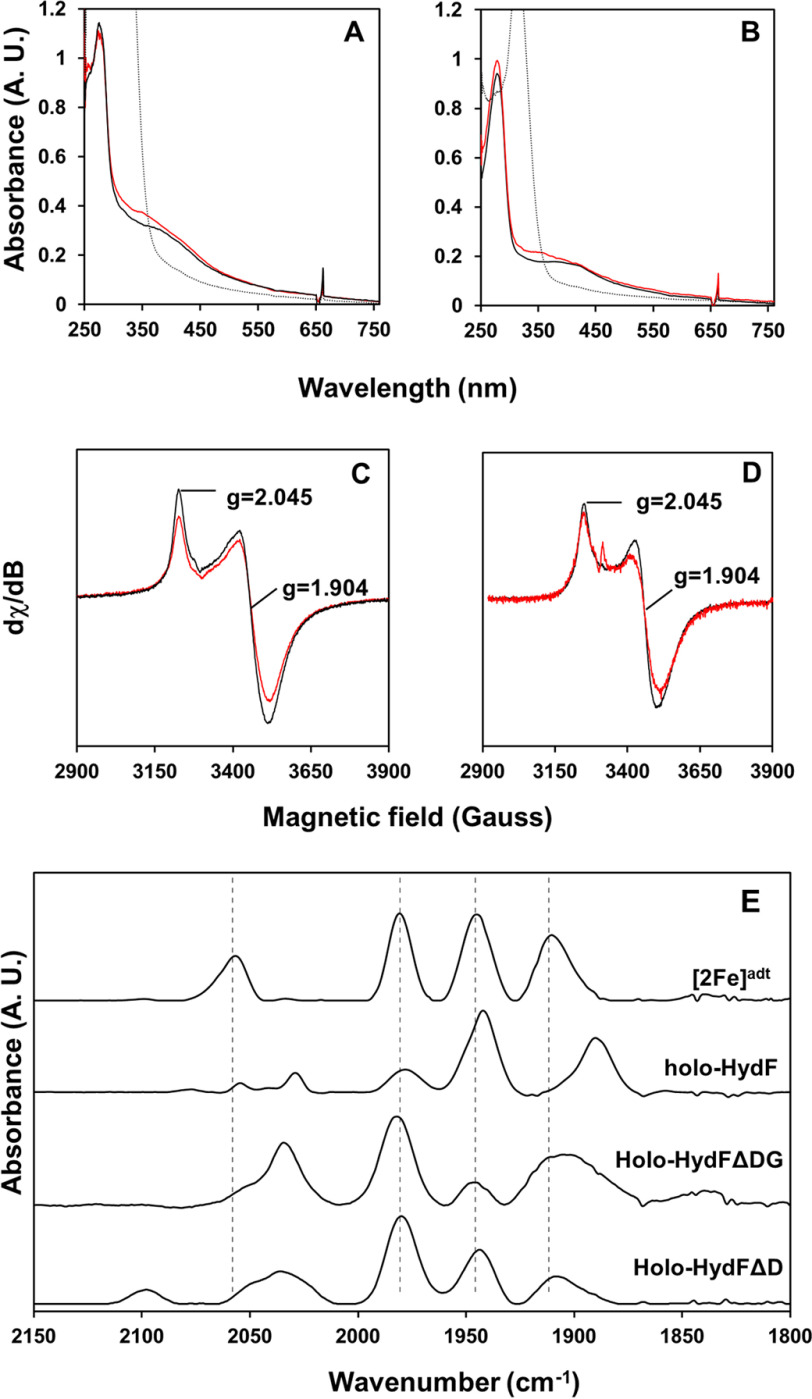
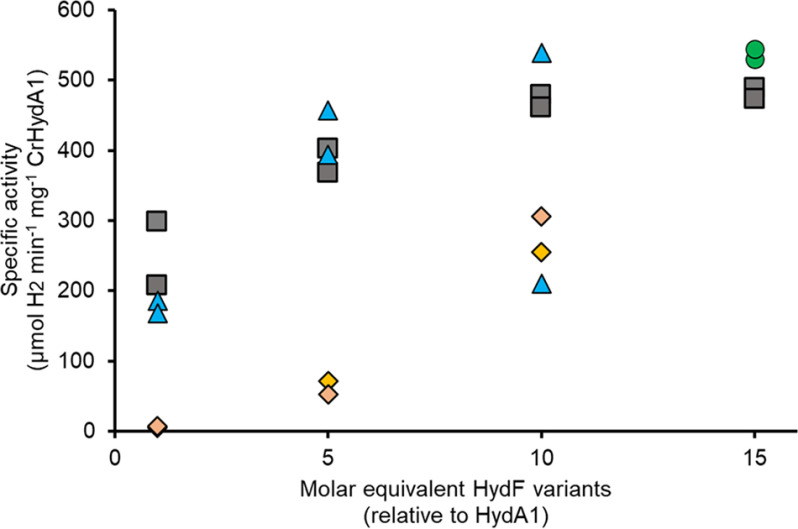
[FeFe] hydrogenases have attracted extensive attention in the field of renewable energy research because of their remarkable efficiency for H2 gas production. H2 formation is catalyzed by a biologically unique hexanuclear iron cofactor denoted the H-cluster. The assembly of this cofactor requires a dedicated maturation machinery including HydF, a multidomain [4Fe4S] cluster protein with GTPase activity. HydF is responsible for harboring and delivering a precatalyst to the apo-hydrogenase, but the details of this process are not well understood. Here, we utilize gas-phase electrophoretic macromolecule analysis to show that a HydF dimer forms a transient interaction complex with the hydrogenase and that the formation of this complex depends on the cofactor content on HydF. Moreover, Fourier transform infrared, electron paramagnetic resonance, and UV-visible spectroscopy studies of mutants of HydF show that the isolated iron-sulfur cluster domain retains the capacity for binding the precatalyst in a reversible fashion and is capable of activating apo-hydrogenase in in vitro assays. These results demonstrate the central role of the iron-sulfur cluster domain of HydF in the final stages of H-cluster assembly, i.e. in binding and delivering the precatalyst.

Keywords: Fourier transform IR (FTIR); chaperone; cofactor; hydrogenase; iron-sulfur protein; mass spectrometry (MS); metal ion–protein interaction; metallo-cofactor assembly; metalloenzyme; protein–protein interaction; scaffold.


Conflict of interest statement

Conflict of interest—The authors declare that they have no conflicts of interest with the contents of this article.

Figures

Figure 1.
Figure 1.
Schematic representation of the metal cofactors in HydF and HydA and the maturation of [FeFe] hydrogenase by HydF.
Figure 2.
Figure 2.
A, SEC chromatograms of the apo-HydF (top) and apo-HydA1 (bottom). Running conditions were 0.8 ml/min flowrate, 50 mm Tris-HCl, pH 8.0, 150 mm NaCl. B, the corresponding GEMMA spectra recorded for the different fractions of the apo-HydF and apo-HydA1 proteins obtained from SEC. Running conditions were 0.02 µg/µl protein in 20 mm ammonium acetate and 0.005% Tween 20.
Figure 3.
Figure 3.
GEMMA spectra recorded on HydF and HydA1 proteins with different cofactor loadings. A, HydA1 (top, holo-HydA1; middle, [4Fe4S]-HydA1; bottom, apo-HydA1); B, HydF (top, holo-HydF; middle, [4Fe4S]-HydF; bottom, apo-HydF). The protein concentration in all samples were 0.02 µg/µl in 20 mm ammonium acetate and 0.005% Tween-20.
Figure 4.
Figure 4.
GEMMA spectra recorded on combinations of HydF and HydA1 proteins with different cofactor content. A, apo-HydA1 interaction with different cofactor containing forms of HydF (top, holo-HydF; middle, [4Fe4S]-HydF; bottom, apo-HydF). B, [4Fe4S]-HydA1 interaction with different cofactor containing forms of HydF (top, holo-HydF; middle, [4Fe4S]-HydF; bottom, apo-HydF). The 150-kDa peak representing the HydF2–HydA1 interaction complex is indicated with an asterisk. The experiments were performed with 0.02 µg/µl each protein (total protein concentration, 0.04 µg/µl) in 20 mm ammonium acetate and 0.005% Tween-20.
Figure 5.
Figure 5.
A, a rigid-body protein-protein docking model of the complex between dimeric [4Fe4S]-HydF (red) and [4Fe4S]-HydA1 (blue). Models are based on reported crystal structures (PDB entries 5KH0 and 3LX4). B, crystal structure of the tetrameric form of apo-HydF (one HydF dimer shown in red, analogously to panel A, and one in brown), revealing a blockage of the interaction crevice (PDB entry 3QQ5).
Figure 6.
Figure 6.
Spectroscopic characterization of the truncated HydF proteins. A and B, UV-visible spectra of HydFΔD (A) and HydFΔDG (B). Shown are the reconstituted ([4Fe-4S]2+) form of the HydF variants (black spectra), the [2Fe]adt cofactor-loaded holo-forms ([2Fe]adt-[4Fe-4S]2+) (red spectra), and the Na-DT reduced ([4Fe-4S]+) forms (dashed spectra). The samples were prepared in a buffer containing 100 mm Tris-HCl and 300 mm KCl with a protein concentration of 100 μm (HydFΔD) or 50 μm (HydFΔDG). Na-DT (0.5 mm) was added to generate the reduced samples. C and D, low-temperature EPR spectra of the reduced forms of HydFΔD (200 μm) (C) and HydFΔDG (200 μm) (D). Shown are both reconstituted (black spectra) and [2Fe]adt-loaded forms (red spectra), and observed g-values are indicated. E, FTIR spectra of the [2Fe]adt-loaded proteins, holo-HydFΔD and HydFΔDG. Spectra recorded for [2Fe]adt and holo-HydF are displayed for comparison, and the peak positions of [2Fe]adt are indicated with vertical dashed lines. The EPR spectra were recorded at 10 K, 1 mW microwave power, 10-Gauss modulation amplitude, and 100-kHz modulation frequency. The microwave frequency was 9.28 GHz. The FTIR spectra were recorded at room temperature, and the samples were prepared in a solution containing approximately 2.5 mm protein, 100 mm Tris-HCl, pH 8.0, 300 mm KCl.
Figure 7.
Figure 7.
Influence of the different domains of HydF on the transfer of the precatalyst to apo-HydA1. A representative titration experiment in which [4Fe-4S]-HydA1 (8 nm) was titrated with 8–120 nm of holo-HydF (gray squares), 8–80 nm holo-HydFΔD (blue triangles), and 8–80 nm holo-HydFΔDG (orange diamonds). The extent of HydA1 activation was determined by calculating the resulting specific activity. 15-Fold molar excess (120 nm) of [2Fe]adt complex was used as a positive control (green circles). Individual data points are indicated, see also Fig. S7. The maturation reactions were performed in 100 mm K-phosphate buffer (pH 6.8), and H2 evolution was initiated via addition of dithionite and MV2+ after 15 min.

References

    1. Lubitz W., Ogata H., Rüdiger O., and Reijerse E. (2014) Hydrogenases. Chem. Rev. 114, 4081–4148 10.1021/cr4005814 - DOI - PubMed
    1. Esmieu C., Raleiras P., and Berggren G. (2018) From protein engineering to artificial enzymes - biological and biomimetic approaches towards sustainable hydrogen production. Sustainable Energy Fuels 2, 724–750 10.1039/c7se00582b - DOI - PMC - PubMed
    1. Mulder D. W., Boyd E. S., Sarma R., Lange R. K., Endrizzi J. A., Broderick J. B., and Peters J. W. (2010) Stepwise [FeFe]-hydrogenase H-cluster assembly revealed in the structure of HydAΔEFG. Nature 465, 248–251 10.1038/nature08993 - DOI - PubMed
    1. Mulder D. W., Ortillo D. O., Gardenghi D. J., Naumov A. V., Ruebush S. S., Szilagyi R. K., Huynh B., Broderick J. B., and Peters J. W. (2009) Activation of HydA1ΔEFG requires a preformed [4Fe-4S] Cluster. Biochem. 48, 6240–6248 10.1021/bi9000563 - DOI - PubMed
    1. Bai Y., Chen T., Happe T., Lu Y., and Sawyer A. (2018) Iron–sulphur cluster biogenesis via the SUF pathway. Metallomics 10, 1038–1052 10.1039/c8mt00150b - DOI - PubMed

Publication types

MeSH terms

LinkOut - more resources