. 2020 Jul 3;11(1):3288.
doi: 10.1038/s41467-020-17139-y.

Integrated pharmaco-proteogenomics defines two subgroups in isocitrate dehydrogenase wild-type glioblastoma with prognostic and therapeutic opportunities

Affiliations

Integrated pharmaco-proteogenomics defines two subgroups in isocitrate dehydrogenase wild-type glioblastoma with prognostic and therapeutic opportunities

Sejin Oh et al. Nat Commun. .

Abstract

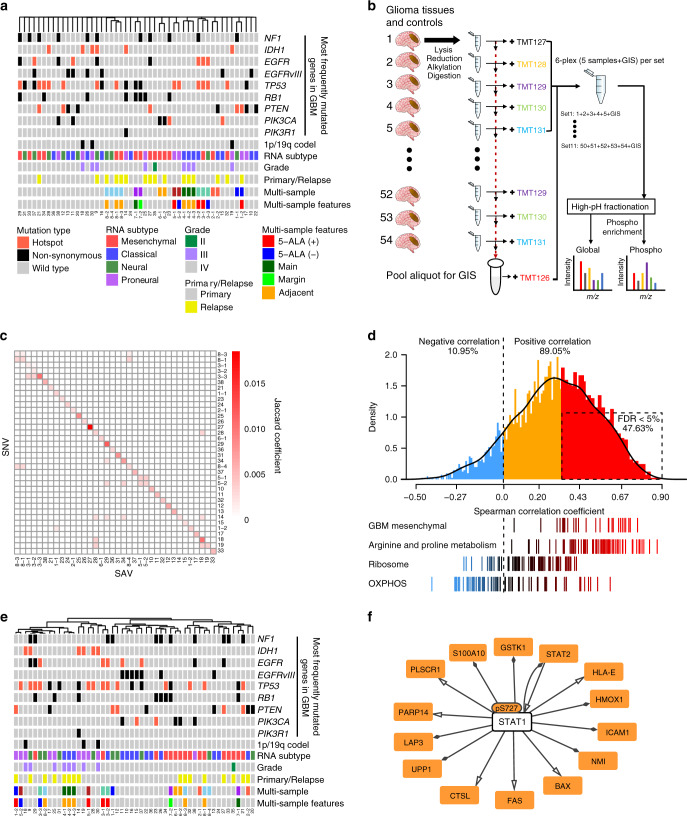
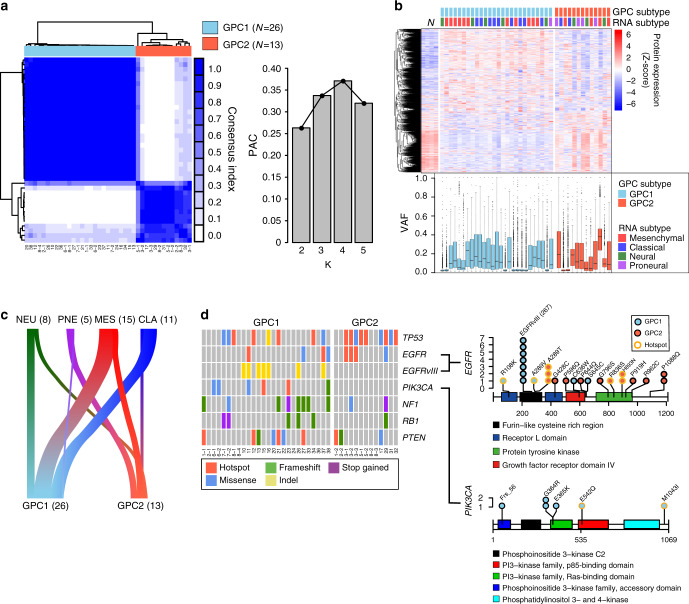
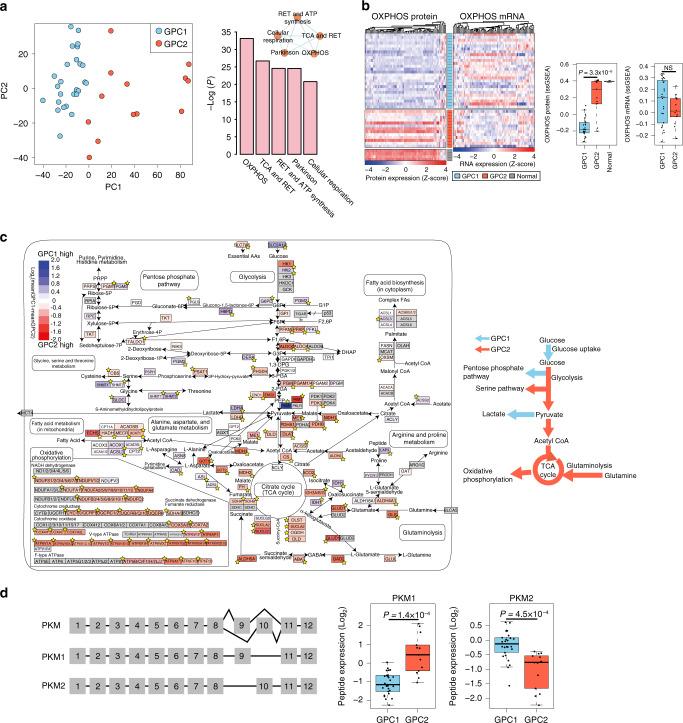
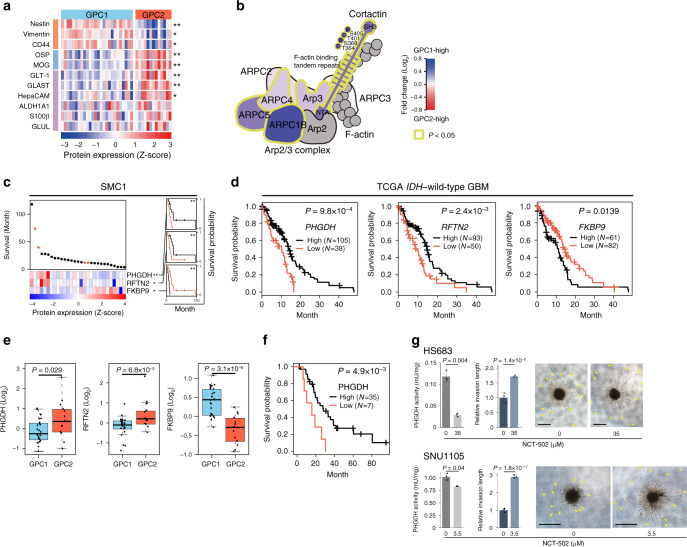
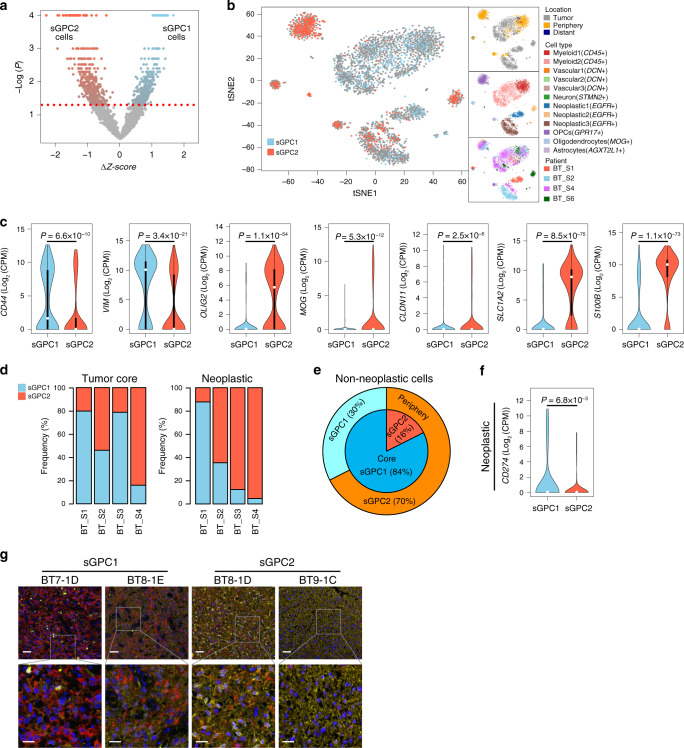
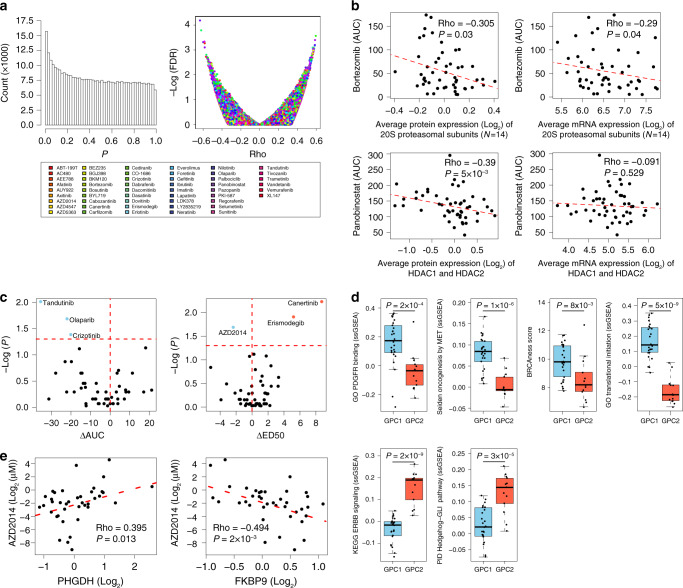
The prognostic and therapeutic relevance of molecular subtypes for the most aggressive isocitrate dehydrogenase 1/2 (IDH) wild-type glioblastoma (GBM) is currently limited due to high molecular heterogeneity of the tumors that impedes patient stratification. Here, we describe a distinct binary classification of IDH wild-type GBM tumors derived from a quantitative proteomic analysis of 39 IDH wild-type GBMs as well as IDH mutant and low-grade glioma controls. Specifically, GBM proteomic cluster 1 (GPC1) tumors exhibit Warburg-like features, neural stem-cell markers, immune checkpoint ligands, and a poor prognostic biomarker, FKBP prolyl isomerase 9 (FKBP9). Meanwhile, GPC2 tumors show elevated oxidative phosphorylation-related proteins, differentiated oligodendrocyte and astrocyte markers, and a favorable prognostic biomarker, phosphoglycerate dehydrogenase (PHGDH). Integrating these proteomic features with the pharmacological profiles of matched patient-derived cells (PDCs) reveals that the mTORC1/2 dual inhibitor AZD2014 is cytotoxic to the poor prognostic PDCs. Our analyses will guide GBM prognosis and precision treatment strategies.


Conflict of interest statement

The authors declare no competing interests.

Figures

Fig. 1
Fig. 1. Proteomic characterization reveals inter- and intra-patient molecular heterogeneity of glioblastoma multiforme (GBM).
a Characteristics of IDH wild-type GBM (N = 39), IDH mutant GBM (N = 2) and low-grade glioma (N = 9) tissue samples. Unsupervised hierarchical clustering with complete linkage was used to cluster samples based on the 1 – Jaccard coefficient as the distance metric. The type of mutations in the 8 most frequently mutated GBM genes are color-coded according to the legend. The multi-sample row displays multiple tumor samples obtained from the same patient as the same color; no color indicates unique samples. 5-ALA (within multi-sample features) indicates the intensity of the 5-aminolevulinic acid-induced fluorescence. b Overview of the multiplexed quantitative proteomic assay of glioma tissues. Trypsin-digested glioma (N = 50) and control normal tissues (N = 4) were tagged with a six-plex tandem mass tag (TMT): TMT127-131 for samples and TMT126 for the global internal standard (GIS) control. A total of 11 sets for 54 samples were prepared. High-pH fractionated peptides were subjected to liquid chromatography-tandem mass spectrometry to identify and quantify phosphopeptides and global proteins. See “Methods” for further details. c Coherence map of single-nucleotide variants (SNV) and single amino acid variants (SAVs). d Correlations between mRNA and protein levels in glioma tissue samples. (Top) Density plot of Spearman’s correlation coefficients between mRNA and protein abundance using the 8034 proteins detected in all GIS samples (N = 4071 at the gene level). Statistically significant positive correlations with a false discovery rate (FDR) <5% are indicated by the dashed-line box. (Bottom) Distribution of correlation coefficients for gene sets of interest. e Unsupervised hierarchical clustering of the 50 samples with global-proteomic data. Complete linkage and the distance metric 1 – Pearson’s correlation coefficient was used for clustering. f Genetic regulatory network activated in IDH wild-type tumors. The transcription factor–target gene regulatory network was formed by the significantly upregulated phosphoproteins and global proteins in IDH wild-type tumors using the OmniPath database in Cytoscape. Source data are provided as a Source Data file.
Fig. 2
Fig. 2. Proteomic subtypes of IDH wild-type GBM associate with clinical and genomic features.
a Consensus clustering of IDH wild-type GBM samples (N = 39) based on global proteome data using 1 – Pearson’s correlation coefficient as the distance metric. (Left) Heatmap of the consensus score. (Right) The bar chart indicates the proportion of ambiguous clustering (PAC) for the indicated K values. The number of clusters (K) with the lowest PAC score is considered the optimal cluster number. b Characteristics of proteomic subtypes. The columns represent the samples grouped by proteomic subtype. The clustering heatmap represents the Z-score-normalized protein expression levels. The box-and-whisker plot represents the medians (middle line), first quartiles (lower bound line), third quartiles (upper bound line), and the ±1.5× interquartile ranges (whisker lines) of the variant allele frequency (VAF) of single nucleotide variants (SNVs) per sample. N: normal control samples. c The river plot illustrates the association between proteomic and RNA subtypes. The width of the edge between two subtypes is shown in proportion to the number of corresponding samples. CLA classical, PNE proneural, NEU neural, MES mesenchymal. Correlation between the two subtyping methods was insignificant by the chi-square test (P = 0.122). d GBM driver mutations associated with proteome subtypes. (Left) The color-coded matrices indicate the cBioPortal-annotated mutation types in the samples grouped by proteomic subtype for the six frequently mutated genes in GBM. (Right) Somatic mutations in EGFRvIII and PIK3CA that were exclusively found in GPC1 and GPC2 tissues. The x axis indicates the position in the gene, and the y axis indicates the frequencies of the mutations. The color in the circle indicates a mutation found either in a GPC1 (blue) or in a GPC2 (red) sample. The outline color of the circle indicates the hotspot mutations. Rectangles with different colors represents protein domains. Source data are provided as a Source Data file.
Fig. 3
Fig. 3. Proteins involved in central carbon metabolism are major determinants of IDH wild-type GBM proteomic subtypes.
a Principal component analysis (PCA) of 39 IDH wild-type GBM samples using global proteome data (left). The statistical significance of the enriched gene sets with the top 10% loading genes (N = 390) in PC1 is shown in the right panel. The mutual similarity of the top five gene sets is presented using EnrichmentMap with default parameters. RET respiratory electron transport. b Clustering heatmaps of IDH wild-type GBM tissues with the OXPHOS-related genes based on protein and mRNA expression data (left). The rows represent the tumor samples grouped by proteomic subtype, and the columns represent the genes belonging to the OXPHOS-related gene set. Comparisons of the single-sample gene set enrichment analysis (ssGSEA) scores for both proteins and genes are shown on the right. The box-and-whisker plots represent the medians (middle line), first quartiles (lower bound line), third quartiles (upper bound line), and the ±1.5× interquartile ranges (whisker lines); the raw data are overlaid. P-values were calculated using the two-sided unpaired Wilcoxon rank-sum test. NS not significant. The number of samples for GPC1, GPC2, and normal is 26, 13, and 4, respectively. c Pathway view of differentially expressed proteins involved in central carbon metabolism between the two proteome subtypes. The stars indicate a statistically significant difference in protein expression between the two GPC subtypes (P < 0.05; two-sided unpaired Student’s t-test. See Supplementary Data 3 for exact P-values). Genes with no available protein expression data are shown in gray. The elevated pathways in GPC1 and GPC2 tumors are summarized as colored arrows in the right panel. d Alternative splicing of pyruvate kinase muscle isozyme (PKM) isoforms (left) and comparison of the peptide expression of PKM1 and PKM2 in GPC subtypes (right). The y axes of the boxplots represent the peptide expression of PKM isoforms normalized by the GIS. The description of box-and-whisker plots are the same as in b. The P-value was calculated by two-sided unpaired Student’s t-test. The number of samples for GPC1 and GPC2 is 26 and 13, respectively.
Fig. 4
Fig. 4. GPC2-associated PHGDH predicts a favorable prognosis in IDH wild-type GBM.
a Differential expression of protein markers for NSCs (orange), oligodendrocytes (blue), and astrocytes (purple) between proteomic subtypes. *P < 0.05, **P < 0.001; two-sided unpaired Student’s t-test. See Supplementary Data 3 for exact P-values. b The cortactin-Arp2/3 complex is elevated in GPC1 tumors. The gray color indicates proteins with no available protein expression data. P-values were calculated by two-sided unpaired Student’s t-test. c Prognostic biomarker proteins in IDH wild-type GBM. Deceased and surviving patients are denoted by black and red dots, respectively. *P < 0.05, **P < 0.01; univariate Cox regression test. Kaplan–Meier (KM) survival curves for IDH wild-type GBM patients (N = 29) in the SMC1 cohort were shown on the right for each of the three proteins (black: high expression, red: low expression). **P < 0.01; two-sided log-rank test. d Kaplan–Meier (KM) survival curves. Patients were classified by the optimal gene expression thresholds reported by Uhlen et al.. P-values were calculated using the two-sided log-rank test. e Box-jitter plots for the abundance of the indicated proteins. The description of the box-and-whisker plots is the same as in Fig. 3b. Statistical significance of the downregulation of favorable markers (PHGDH and RFTN2) and upregulation of an unfavorable marker (FKBP9) was evaluated by Student’s t-test (one-sided unpaired). The number of samples for GPC1 and GPC2 is 26 and 13, respectively. f KM survival curves for PHGDH-high vs. low patients in the SMC-TMA cohort. Patients were classified as described in d. P-values were calculated as in d. g PHGDH activity (left), relative invasion lengths (middle), and representative images of 3D invasion (right) of the indicated tumor spheres after treatment of vehicle (DMSO) or NCT-502 for 48 h at the indicated concentrations. Two-sided unpaired Student’s t-test was used to compare PHGDH activity. Two-way ANOVA was used for the comparison of relative invasion length between treatment groups. Error bars indicate ±SD, N = 3. Arrowheads indicate invasive fronts. Scale bar: 500 μm. Source data are provided as a Source Data file.
Fig. 5
Fig. 5. Classification of GBM single cells reveals tumor-layer-dependent and cell-type-dependent characteristics of GPC-subtypes.
a Classification of GBM single cells from the data set reported in Darmanis et al. . The red dotted line indicates the statistical threshold used to determine the surrogate GPC (sGPC) subtype of single cells. b 2D t-SNE projection of single cells of surrogate-proteomic subtypes. t-SNE coordinates, single-cell annotations describing the location within the 3D tumor mass, cell type, and the patient origin (shown in right side panels) were obtained from Darmanis et al.. c Subtype-specific mRNA expression of neural stem cell (NSC), oligodendrocyte, and astrocyte markers in single cells. CD44/VIM, OLIG2/MOG/CLDN11, and SLC1A2/S100B represent NSC, oligodendrocyte, and astrocyte markers, respectively. The violin plots represent density distributions. The description of box and whisker plots in violin is the same as in Fig. 3b. P-values were obtained by two-sided unpaired Wilcoxon rank-sum test. d Proportion of tumor core single cells (left) and neoplastic single cells (right) of two subtypes in four specimens in the data set generated by Darmanis et al. . e Proportion of non-neoplastic single cells of two subtypes in the Darmanis et al. data set. f Subtype-specific mRNA expression of an immune checkpoint ligand CD274 (PD-L1) in neoplastic single cells. The description of the violin plot is the same as in c. P-values were obtained by two-sided unpaired Wilcoxon rank-sum test. g Representative images (N = 1) of multiplex fluorescent immunohistochemistry analysis of SMC-TMA samples using PHGDH (yellow) and Nestin (red) antibodies. Nuclei were stained with DAPI (blue). Sample IDs and their respective sGPC-subtypes are indicated above the image. Scale bars: 50 μm (upper panels), 20 μm (lower panels). Source data are provided as a Source Data file.
Fig. 6
Fig. 6. Subtype-specific and biomarker-dependent sensitivities to targeted therapies.
a Correlation tests between the drug–response (AUC and ED50) and the abundance of global proteins. (Left) Histogram of P-values, and (right) FDR score distribution. Rho and P-values were obtained by Spearman’s correlation test. b Correlations between expression levels of the indicated proteins (or mRNAs) and responses to the indicated pharmacological compounds targeting them. Rho and P-values were obtained by Spearman’s correlation test. c GPC1 or GPC2-selective cytotoxicity profile of the indicated targeted therapies to patient-derived tumor cells matched to the proteomic cohort. The x axes represent differences in mean AUC (left panel) and mean ED50 (right panel) values between GPC1 and GPC2 PDCs. Statistically significant GPC1 and GPC2-selective drugs were identified by two-sided Kolmogorov–Smirnov test (P-values < 0.05; horizontal dashed line) (blue: GPC1 sensitivity, red: GPC2 sensitivity). d Subtype-specific differences in relevant gene sets to GPC1-selective (upper panels) and GPC2-selective (lower panels) drugs in c. P-values were obtained with two-sided unpaired Wilcoxon rank-sum test. The number of samples for GPC1 and GPC2 is 26 and 13, respectively. The box-and-whisker plots represent the medians (middle line), first quartiles (lower bound line), third quartiles (upper bound line) and the ±1.5× interquartile ranges (whisker lines); the raw data are overlaid. See “Methods” for details. PDGFR platelet-derived growth factor receptor. e Correlation between the expression levels of the indicated proteins and the response to the indicated pharmacological compound. Rho and P-value were obtained by Spearman’s correlation test. Source data are provided as a Source Data file.

Similar articles

Cited by

References

    1. Stupp R, et al. Radiotherapy plus concomitant and adjuvant temozolomide for glioblastoma. N. Engl. J. Med. 2005;352:987–996. - PubMed
    1. Chen B, et al. Gross total resection of glioma with the intraoperative fluorescence-guidance of fluorescein sodium. Int. J. Med. Sci. 2012;9:708–714. - PMC - PubMed
    1. Osuka S, Van Meir EG. Overcoming therapeutic resistance in glioblastoma: the way forward. J. Clin. Invest. 2017;127:415–426. - PMC - PubMed
    1. Weller M, Cloughesy T, Perry JR, Wick W. Standards of care for treatment of recurrent glioblastoma–are we there yet? Neuro Oncol. 2013;15:4–27. - PMC - PubMed
    1. Brennan CW, et al. The somatic genomic landscape of glioblastoma. Cell. 2013;155:462–477. - PMC - PubMed

Publication types

MeSH terms