. 2020 Jul 3;11(1):3339.
doi: 10.1038/s41467-020-17098-4.

Mechanistic insights into chromatin targeting by leukemic NUP98-PHF23 fusion

Affiliations

Mechanistic insights into chromatin targeting by leukemic NUP98-PHF23 fusion

Yi Zhang et al. Nat Commun. .

Abstract

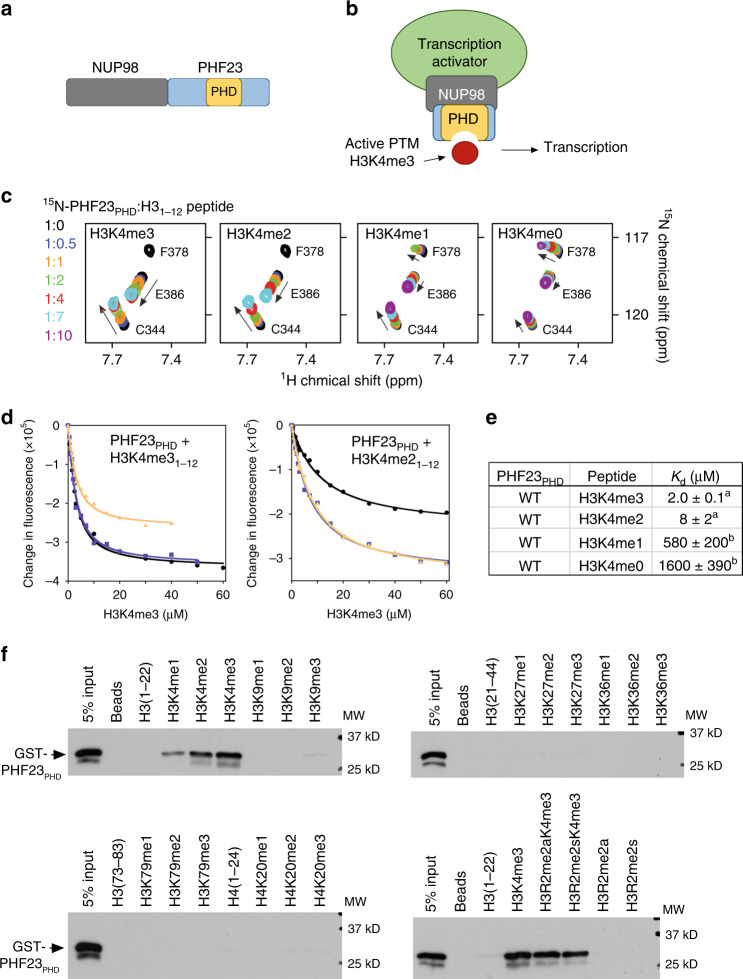
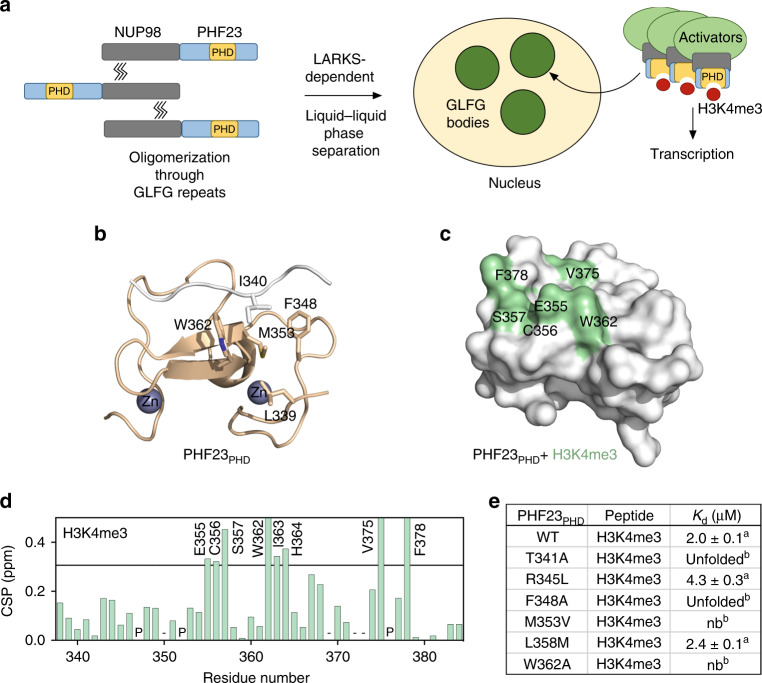
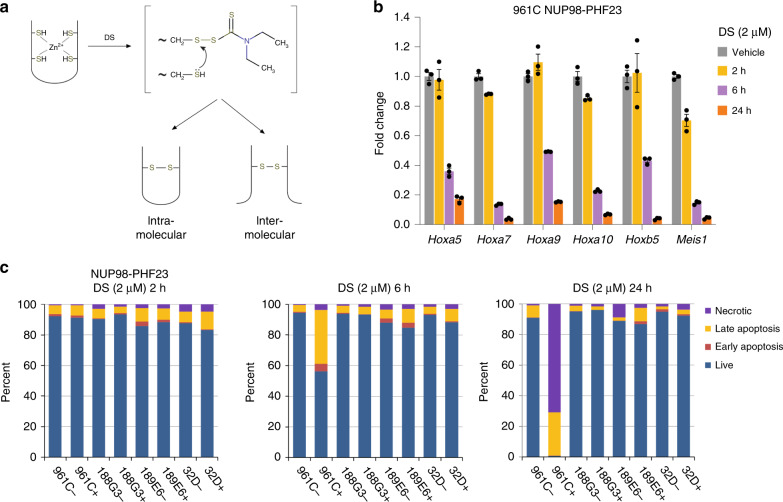
Chromosomal NUP98-PHF23 translocation is associated with an aggressive form of acute myeloid leukemia (AML) and poor survival rate. Here, we report the molecular mechanisms by which NUP98-PHF23 recognizes the histone mark H3K4me3 and is inhibited by small molecule compounds, including disulfiram that directly targets the PHD finger of PHF23 (PHF23PHD). Our data support a critical role for the PHD fingers of NUP98-PHF23, and related NUP98-KDM5A and NUP98-BPTF fusions in driving leukemogenesis, and demonstrate that blocking this interaction in NUP98-PHF23 expressing AML cells leads to cell death through necrotic and late apoptosis pathways. An overlap of NUP98-KDM5A oncoprotein binding sites and H3K4me3-positive loci at the Hoxa/b gene clusters and Meis1 in ChIP-seq, together with NMR analysis of the H3K4me3-binding sites of the PHD fingers from PHF23, KDM5A and BPTF, suggests a common PHD finger-dependent mechanism that promotes leukemogenesis by this type of NUP98 fusions. Our findings highlight the direct correlation between the abilities of NUP98-PHD finger fusion chimeras to associate with H3K4me3-enriched chromatin and leukemic transformation.


Conflict of interest statement

The authors declare no competing interests.

Figures

Fig. 1
Fig. 1. PHF23PHD binds H3K4me3.
a Schematic of the NUP98–PHF23 fusion protein. b A model for NUP98–PHF23 dependent leukemic transformation. Binding of the PHD finger of PHF23 to H3K4me3, a mark associated with active gene transcription, bridges transcription activators and/or prevents binding of transcription silencing components. c Superimposed 1H,15N HSQC spectra of PHF23PHD collected upon titration with indicated H3 peptides. Spectra are color coded according to the protein:peptide molar ratio. d Binding curves used to determine the Kd values by fluorescence spectroscopy. Data points and fitted curves for three independent experiments are shown and colored black, blue, and wheat. Source data are provided in the Source Data file. e Binding affinities of WT PHF23PHD for the indicated histone peptides measured by tryptophan fluorescence (a) or by NMR titration experiments (b). Error represents SD in triplicate measurements. f Western blot analysis of peptide pulldowns of GST-PHF23PHD with the indicated histone H3 peptides from single experiment. Source data are provided in the Source Data file.
Fig. 2
Fig. 2. Molecular basis for the recognition of H3K4me3 by PHF23PHD.
a A model for the leukemic activity of the NUP98–PHF23 fusion. b Structure of PHF23PHD. The N-terminus of another PHF23PHD molecule (white) binds in the histone-binding site of the domain. The side chain of I340 occupies the aromatic cage. Source data are provided in the Source Data file. c, d Identification of the H3K4me3-binding site of PHF23PHD. Residues that exhibit H3K4me3-induced resonance changes in (d) are mapped onto the structure of PHF23PHD in (c). Histogram shows NMR chemical shift perturbations in PHF23PHD upon binding of H3K4me3 peptide at a 1:4 ratio. ‘P’ indicates a proline residue. ‘−’ indicates an unassigned residue. Bars reaching the maximum of y-axis indicate disappeared cross-peaks. Source data are provided in the Source Data file. e Binding affinities of the PHF23PHD mutants to the H3K4me3 peptide as measured by tryptophan fluorescence (a) or by NMR titration experiments (b).
Fig. 3
Fig. 3. AD and DS bind to PHF23PHD and inhibit the survival of NUP98–PHF23 expressing AML cells.
a Chemical structures of amiodarone and disulfiram. b, c Superimposed 1H,15N HSQC spectra of PHF23PHD collected upon titration with AD or DS. Protein concentration was kept at 100 μM. Concentrations of AD were 0, 0.5, and 2 mM b. Concentrations of DS were 0, 0.1, and 0.2 mM c. Spectra are color coded according to the protein:compound molar ratio. d, e AD treatment affected the survival of NUP98–PHF23 (748T) and control (7298/2) cell lines. For additional trials see ref. . Source data are provided in the Source Data file. f Concentration dependent effect of DS on the survival of NUP98–PHF23 expressing 961C, NUP98–HOXD13 expressing 189E6, and 32D AML cell lines. For additional trials see ref. . Source data are provided in the Source Data file. Identification of the AD-binding g and DS-binding h sites of PHF23PHD. Residues that exhibit significant ligand-induced resonance perturbations in b, c are mapped onto the structure of PHF23PHD. See also Supplementary Fig. 4. i Samples containing 0.1 mM PHF23PHD were incubated with indicated amounts of DS for 10 min, 30 min, 1 h, 3 h, and overnight (o/n). All samples were flash-frozen and resolved by SDS-PAGE under nonreducing and reducing (10 mM mercaptoethanol (β-ME)) conditions. Experiment was repeated independently two times with similar results.
Fig. 4
Fig. 4. DS induces cell death in NUP98–PHF23 expressing cells.
a The mechanism of DS-based inhibition. b DS treatment leads to reduced target gene expression. qRT-PCR quantification of previously identified target genes normalized to 18S RNA as internal control confirms downregulation of Hoxa5, Hoxa7, Hoxa9, Hoxa10, Hoxb5, and Meis1 in the presence of DS. Error bars represent SEM (n = 3 each sample). Source data are provided in the Source Data file. c Proportions of necrotic, late apoptosis, early apoptosis, and live cells in NUP98–PHF23 expressing 961C, NUP98–HOXD13 expressing 188G3 and 189E6, and control (32D) AML cell lines treated without (−) or with (+) DS. n = 1, source data are provided in the Source Data file.
Fig. 5
Fig. 5. PHD finger-dependent leukemic transformation.
a Schematic representation of NUP98 fusion proteins identified in AML cases. b Wright–Giemsa staining of murine hematopoietic progenitor cells transformed by the indicated NUP98 fusion proteins. Scale bars: 5 μM. Images were from single experiment. c Superimposed structures of the BPTFPHD (ref.), KDM5APHD (ref.), and PHF23PHD in complex with indicated ligands. PDB IDs: 2F6J, 3GL6, and 6WXK. The structure of PHF23PHD superimposes with the structures of KDM5APHD and BPTFPHD with a RMSD of 0.68 and 1.32 Å, respectively. d A zoom-in view of the aromatic cages of BPTFPHD, KDM5APHD, and PHF23PHD. e FLAG immunoblots from single experiment showing protein levels of the indicated FLAG-tagged NUP98 fusion post-transduction into hematopoietic progenitor cells. f Proliferation of the indicated NUP98 fusion post-transduction into hematopoietic progenitor cells. Error represents SD of triplicate measurements, n = 3 biologically independent experiments. Source data are provided in the Source Data file.
Fig. 6
Fig. 6. NUP98–KDM5A is enriched at H3K4me3 regions and is sensitive to DS.
a ChIP-seq profiles of H3K4me3, NUP98–KDM5A (N5A, two replicates), and H3K27me3 at the Hoxa, Meis1, and Hoxb loci in murine leukemia cells transformed by NUP98–KDM5A. b Heatmap of H3K4me3 and two replicas of NUP98–KDM5A ChIP-seq signals centered on H3K4me3-binding sites in a ±5.0-kb window in murine leukemia cells expressing FLAG-tagged NUP98–KDM5A. ChIP-seq signals were normalized to input. c DS induces cell death of NUP98–KDM5A expressing and NUP98–PHF23 expressing AML cell lines at earlier time points and lower DS concentrations than the NUP98–HOXD13 expressing cell line, confirming our previous results. n = 1, source data are provided in the Source Data file. Superimposed 1H,15N HSQC spectra of BPTFPHD d and KDM5APHD e collected upon titration with DS. Spectra are color coded according to the protein:compound molar ratio. Dashed box indicates newly appeared cross-peaks.

Similar articles

Cited by

References

    1. Chi P, Allis CD, Wang GG. Covalent histone modifications–miswritten, misinterpreted and mis-erased in human cancers. Nat. Rev. Cancer. 2010;10:457–469. doi: 10.1038/nrc2876. - DOI - PMC - PubMed
    1. Milne TA. Mouse models of MLL leukemia: recapitulating the human disease. Blood. 2017;129:2217–2223. doi: 10.1182/blood-2016-10-691428. - DOI - PMC - PubMed
    1. Gough SM, Slape CI, Aplan PD. NUP98 gene fusions and hematopoietic malignancies: common themes and new biologic insights. Blood. 2011;118:6247–6257. doi: 10.1182/blood-2011-07-328880. - DOI - PMC - PubMed
    1. Wang GG, Cai L, Pasillas MP, Kamps MP. NUP98-NSD1 links H3K36 methylation to Hox-A gene activation and leukaemogenesis. Nat. Cell Biol. 2007;9:804–812. doi: 10.1038/ncb1608. - DOI - PubMed
    1. Ahuja HG, et al. t(9;11)(p22;p15) in acute myeloid leukemia results in a fusion between NUP98 and the gene encoding transcriptional coactivators p52 and p75-lens epithelium-derived growth factor (LEDGF) Cancer Res. 2000;60:6227–6229. - PubMed

Publication types

MeSH terms