. 2020 Jul 3;11(1):3296.
doi: 10.1038/s41467-020-17090-y.

Predicting and affecting response to cancer therapy based on pathway-level biomarkers

Affiliations

Predicting and affecting response to cancer therapy based on pathway-level biomarkers

Rotem Ben-Hamo et al. Nat Commun. .

Abstract

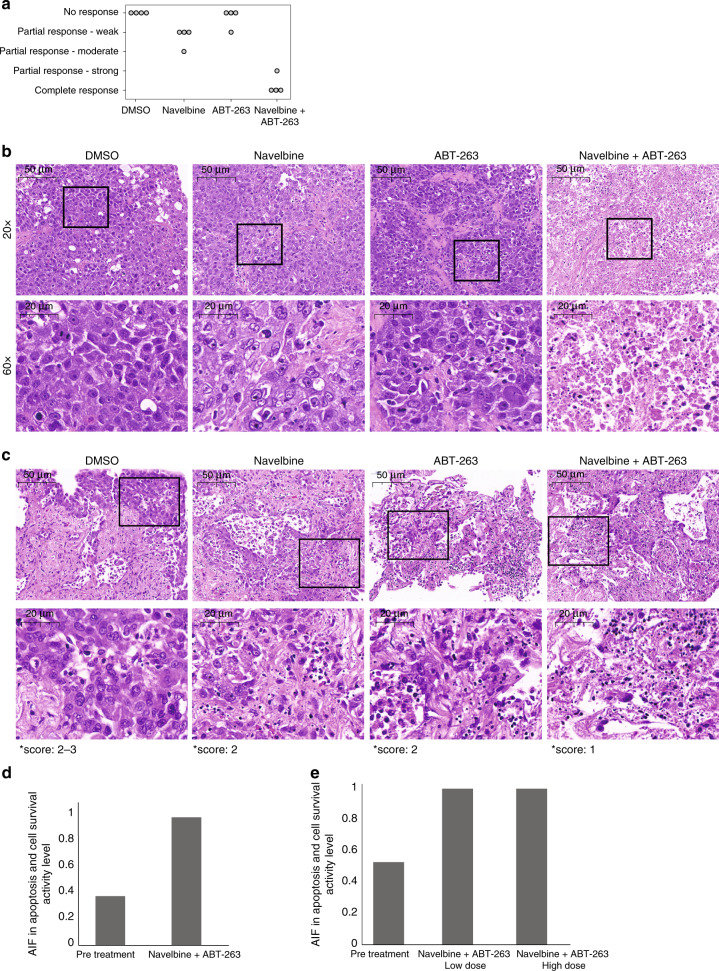
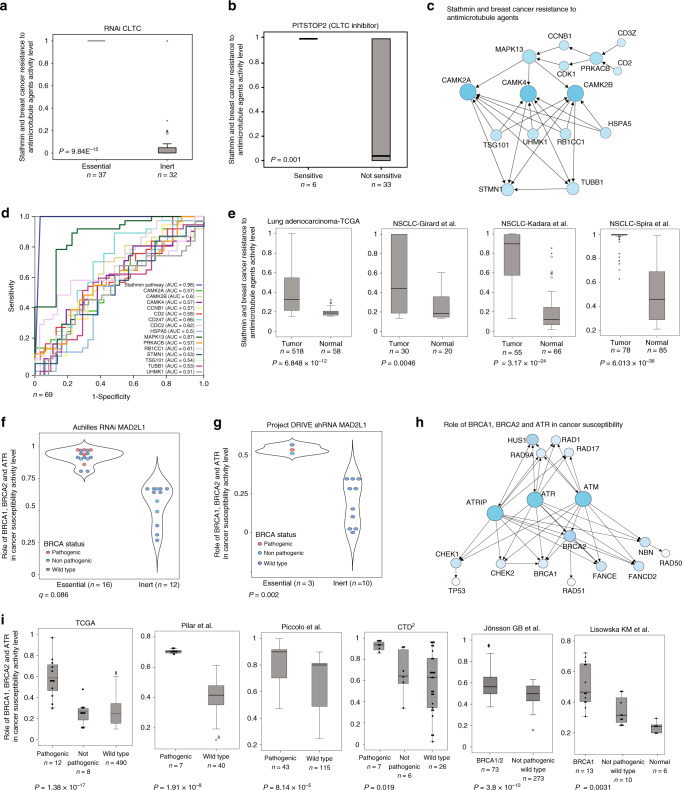
Identifying robust, patient-specific, and predictive biomarkers presents a major obstacle in precision oncology. To optimize patient-specific therapeutic strategies, here we couple pathway knowledge with large-scale drug sensitivity, RNAi, and CRISPR-Cas9 screening data from 460 cell lines. Pathway activity levels are found to be strong predictive biomarkers for the essentiality of 15 proteins, including the essentiality of MAD2L1 in breast cancer patients with high BRCA-pathway activity. We also find strong predictive biomarkers for the sensitivity to 31 compounds, including BCL2 and microtubule inhibitors (MTIs). Lastly, we show that Bcl-xL inhibition can modulate the activity of a predictive biomarker pathway and re-sensitize lung cancer cells and tumors to MTI therapy. Overall, our results support the use of pathways in helping to achieve the goal of precision medicine by uncovering dozens of predictive biomarkers.


Conflict of interest statement

R.S. and N.G. serve as external consultants to CuResponse and in such context have been issued equity incentives in the company. G.G. receives research funds from IBM and Pharmacyclics. G.G. is an inventor on patent applications related to bioinformatic tools such as MuTect, MutSig, ABSOLUTE, and POLYSOLVER. G.G. is a founder, consultant and holds privately held equity in Scorpion Therapeutics. R.B, G.G. and R.S. are inventors on a patent application related to this work. All other authors declare no competing interests.

Figures

Fig. 1
Fig. 1. Pathway activity levels as predictive biomarkers.
a Euclidean distance (ED) distribution of genes and pathways calculated from microarray data from two different institutions (CCLE and GDSC) across 438 cell lines. Blue line: ED distribution between the pathways in the two datasets; red line: ED distribution between the genes. P-values were generated using Mann–Whitney U-test. b ED distribution of genes and pathways between RNA-seq and microarray data across 294 ovarian cancer patients. Blue line: ED between the pathways; red line: ED between the genes. P-values were generated using Mann–Whitney U-test. c tSNE plot of the gene-expression levels in three tumor types and their adjacent normal tissue. Samples are colored by tissue type and state (tumor/normal). d tSNE plot of the pathway activity levels in three tumor types and their adjacent normal tissue. Samples are colored by tissue type and state (tumor/normal). e Workflow pipeline depicting the data flow from the (i) Input data to (ii) the drug-based Classification step to (iii) the final Results output. The quantile–quantile (QQ) plots are colored by tissue type. See also Supplementary Figs. 1–3.
Fig. 2
Fig. 2. IL2–STAT5 pathway predicts response to BCL2 inhibitors.
a Network diagram representing the IL2 signaling events mediated by STAT5′ pathway. b IL2–STAT5 pathway activity levels in sensitive and not-sensitive lung cancer cell lines in microarray and RNA-seq. Upper box plots represent all lung cancer cell lines, and lower box plots represent the SCLC and NSCLC subtypes. Error bars represent the standard deviation. P-values were generated using Mann–Whitney U-test. c Scatter plot of ABT-737 AUC z-score values versus IL2–STAT5 pathway levels in microarray and RNA-seq (blue: sensitive cell lines; red: not-sensitive cell lines; gray: samples that were excluded from the analysis). d Two independent datasets of lung cancer cell lines treated with ABT-263. Box plots show IL2–STAT5 pathway activity levels in sensitive and not-sensitive cell lines. Error bars represent the standard deviation. P-values were generated using Mann–Whitney U-test. e ROC analysis was constructed to evaluate the prognostic power of the IL2–STAT5 pathway versus ABT-263 targets and MCL1 in the validation set. The AUC was used to quantify response prediction. See also Supplementary Fig. 4.
Fig. 3
Fig. 3. AIF in apoptosis and cell-survival pathway predicts response to MTI.
a ‘AIF in apoptosis and cell-survival pathway’ activity levels in sensitive (blue) and not-sensitive (red) lung cancer cell lines in microarray and RNA-seq. Box plots represent the MTIs that were identified by this analysis across all lung cancer cell lines. Error bars represent the standard deviation. P-values were generated using Mann–Whitney U-test. b ROC analysis was constructed to evaluate the prognostic power of the AIF pathway versus the three pathway genes (AIF1, BCL-XL, PARP1) in the TCGA lung adenocarcinoma dataset. The AUC was used to quantify response prediction. c Box plot of BCL2-protein family member expression levels in sensitive (blue boxes) and not-sensitive (red boxes) cell lines. Error bars represent the standard deviation. d Validation sets of lung cancer cell lines and patients (TCGA) that were treated with MTIs. Box plots show AIF pathway activity levels in the sensitive and not-sensitive cell lines (left panel) as well as in patients with complete response or progressive disease (right panel). Error bars represent the standard deviation. P-values were generated using Mann–Whitney U-test. See also Supplementary Figs. 5, 6.
Fig. 4
Fig. 4. BCL-XL inhibition elevates AIF pathway levels resulting in a synergistic activity with MTIs.
a Cartoon depicting the ‘AIF in apoptosis and cell-survival pathway’ with ABT-263 and MTI activity. b AIF pathway activity levels calculated from qRT-PCR in lung cancer cell lines before treatment (black bars), after treatment with ABT-263 (blue bars), and after treatment with a combination of vinorelbine and ABT-263 (gray bars). H211 was identified as sensitive, and the other four cell lines as not sensitive. Error bars represent the standard deviation. P-values were generated using Mann–Whitney U-test. c Relative growth of lung cancer cell lines over a 7-day period with no treatment (solid black line), vinorelbine (dotted blue line), ABT-263 (solid blue line), and a combination of vinorelbine and ABT-263 (dotted black line). Error bars represent the standard deviation. d Bliss analysis of drug synergy in cell lines treated with vinorelbine plus ABT-263. Bliss index < 0.5 represents synergism. Error bars represent the standard deviation. See also Supplementary Fig. 7a.
Fig. 5
Fig. 5. Synergistic activity of ABT-263 and Navelbine in PDX-model and human lung cancer patient.
a Cell viability in ex-vivo organ culture. Viability values are as follows: 0: 0–20% viability, complete response; 1: 20–35%, partial response: strong; 2: 36–59%, partial response: moderate; 3: 60–84%, partial response: weak; 4: 85–100%, no response. Viability percentages were quantified by evaluating morphological features and were performed by two pathologists that were blinded to the experiment. b H&E-stained histology of NSCLC PDX tumors treated ex-vivo with DMSO (control), Navelbine, ABT-263, and a combination of the two drugs. c H&E-stained histology of a tumor from an untreated 71-year-old patient. The samples treated ex-vivo with DMSO (control), Navelbine, ABT-263, and a combination of the two drugs. d AIF pathway activity levels calculated from qRT-PCR in FFPE-preserved tissues from (b). P-values were generated using Mann–Whitney U-test. e AIF pathway activity levels calculated from qRT-PCR in FFPE-preserved tissues from (c) before and after treatment with a combination of navelbine and ABT-263. P-values were generated using Mann–Whitney U-test. See also Supplementary Fig. 7b.
Fig. 6
Fig. 6. Pathways predict gene essentiality.
a ‘Stathmin resistance to anti-microtubule’ pathway activity levels in CLTC-essential and -inert NSCLC cell lines. Error bars represent the standard deviation. P-values were generated using Mann–Whitney U-test. b Stathmin pathway activity levels in sensitive and not-sensitive NSCLC cell lines to PITSTOP2 (CLTC inhibitor). c Network diagram representing the Stathmin resistance to anti-microtubule pathway. d ROC analysis was constructed to evaluate the prognostic power of the Stathmin pathway versus the 13 pathway genes and CLTC. The AUC was used to quantify response prediction. e Box plots of Stathmin pathway activity levels in NSCLC tumor samples and their adjacent normal tissues in four independent datasets. Error bars represent the standard deviation. P-values were generated using Mann–Whitney U-test. f Violin plot of ‘Role of BRCA1, BRCA2, and ATR in cancer susceptibility’ pathway activity levels in MAD2L1 essential and inert breast cancer cell lines from the Achilles project. Dots are colored by BRCA1/2 mutation status. P-values were generated using Mann–Whitney U-test. g BRCA pathway activity levels in MAD2L1 essential and inert breast cancer cell lines from project DRIVE. Dots are colored by BRCA1/2 mutation status. P-values were generated using Mann–Whitney U-test. h Network diagram representing the ‘Role of BRCA1, BRCA2, and ATR in cancer susceptibility’ pathway. P-values were generated using Mann–Whitney U-test. i BRCA pathway activity levels in breast cancer patients with pathogenic, non-pathogenic, or wild-type BRCA1/2 mutation in six independent cohorts. Error bars represent the standard deviation. P-values were generated using Mann–Whitney U-test. See also Supplementary Fig. 8.

References

    1. Berger MF, Mardis ER. The emerging clinical relevance of genomics in cancer medicine. Nat. Rev. Clin. Oncol. 2018;15:353–365. - PMC - PubMed
    1. Lee E, Chuang H-Y, Kim J-W, Ideker T, Lee D. Inferring pathway activity toward precise disease classification. PLoS Comput. Biol. 2008;4:e1000217. - PMC - PubMed
    1. Davies H, et al. Mutations of the BRAF gene in human cancer. Nature. 2002;417:949. - PubMed
    1. Solit DB, et al. BRAF mutation predicts sensitivity to MEK inhibition. Nature. 2006;439:358–362. - PMC - PubMed
    1. McArthur GA, et al. Safety and efficacy of vemurafenib in BRAF(V600E) and BRAF(V600K) mutation-positive melanoma (BRIM-3): extended follow-up of a phase 3, randomised, open-label study. Lancet Oncol. 2014;15:323–332. - PMC - PubMed

Publication types

MeSH terms