. 2020 Jul 3;10(1):11019.
doi: 10.1038/s41598-020-67513-5.

Enhancing droplet-based single-nucleus RNA-seq resolution using the semi-supervised machine learning classifier DIEM

Affiliations

Enhancing droplet-based single-nucleus RNA-seq resolution using the semi-supervised machine learning classifier DIEM

Marcus Alvarez et al. Sci Rep. .

Abstract

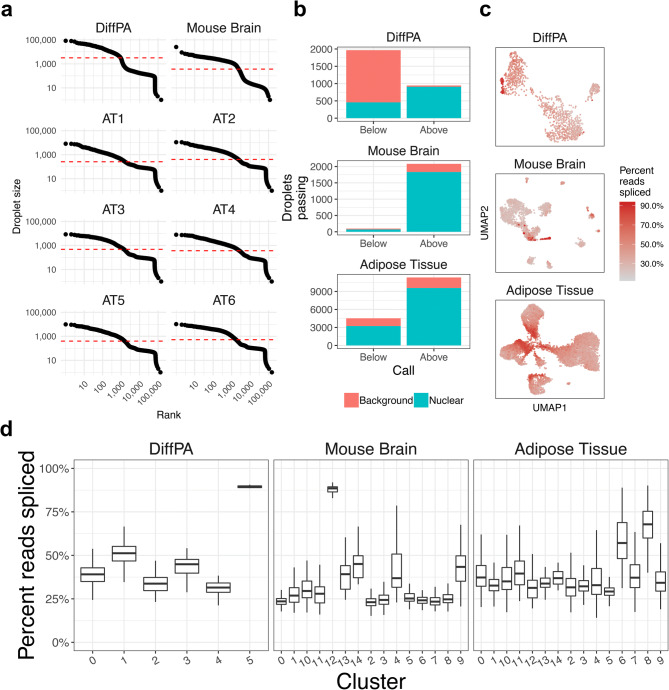
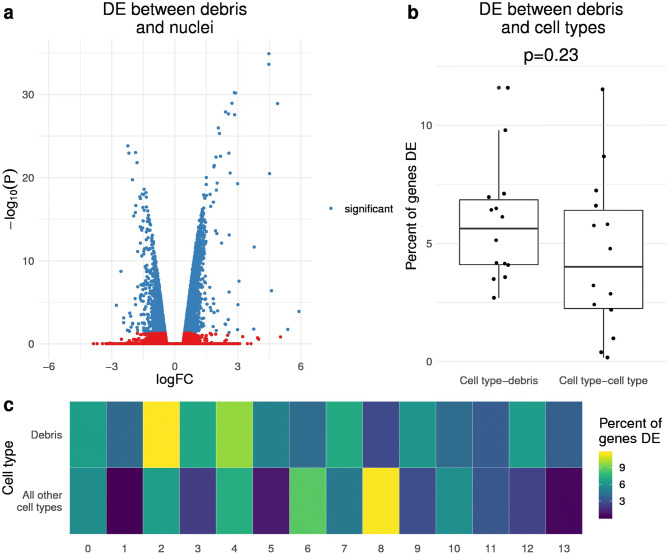
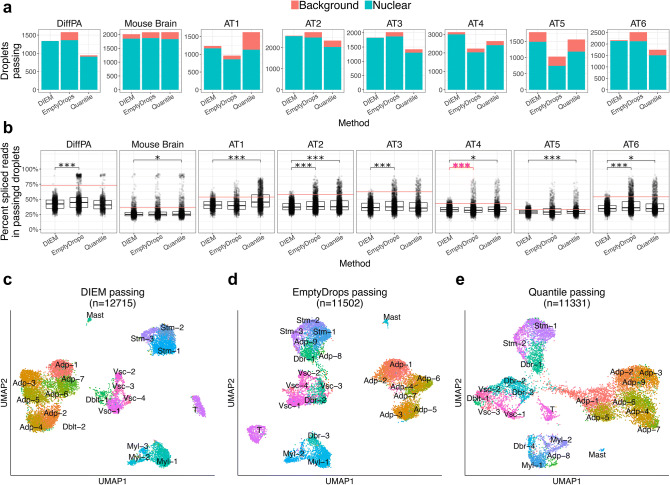
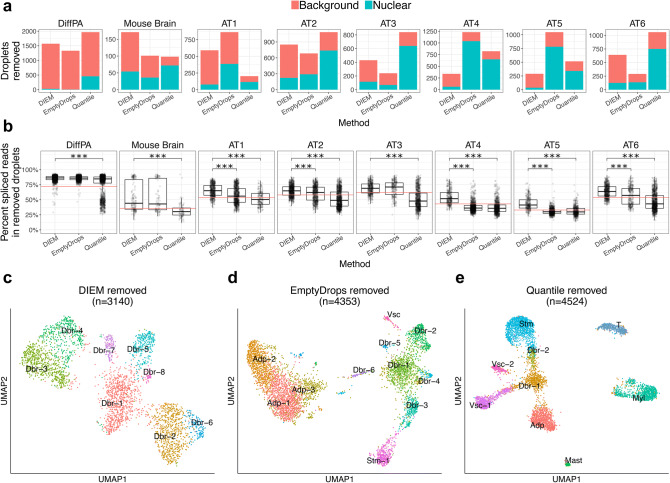
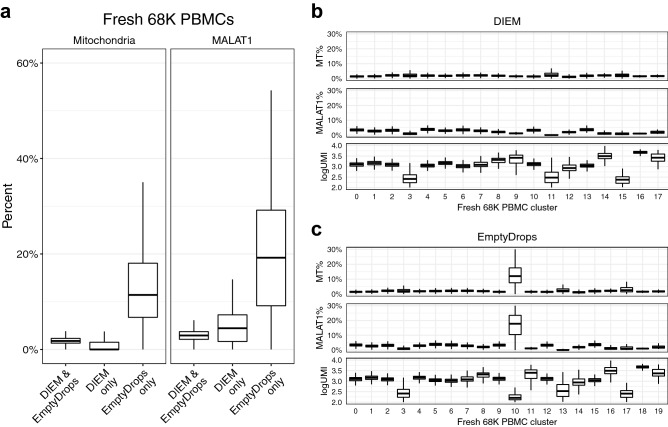
Single-nucleus RNA sequencing (snRNA-seq) measures gene expression in individual nuclei instead of cells, allowing for unbiased cell type characterization in solid tissues. We observe that snRNA-seq is commonly subject to contamination by high amounts of ambient RNA, which can lead to biased downstream analyses, such as identification of spurious cell types if overlooked. We present a novel approach to quantify contamination and filter droplets in snRNA-seq experiments, called Debris Identification using Expectation Maximization (DIEM). Our likelihood-based approach models the gene expression distribution of debris and cell types, which are estimated using EM. We evaluated DIEM using three snRNA-seq data sets: (1) human differentiating preadipocytes in vitro, (2) fresh mouse brain tissue, and (3) human frozen adipose tissue (AT) from six individuals. All three data sets showed evidence of extranuclear RNA contamination, and we observed that existing methods fail to account for contaminated droplets and led to spurious cell types. When compared to filtering using these state of the art methods, DIEM better removed droplets containing high levels of extranuclear RNA and led to higher quality clusters. Although DIEM was designed for snRNA-seq, our clustering strategy also successfully filtered single-cell RNA-seq data. To conclude, our novel method DIEM removes debris-contaminated droplets from single-cell-based data fast and effectively, leading to cleaner downstream analysis. Our code is freely available for use at https://github.com/marcalva/diem.


Conflict of interest statement

The authors declare no competing interests.

Figures

Figure 1
Figure 1
Applying a hard count threshold fails to remove droplets contaminated with background RNA in snRNA-seq. (a) Barcode-rank plots showing the droplet size (the total number of UMI read counts) of each droplet in descending order for the differentiating preadipocytes (DiffPA), mouse brain, and six human frozen adipose tissue (AT) snRNA-seq samples. The dotted red line indicates the quantile-based threshold. (b) The number of droplets above and below the quantile-based hard-count threshold is shown. The height of the red bar indicates the number of background droplets in the category indicated in the x-axis, while the height of the blue bar indicates the number of nuclear droplets. Background and nuclear droplets are defined using the percent spliced reads. Ideally, all nuclear droplets would occur above the threshold and all background droplets would occur below. (c) UMAP visualization of droplets in each of the three data sets with droplets colored by the percent of reads spliced. (d) The droplets above the quantile threshold were clustered using Seurat. The x-axis shows the clusters, and the y-axis shows the distribution of the percent of reads spliced for each cluster. Background droplets with a high percent of reads spliced tend to cluster together.
Figure 2
Figure 2
Debris-containing and nuclei-containing droplets show distinct gene expression profiles. (a) Differential expression (DE) between droplets with less than 100 UMI counts (debris) and greater than or equal to 100 UMI counts (nuclei) in the 6 human adipose tissue (AT) samples. The volcano plot shows the log fold change on the x-axis and negative log transformed p-value on the y-axis. The genes colored in blue are DE with a Bonferroni-corrected p-value < 0.05. A positive log fold change indicates over-expression in the debris group. (b, c) For each of the 14 cell types identified after clustering the quantile filtered droplets, we ran differential expression between the cell type and the debris group, or between the cell type and all other cell types in the combined adipose tissue data set. Cell types are estimated from clustering droplets that pass quantile-based filtering. A (b) box plot shows the percent of expressed genes that are DE (Bonferroni p < 0.05) between a cell type-debris pair, and a cell type-cell type pair. The p-value was calculated from a student’s t-test between cell type-debris percent and cell type-cell type percent. The (c) heatmap shows the percent of total genes expressed in the cell type (x-axis column) that are significantly differentially expressed between the debris droplets (first row) or droplets in all other cell types (second row). This shows that the DE between a cell type and the debris group is similar to the DE between different cell types.
Figure 3
Figure 3
Debris scoring predicts background RNA contamination in snRNA-seq droplets. (a) Overview of DIEM approach to remove debris-contaminated droplets. Expectation Maximization (EM) is used to estimate the parameters of a multinomial mixture model consisting of debris and cell type groups. The label assignments of droplets below a pre-specified threshold (100 total counts) are fixed to the debris group, while the test set droplets above this rank are allowed to change group membership. The mixture model is initialized by running k-means. After parameter estimation, droplets are grouped into the debris cluster(s) or cell type clusters based on their posterior probabilities. Debris scores are calculated for each droplet by summing the normalized expression of debris-enriched genes, which are specified by differential expression between the debris and cell type clusters. Droplets can be filtered based on their cluster assignment or on their debris score. (b) The debris score of a droplet and the percent of reads spliced exhibit a significant correlation in the differentiating preadipocytes (DiffPA), mouse brain, and human frozen adipose tissue (AT) data sets (mean R = 0.89). The horizontal red line indicates the sample-specific midpoint that separates nuclear and background droplets. The vertical blue line indicates the threshold cutoff of 0.5 we used, where droplets with a debris score less than 0.5 are classified as clean. c, Scatterplots of droplets from snRNA-seq of the DiffPA, mouse brain, and AT data sets, with total unique molecular index (UMI) counts on the x-axis and total number of genes detected on the y-axis. Droplets are colored by the DIEM classification. Those in red are removed as debris while the blue droplets are kept as nuclei.
Figure 4
Figure 4
DIEM filtering keeps an increased number and proportion of nuclear droplets in snRNA-seq. (a) The bar plots show the number and type of droplets that pass the indicated filtering method in the differentiating preadipocytes (DiffPA), mouse brain, and six human frozen adipose tissue (AT) snRNA-seq samples. The height of the blue bar indicates the number of nuclear droplets that pass filtering, while the height of the red bar indicates the number of background droplets. DIEM filtering tends to result in a higher number and proportion of nuclear droplets. Background and nuclear droplets are defined using the percent spliced reads. (b) The percent of reads spliced is shown in a boxplot for droplets that pass the indicated filtering method in the DiffPA, mouse brain, and six AT snRNA-seq samples. The horizontal red line indicates the sample-specific midpoint, where droplets above and below are background and nuclear, respectively. A Mann-Whitney U test was performed between DIEM and EmptyDrops, and DIEM and quantile-filtered droplets. DIEM shows a decrease in percent spliced reads for all comparisons (black bar and asterisks) except for AT4 with EmptyDrops (red bar and asterisks). P-values were corrected for multiple testing using Bonferroni and are shown in the upper portion of the plot (*p < 0.05; **p < 0.005; ***p < 0.0005). (c) UMAP visualization of clusters after filtering with the indicated method in the combined adipose tissue snRNA-seq data set. Clusters were identified with Seurat and classified as adipocyte (Adp), doublet (Dblt), myeloid (Myl), T cell, mast, and stromal (Stm) cell types according to their up-regulated genes. A cluster was classified as debris (Dbr) if it had a mean percent of spliced reads above 50%.
Figure 5
Figure 5
DIEM filtering removes fewer numbers of nuclei in snRNA-seq. (a) The bar plots show the number and type of droplets that are removed by the indicated filtering method in the differentiating preadipocytes (DiffPA), mouse brain, and six human frozen adipose tissue (AT) snRNA-seq samples. The height of the blue bar indicates the number of nuclear droplets that are removed while the height of the red bar indicates the number of background droplets. Background and nuclear droplets are defined using the percent spliced reads. DIEM filtering tends to result in a higher number and proportion of nuclear droplets. Removal of large numbers of nuclear droplets and low numbers of background droplets indicates poor performance. (b) The percent of reads spliced is shown in a boxplot for droplets removed by the filtering method in the DiffPA, mouse brain, and six AT snRNA-seq samples. The horizontal red line indicates the sample-specific midpoint, where droplets above and below are background and nuclear, respectively. A Mann-Whitney U test was performed between DIEM and EmptyDrops, and DIEM and quantile removed droplets. DIEM shows an increase in percent of reads spliced for all comparisons. P-values were corrected for multiple testing using Bonferroni and are shown in the upper portion of the plot (*p < 0.05; **p < 0.005; ***p < 0.0005). (c) UMAP visualization of clustering of removed droplets with the indicated method in the combined adipose tissue snRNA-seq data set. Clusters were classified as adipocyte (Adp), doublet (Dblt), myeloid (Myl), T cell, mast, and stromal (Stm) cell types according to their up-regulated genes. A cluster was classified as debris (Dbr) if it had a mean percent of spliced reads above 50%.
Figure 6
Figure 6
DIEM filtering in single-cell RNA-seq of fresh PBMCs results in robust cell type identification. (a) Boxplots showing the percent of unique molecular indices (UMIs) mapping to the mitochondria (left) and the percent of MALAT1 UMIs (right) in the fresh 68 K peripheral blood mononuclear cells (PBMC) data set. The DIEM and EmptyDrops set includes the droplets identified by both DIEM and EmptyDrops (n = 75,658), while the EmptyDrops only set (n = 1,927) and the DIEM only set (n = 189) include droplets uniquely kept by each method. The droplets uniquely kept by EmptyDrops have a higher percent of reads aligned to the mitochondrial and MALAT1 genes, consistent with a ruptured cell membrane. (b, c) Boxplots show the percent of UMIs aligning to the mitochondrial genome (MT%), to the nuclear-localized MALAT1 (MALAT1%), and the log total number of UMIs in a droplet for clusters in the PBMC single-cell RNA-seq data set. These measures are plotted for the (b) clusters from the DIEM-kept droplets and the (c) clusters from the EmptyDrops-kept droplets. Clusters were identified with Seurat. The droplets uniquely kept by EmptyDrops form a distinct cluster with high MT% and MALAT1%.

References

    1. Patel AP, et al. Single-cell RNA-seq highlights intratumoral heterogeneity in primary glioblastoma. Science. 2014;344:1396–1401. doi: 10.1126/science.1254257. - DOI - PMC - PubMed
    1. Baron M, et al. A single-cell transcriptomic map of the human and mouse pancreas reveals inter- and intra-cell population structure. Cell Syst. 2016;3:e4.346–e4.360. - PMC - PubMed
    1. Macosko EZ, et al. Highly parallel genome-wide expression profiling of individual cells using nanoliter droplets. Cell. 2015;161:1202–1214. doi: 10.1016/j.cell.2015.05.002. - DOI - PMC - PubMed
    1. Habib N, et al. Massively parallel single-nucleus RNA-seq with DroNc-seq. Nat. Methods. 2017;14:955–958. doi: 10.1038/nmeth.4407. - DOI - PMC - PubMed
    1. Habib N, et al. Div-Seq: single-nucleus RNA-seq reveals dynamics of rare adult newborn neurons. Science. 2016;353:925–928. doi: 10.1126/science.aad7038. - DOI - PMC - PubMed

Publication types