. 2020 Jul 3;10(1):11021.
doi: 10.1038/s41598-020-67937-z.

HEBE, a novel positive regulator of senescence in Solanum lycopersicum

Affiliations

HEBE, a novel positive regulator of senescence in Solanum lycopersicum

Sara Forlani et al. Sci Rep. .

Abstract

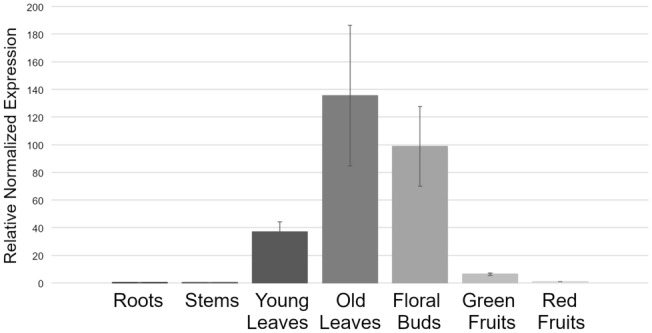
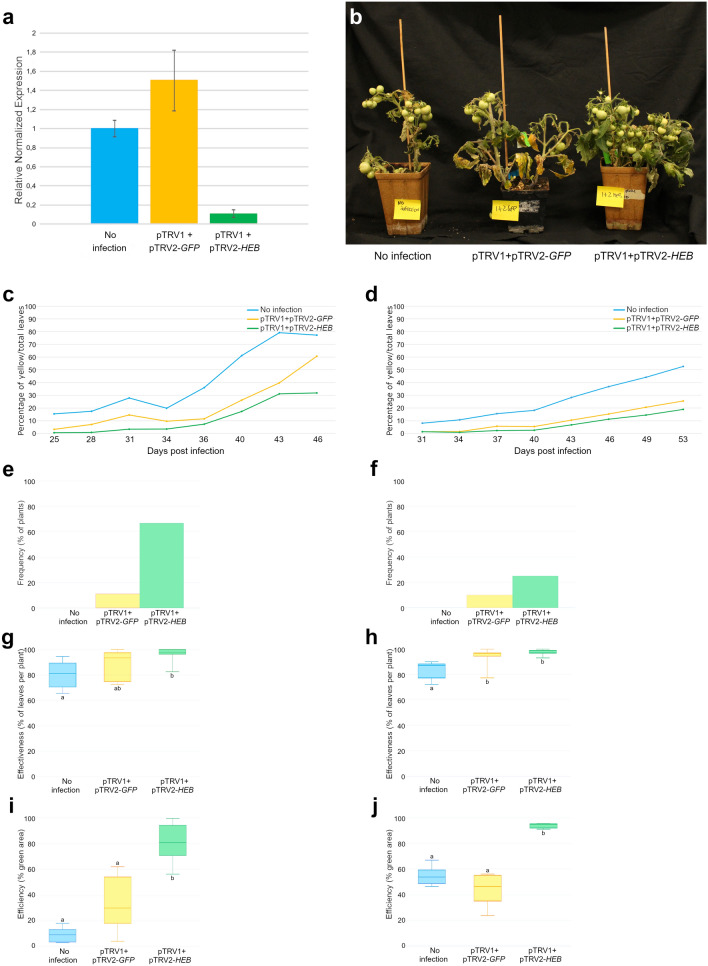
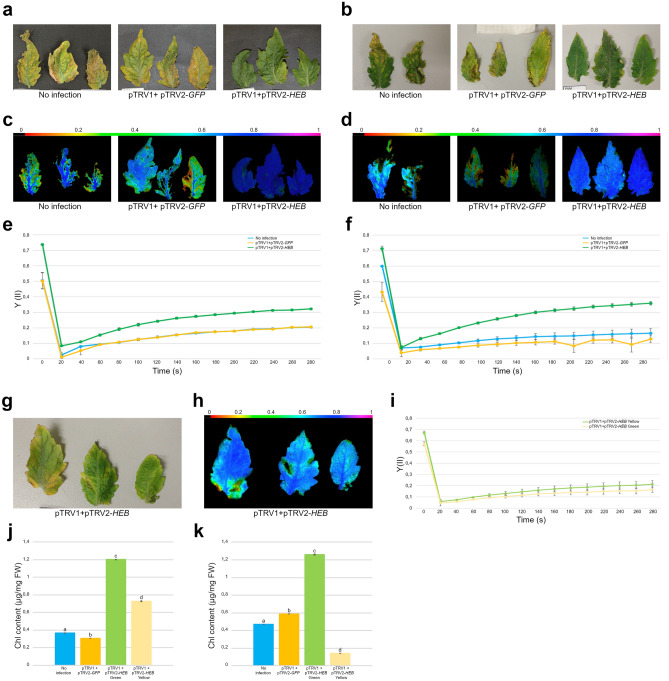
Leaf senescence and plant aging are traits of great interest for breeders. Senescing cells undergo important physiological and biochemical changes, while cellular structures such as chloroplasts are degraded with dramatic metabolic consequences for the whole plant. The possibility of prolonging the photosynthetic ability of leaves could positively impact the plant's life span with benefits for biomass production and metabolite accumulation; plants with these characteristics display a stay-green phenotype. A group of plant transcription factors known as NAC play a pivotal role in controlling senescence: here we describe the involvement of the tomato NAC transcription factor Solyc12g036480, which transcript is present in leaves and floral buds. Since its silencing delays leaf senescence and prevents plants from ageing, we renamed Solyc12g0364 HḖBĒ, for the Greek goddess of youth. In this manuscript we describe how HEB downregulation negatively affects the progression of senescence, resulting in changes in transcription of senescence-promoting genes, as well as the activity of enzymes involved in chlorophyll degradation, thereby explaining the stay-green phenotype.


Conflict of interest statement

The authors declare no competing interests.

Figures

Figure 1
Figure 1
qRT-PCR performed on HEB transcript in different organs at different developmental stages. HEB is transcribed in leaves (young and senescing) and in flower buds. Bars represent the average of three technical replicates and error bars indicate standard deviation. Three independent replicates were performed and a representative experiment is shown.
Figure 2
Figure 2
(a) qRT-PCR analysis to evaluate HEB downregulation, cDNA of terminal leaflets at 24 dpi has been used; HEB silencing occurs only in plants co-infiltrated with both pTRV1 and pTRV2-HEB. Bars represent the average of three technical replicates and error bars indicate standard deviation. Three independent replicates were performed and a representative experiment is shown. (b) From the left: not infected plants, pTRV1 + pTRV2-GFP and pTRV1 + pTRV2-HEB. HEB downregulation prevents senescence, pTRV1 + pTRV2-HEB co-infected plants display a stay-green phenotype. (cj) Quantification of the phenotype and VIGS evaluation over the two infections performed: (c,e,g,i) refer to the first infection; (d,f,h,j) refer to the second infection. (c,d) Percentage of yellow leaves (number of yellow leaves/number of total leaves), data were collected by two different infections (n = 10 plants for each infection). (e,f) HEB silencing frequency: percentage of plants that exhibited green leaves. 10 plants were infected per each replica. (g,h) HEB silencing effectiveness, percentage of green leaves (number of green leaves/number of total leaves); data were collected by two independent infections [n = 310 leaves for the first infection (g), n = 600 leaves for the second infection (h)]. (i,j) HEB silencing efficiency: percentage of green leaf area on the total leaf area, referred to two different infections (n = 5 for each infection). Letters above or below the bars (g-j) display statistical difference based on Tukey HSD test at P ≤ 0.05.
Figure 3
Figure 3
(af,j,k) Analyses of the phenotype over the two infections performed: (a,c,e,j) refer to the first infection; (b,d,f, k) refer to the second infection. (a,b) Comparison between pTRV1 + pTRV2-HEB infected leaves and controls (No infection and pTRV1 + pTRV2-GFP) revealed that HEB silencing delays senescence. (c,d) Visual aspect of PSII quantum yields (Fv/Fm, Imaging PAM) of pTRV1 + pTRV2-HEB infected leaves and controls. The tissue color indicates the maximum quantum yield of PSII, ranging from black (no efficiency) to violet (maximum efficiency) as shown by the colored bar on the top. (e,f) Y(II) of pTRV1 + pTRV2-HEB infected leaves and controls. Dots represent the average of 3 technical replicates and error bars indicate standard error. In each time point, statistical differences between pTRV1 + pTRV2-HEB and the controls was assessed with Tukey HSD test at P ≤ 0.05. A representative result from three independent experiments is shown. (g) pTRV1 + pTRV2-HEB older leaves (65 dpi) display yellow and light green spots. (h) Visual aspect and PSII quantum yield (Fv/Fm, Imaging PAM) of pTRV1 + pTRV2-HEB older leaves. (i) Measurement of Y(II) in pTRV1 + pTRV2-HEB older leaves. Dots represent the average of three technical replicates and error bars indicate standard error. In each time point, statistical differences between pTRV1 + pTRV2-HEB green and yellow sectors was assessed with Tukey HSD test at P ≤ 0.05. A representative result from three independent experiments is shown. (j,k) Chlorophyll content quantification in green/yellow sectors of pTRV1 + pTRV2-HEB infected leaves and in controls at 53 (j) and 60 (k) dpi. Bars represent the average of 3 technical replicates and error bars indicate standard error. Letters above the bars (j,k) display statistical difference based on Tukey HSD test at P ≤ 0.01. A representative result from three independent experiments is shown.
Figure 4
Figure 4
Quantification by qRT-PCR of the expression of HEB, SlSAG12, SlSAG113, SlNYC1, SlSGR1 and SlPaO from pTRV1 + pTRV2-HEB, pTRV1 + pTRV2-GFP and not infected leaves at the same developmental stage (65 dpi). HEB and all the senescence-related genes resulted to be downregulated in pTRV1 + pTRV2-HEB leaves compared to the controls. Bars represent the average of three technical replicates and error bars indicate standard deviation. Two independent replicates were performed and a representative experiment is shown.
Figure 5
Figure 5
(a) qRT-PCR analysis on mRNAs from green and yellow portions of pTRV1 + pTRV2-HEB infected leaves. The expression of HEB is strongly reduced in the green sections. Bars represent the average of three technical replicates and error bars indicate standard deviation. Three independent replicates were performed and a representative experiment is shown. (b) Quantification by qRT-PCR of the expression of senescence-related genes SlSAG12, SlSAG113, SlNYC1, SlSGR1 and SlPaO, in green/yellow regions of pTRV1 + pTRV2-HEB infected leaves. A general downregulation of senescence-associated genes is recorded in the green sectors, especially SlSAG12 is strongly reduced. Bars represent the average of three technical replicates and error bars indicate standard deviation. Three independent replicates were performed and a representative experiment is shown. (c) Immunoblot analyses were performed to evaluate the presence and the amount of chlorophyll associated proteins in green/yellow regions. While the chlorophyll-binding proteins Lhca1, Lhca4, Lhcb1 and Lhcb4 accumulation is slightly reduced in the yellow sectors, compared to the green ones, the catalytic enzyme PaO, involved in chlorophyll degradation, is more abundant in the yellow areas. The histone protein H3 was used as loading control, together with a Coomassie Brilliant Blue (C.B.B.) staining of the SDS-PAGE. A representative result from three independent experiments is shown.

References

    1. Woo HR, Masclaux-Daubresse C, Lim PO. Plant senescence: how plants know when and how to die. J. Exp. Bot. 2018;69:715–718. - PMC - PubMed
    1. Buchanan-Wollaston V. Senescence processes in plants. Annual plant review, volume 26. Ann. Bot. 2008;101:197.
    1. Kim HJ, et al. Time-evolving genetic networks reveal a NAC troika that negatively regulates leaf senescence in Arabidopsis. Proc. Natl. Acad. Sci. 2018;115:E4930–E4939. - PMC - PubMed
    1. Gregersen PL, Holm PB, Krupinska K. Leaf senescence and nutrient remobilisation in barley and wheat. Plant Biol. 2008;10(Suppl 1):37–49. - PubMed
    1. Watanabe M, et al. Comprehensive dissection of spatiotemporal metabolic shifts in primary, secondary, and lipid metabolism during developmental senescence in Arabidopsis. Plant Physiol. 2013;162:1290–1310. - PMC - PubMed

Publication types