. 2020 Jul 3;11(1):3357.
doi: 10.1038/s41467-020-16970-7.

Increasing trends in regional heatwaves

Affiliations

Increasing trends in regional heatwaves

S E Perkins-Kirkpatrick et al. Nat Commun. .

Abstract

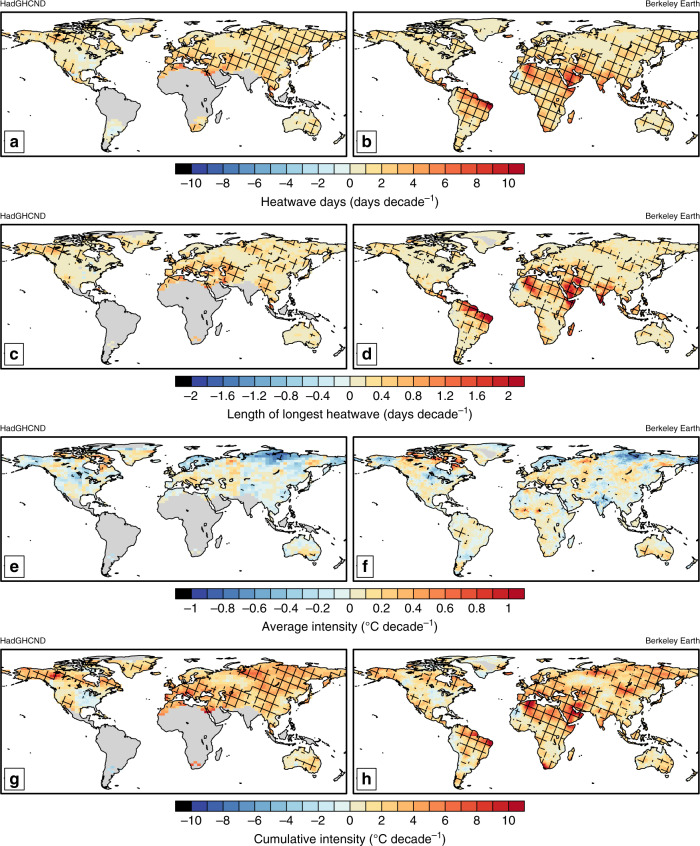
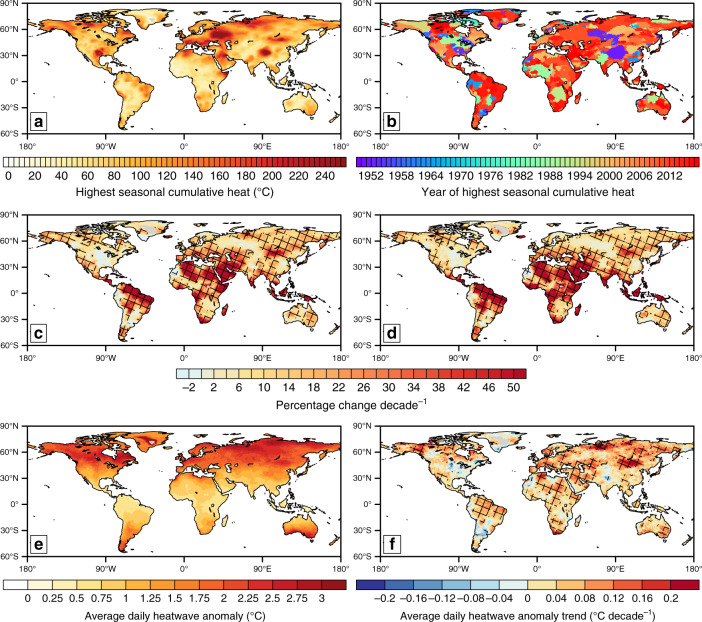
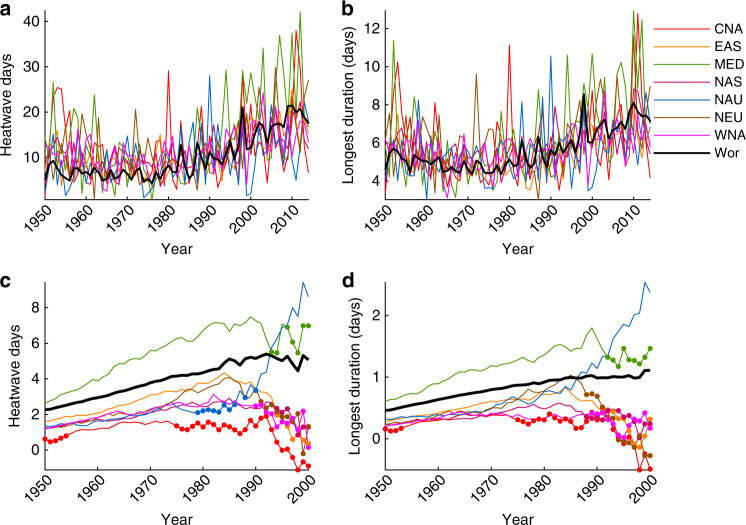
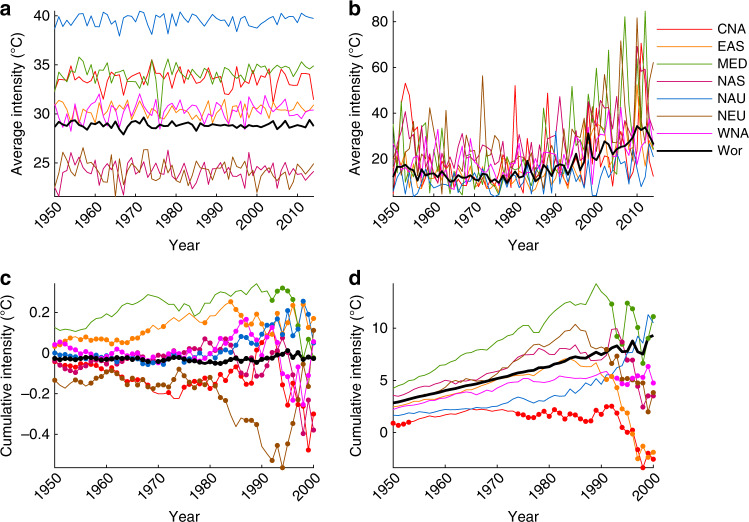
Heatwaves have increased in intensity, frequency and duration, with these trends projected to worsen under enhanced global warming. Understanding regional heatwave trends has critical implications for the biophysical and human systems they impact. Until now a comprehensive assessment of regional observed changes was hindered by the range of metrics employed, underpinning datasets, and time periods examined. Here, using the Berkeley Earth temperature dataset and key heatwave metrics, we systematically examine regional and global observed heatwave trends. In almost all regions, heatwave frequency demonstrates the most rapid and significant change. A measure of cumulative heat shows significant increases almost everywhere since the 1950s, mainly driven by heatwave days. Trends in heatwave frequency, duration and cumulative heat have accelerated since the 1950s, and due to the high influence of variability we recommend regional trends are assessed over multiple decades. Our results provide comparable regional observed heatwave trends, on spatial and temporal scales necessary for understanding impacts.


Conflict of interest statement

The authors declare no competing interests.

Figures

Fig. 1
Fig. 1. Global maps of observed decadal heatwave trends.
Trends in seasonal heatwave days (a, b); length of longest heatwave (c, d); average heatwave intensity (e, f); and cumulative heat (g, h) for quasi-global observational dataset HadGHCND (a, c, e, g) and global observational dataset Berkeley Earth (b, d, f, h) over the period 1950−2014. Trends are expressed as days decade−1 for (ad), and °C decade−1 for (eh).
Fig. 2
Fig. 2. Global maps of cumulative heat statistics.
The highest seasonal cumulative heat (sum of anomalies relative to the calendar-day 90th percentile) (a); the year in which this value occurs (b); decadal trends in the percentage change of cumulative heat (c) and heatwave days (d); the average anomaly of a heatwave day (e) and the respective decadal trend (f). All values are calculated for the global observational dataset Berkeley Earth, for 1950−2017.
Fig. 3
Fig. 3. Heatwave regional and global timeseries.
Selected timeseries of heatwave days (a); and length of longest heatwave (b). Decadal trends in heatwave days (c); and length of longest heatwave (d) commencing yearly between 1950 and 2000 and truncating in 2017. All values are calculated for the global observational dataset Berkeley Earth (see “Methods”). Closed circles in (c) and (d) indicate when trends commencing in that year are NOT statistically significant at the 5% level (see “Methods”). Regions displayed are Central North America (CNA), East Asia (EAS), Mediterranean (MED), North Asia (NAS), North Australia (NAU), North Europe (NEU), West North America (WNA), and the global average (Wor).
Fig. 4
Fig. 4. Heatwave regional and global timeseries.
Selected timeseries of average heatwave intensity (a); and cumulative heat (b). Decadal trends in average heatwave intensity (c); and cumulative heat (d) commencing yearly between 1950 and 2000 and truncating in 2017. All values are calculated for the global observational dataset Berkeley Earth (see “Methods”). Closed circles in (c) and (d) indicate when trends commencing in that year are NOT statistically significant at the 5% level (see “Methods”). Regions displayed are Central North America (CNA), East Asia (EAS), Mediterranean (MED), North Asia (NAS), North Australia (NAU), North Europe (NEU), West North America (WNA), and the global average (Wor).

References

    1. Perkins SE, Alexander LV. On the measurement of heat waves. J. Clim. 2013;26:4500–4517. doi: 10.1175/JCLI-D-12-00383.1. - DOI
    1. McMichael AJ, Lindgren E. Climate change: present and future risks to health, and necessary responses. J. Intern. Med. 2011;270:401–413. doi: 10.1111/j.1365-2796.2011.02415.x. - DOI - PubMed
    1. Thornton PK, van de Steeg J, Notenbaert A, Herrero M. The impacts of climate change on livestock and livestock systems in developing countries: a review of what we know and what we need to know. Agric. Syst. 2009;101:113–127. doi: 10.1016/j.agsy.2009.05.002. - DOI
    1. Lobell DB, Field CB. Global scale climate–crop yield relationships and the impacts of recent warming. Environ. Res. Lett. 2007;2:01400. doi: 10.1088/1748-9326/2/1/014002. - DOI
    1. Kjellstrom T. Impact of climate conditions on occupational health and related economic losses: a new feature of global and urban health in the context of climate change. Asia Pac. J. Public Health. 2016;28:28S–37S. doi: 10.1177/1010539514568711. - DOI - PubMed

Publication types