. 2020 Jul 3;11(1):3327.
doi: 10.1038/s41467-020-17148-x.

Engineering monocyte/macrophage-specific glucocerebrosidase expression in human hematopoietic stem cells using genome editing

Affiliations

Engineering monocyte/macrophage-specific glucocerebrosidase expression in human hematopoietic stem cells using genome editing

Samantha G Scharenberg et al. Nat Commun. .

Erratum in

Abstract

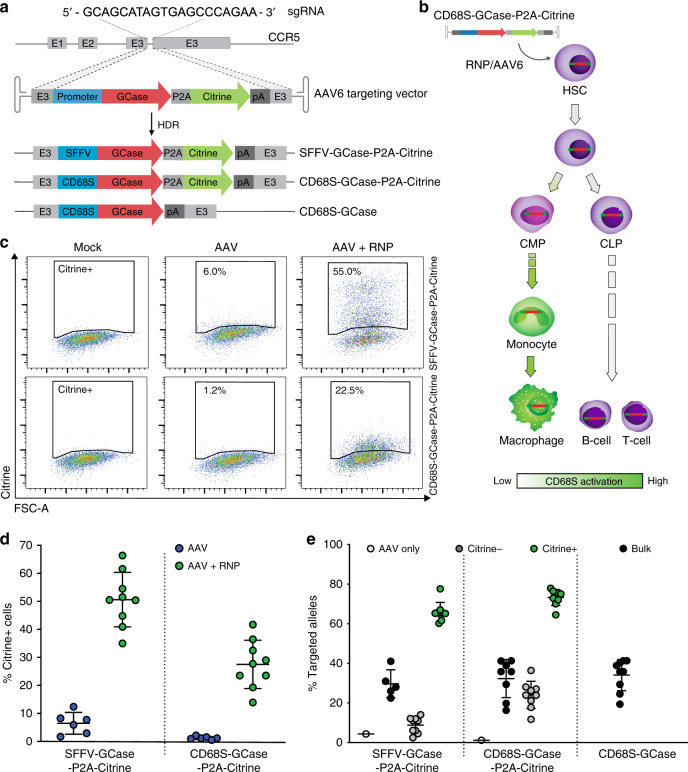
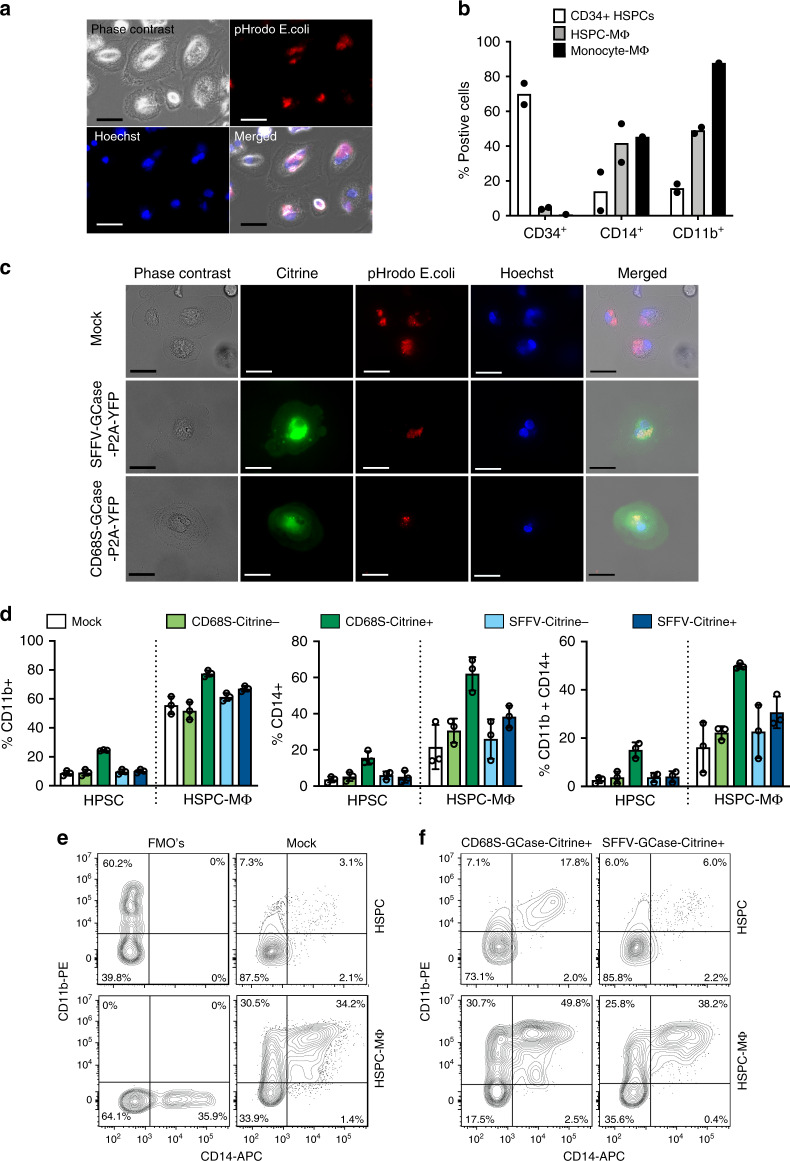
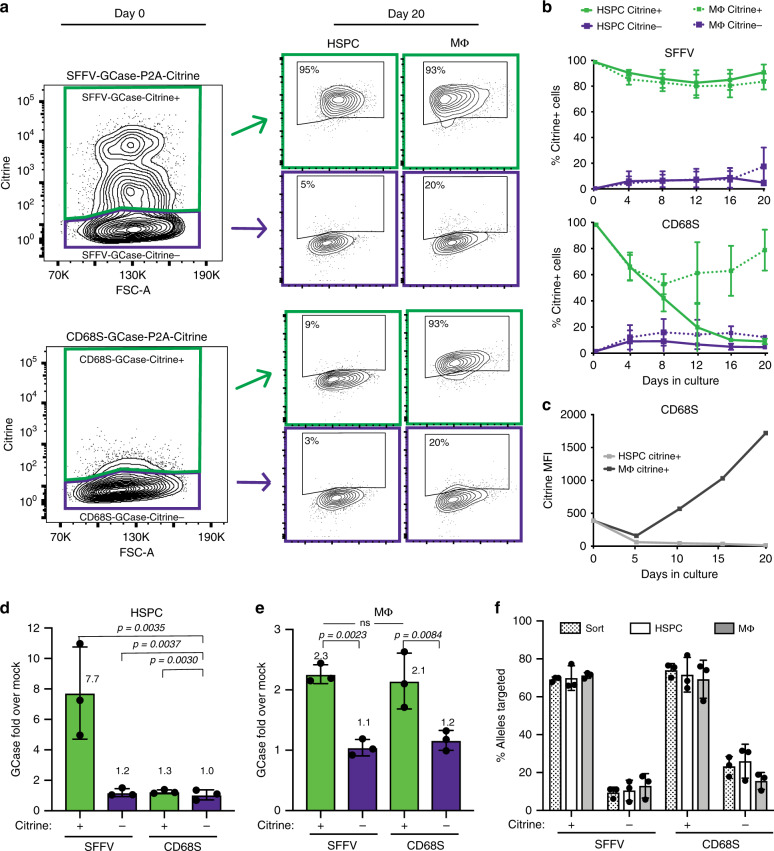
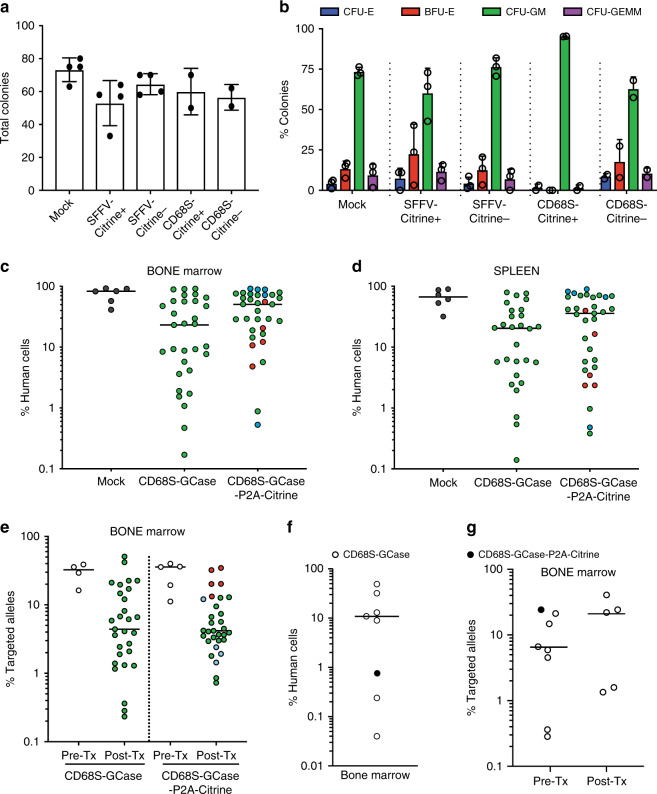
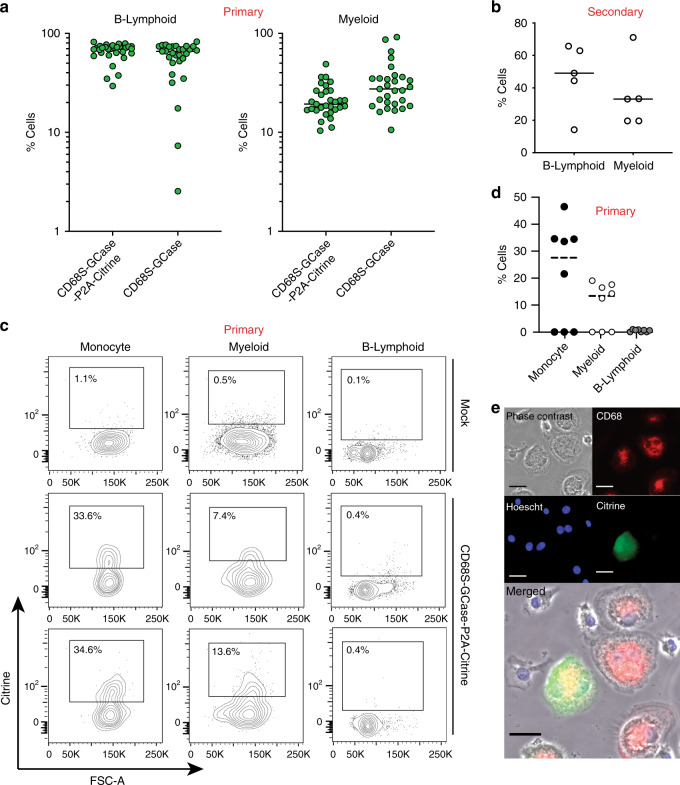
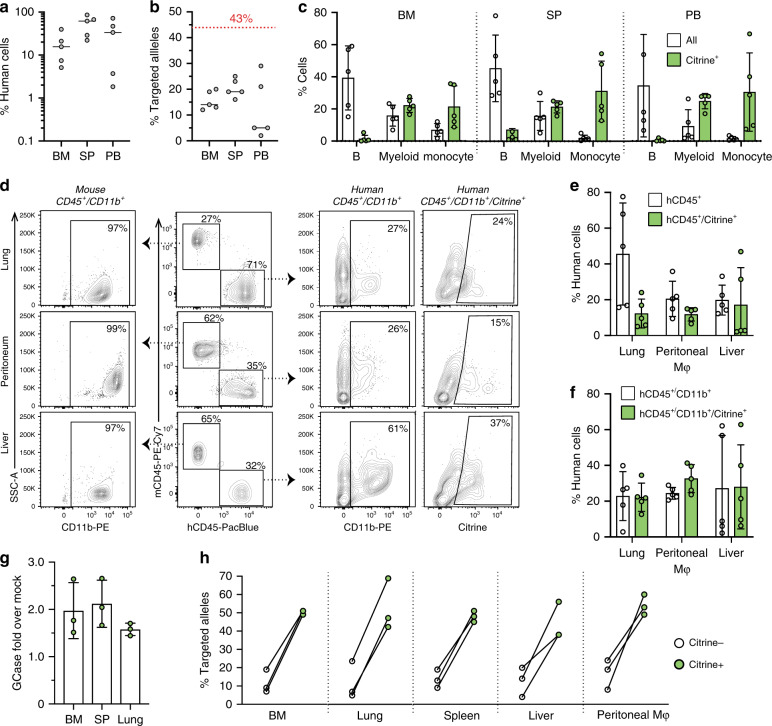
Gaucher disease is a lysosomal storage disorder caused by insufficient glucocerebrosidase activity. Its hallmark manifestations are attributed to infiltration and inflammation by macrophages. Current therapies for Gaucher disease include life-long intravenous administration of recombinant glucocerebrosidase and orally-available glucosylceramide synthase inhibitors. An alternative approach is to engineer the patient's own hematopoietic system to restore glucocerebrosidase expression, thereby replacing the affected cells, and constituting a potential one-time therapy for this disease. Here, we report an efficient CRISPR/Cas9-based approach that targets glucocerebrosidase expression cassettes with a monocyte/macrophage-specific element to the CCR5 safe-harbor locus in human hematopoietic stem and progenitor cells. The targeted cells generate glucocerebrosidase-expressing macrophages and maintain long-term repopulation and multi-lineage differentiation potential with serial transplantation. The combination of a safe-harbor and a lineage-specific promoter establishes a universal correction strategy and circumvents potential toxicity of ectopic glucocerebrosidase in the stem cells. Furthermore, it constitutes an adaptable platform for other lysosomal enzyme deficiencies.


Conflict of interest statement

M.H.P. declares that he is a consultant and has equity interest in CRISPR Tx and Allogene Tx, and he states that neither company has had input or opinions on the subject matter described in this manuscript. The other authors declare no competing interests.

Figures

Fig. 1
Fig. 1. Efficient targeting of GCase to the CCR5 locus in human HSPCs 48-hours post-modification.
a Schematic of gene targeting mediated by sgRNA/Cas9 RNP and rAAV targeting vectors where E1-3 are CCR5 exons. b Schematic of expected CD68S promoter activity. Green indicates activation. c Representative flow plots of Citrine expression versus forward scatter (FSC) for HSPCs without treatment (mock), treated with rAAV alone (AAV), and treated with RNP and rAAV (RNP+AAV). d Flow cytometric quantification of Citrine+ HSPCs targeted with SFFV-GCase-P2A-Citrine and CD68S-GCase-P2A-Citrine vectors in the presence (green circles) or absence (blue circles) of RNP (n = 9 biologically independent human donor samples). e Percent of CCR5 alleles with integrated CD68S-GBA-P2A-Citrine and SFFV-GBA-P2A-Citrine cassettes in AAV only (white), bulk (black), FACS-enriched Citrine– (gray) and Citrine+ (green) HSPCs, and in bulk CD68S-GCase-targeted cells (black). Data shown as mean ± SD. Source data are provided as a Source Data file.
Fig. 2
Fig. 2. Generation of human GCase-macrophages from genome-edited HSPCs.
a Representative images showing phase contrast, phagosomes visualized by pHrodo-labeled E.coli (red), and nuclei (blue) in mock-treated human HSPCs after 20 days in macrophage differentiation media for one of the two samples analyzed in b. Scale bar 10 µm. b Human CD34, CD14, and CD11b marker expression in HSPC-derived macrophages (HSPC-MΦ) and human monocyte-derived macrophages (Monocyte- MΦ) after in vitro differentiation compared to undifferentiated cells (CD34+ HSPCs) (n = 2 biologically independent human donor samples). c Representative images showing phase contrast, Citrine expression (green), phagosomes visualized by pHrodo-labeled E.coli (red), and nuclei (blue) in mock-treated, SFFV-GCase-P2A-Citrine, and CD68S-GCase-P2A-Citrine targeted macrophages for one of the three samples analyzed in d. Scale bar 20 µm. d Human CD14, and CD11b marker expression in mock-treated (white), CD68S-GCase-P2A-Citrine targeted (Citrine–: light green; Citrine+: dark green), and SFFV-GCase-P2A-Citrine targeted cells (Citrine–: light blue; Citrine+: dark blue) with and without macrophage differentiation. Left graph: CD11b+. Middle graph: CD14+. Right graph: CD11b+/CD14+ (n = 3 biologically independent human donor samples). e Representative FACS plots of Fluorescence Minus One controls (FMO’s) and Mock samples showing CD11b and CD14 expression in HSPC maintenance or Macrophage differentiation media. f Representative FACS plots showing CD11b and CD14 expression in CD68S-GCase-Citrine+ and SFFV-GCase-Citrine+ cells in HSPC maintenance or macrophage differentiation media. Data shown as mean ± SD. Source data are provided as a Source Data file.
Fig. 3
Fig. 3. CD68S promoter confines GCase expression to the monocyte/macrophage lineage.
a Representative flow plots showing Citrine+ and Citrine– populations at the time of sort (day 0, 48-h post-modification) and after 20 days in HSPC maintenance (HSPC) or macrophage differentiation (MΦ) cultures. b Citrine expression expressed as %Citrine+ cells over time in HSPC and MΦ cultures. HSPC Citrine+ (solid green line), HSPC Citrine– (solid purple line), MΦ Citrine+ (dotted green line), MΦ Citrine– (dotted purple line) (n = 3 biologically independent samples). c Representative Citrine expression expressed MFI over time in HSPC (gray) and MΦ (black) cultures in the CD68S-GCase-P2A-Citrine-targeted cells. d Fold GCase activity in HSPC and e MΦ cultures in targeted cells compared to unmodified (mock-treated) cells (n = 3 biologically independent samples). Comparisons between groups were performed using one-way ANOVA test and post-hoc comparisons were made with the Tukey’s multiple comparisons test. f Percent of targeted CCR5 alleles at the time of sort (dotted) and after 20 days in HSPC (white) and MΦ (gray) cultures (n = 3 biologically independent samples). Data shown as mean ± SD. Source data are provided as a Source Data file.
Fig. 4
Fig. 4. GCase-targeted HSPCs sustain long-term hematopoiesis.
a Total number of colonies formed from mock, Citrine+ and Citrine– SFFV and CD68S-driven constructs (n = 4 biologically independent human donor samples for Mock and SFFV and n = 2 for CD68S). b Distribution of phenotypes of colonies formed. Erythroid progenitors (burst-forming unit-erythroid or BFU-E (red)) and colony-forming unit-erythroid or CFU-E (blue), granulocyte-macrophage progenitors (CFU-GM, green), and multi-potential granulocyte, erythroid, macrophage, megakaryocyte progenitor cells (CFU-GEMM, purple) (n = 4 biologically independent human donor samples for Mock and SFFV and n = 2 for CD68S). c Primary human engraftment (16 weeks) in the bone marrow in transplants using CD68S-GCase-targeted and CD68S-GCase-P2A-Citrine-targeted cells (blue circles: 0.25E6, green: 1E6, and red: 2E6 cells transplanted; n = 31, 33 mice). d Primary human engraftment in the spleen. e Targeted allele frequency in CD68S-GCase- and CD68S-GCase-P2A-Citrine-targeted cells before transplantation (Pre-Tx) and 16-weeks post-transplantation (Post-Tx) in engrafted human cells in the bone marrow of mice with human chimerism >1% (n = 29, 31 mice). f Secondary human engraftment (32 weeks) in the bone marrow (n = 8, black: CD68S-GCase-P2A-Citrine, white: CD68S-GCase). Note, three mice have chimerism <1%. g Targeted allele frequency before (Pre-Tx) and after transplant (Post-Tx) in the bone marrow cells of secondary mice. ab Data shown as mean ± SD. cg Median shown. Source data are provided as a Source Data file.
Fig. 5
Fig. 5. In vivo monocyte/macrophage lineage differentiation of GCase-targeted HSPCs.
a Distribution of B-lymphoid and myeloid lineage cells within the engrafted human cell population in the bone marrow from mice transplanted with CD68S-GCase and CD68S-GCase-P2A-Citrine-targeted HSPCs (n = 29, 31 mice). b Distribution of B-lymphoid and lineage cells within the engrafted human cell population from secondary transplants. Empty: vector without Citrine (n = 5 mice). c Representative FACS plots showing Citrine expression in human CD33+ (Myeloid), CD14+ (Monocyte) and CD19 (B-cells). d Percent Citrine-positive cells in monocyte (black), myeloid (white), and B-cell (gray) populations in mice with human CCR5 allele modification fraction >10%. e Representative epifluorescence microscopy images of human CD68S-GCase-P2A-Citrine-targeted macrophages differentiated from human CD14+ cells sorted from mice bone marrow and peripheral blood (n = 10 mice, additional examples in Supplementary Fig. 8). Images depict morphology (brightfield), nuclei (Hoechst, blue), CD68 protein (red), and Citrine (green). Scale bar is 10 µm. a, b, d Median shown. Source data are provided as a Source Data file.
Fig. 6
Fig. 6. Improved macrophage differentiation of GCase-targeted HSPCs in NSG-SGM3 mice.
a Human cell engraftment 16-weeks post-transplantation in the bone marrow (BM), spleen (SP), and peripheral blood (PB) in transplants using CD68S-GCase-P2A-Citrine-targeted cells (n = 5 mice). b Modified allele frequency from engrafted CD68S-GCase-P2A-Citrine-targeted cells in the same tissues (n = 5 mice). c Percent human B-cell (CD19+), myeloid (CD33+), and monocyte (CD14+) populations in BM, SP, and PB shown in white. Citrine-positive cells in each population are shown in green (n = 5 mice). d Representative FACS plots showing gating strategy for mouse and human CD45+, CD45+/CD11b+, and CD45+/CD11b+/Citrine populations in macrophage preparations from lung, peritoneum, and liver. e Percent human CD45+ and human CD45+/Citrine cells in the same preparations (n = 5 mice). f Percent human CD45+/CD11b+ and human CD45+/CD11b+/Citrine cells in the same preparations (n = 5 mice). g Fold GCase activity in human Citrine+ cells compared to human Citrine cells in BM, SP, and lung (n = 3 mice). h Modified allele frequency in human Citrine+ cells (green) compared to human Citrine cells (white) in BM, SP, and lung in the same cells. a, b Median shown. c, eg Data shown as mean ± SD. Source data are provided as a Source Data file.

References

    1. Stirnemann, J. et al. A review of gaucher disease pathophysiology, clinical presentation and treatments. Int. J. Mol. Sci.18, 441 (2017). - PMC - PubMed
    1. Pastores, G. M. & Hughes, D. A. in GeneReviews((R)). (eds Adam, M. P. et al.) (University of Washington, Seattle University of Washington, Seattle, 1993). GeneReviews is a registered trademark of the University of Washington, Seattle. All rights reserved., Seattle (WA)).
    1. Charrow J, et al. The Gaucher registry: demographics and disease characteristics of 1698 patients with Gaucher disease. Arch. Intern. Med. 2000;160:2835–2843. - PubMed
    1. Sidransky E, et al. Multicenter analysis of glucocerebrosidase mutations in Parkinson’s disease. N. Engl. J. Med. 2009;361:1651–1661. - PMC - PubMed
    1. Ferraz MJ, et al. Gaucher disease and Fabry disease: new markers and insights in pathophysiology for two distinct glycosphingolipidoses. Biochim. Biophys. Acta. 2014;1841:811–825. - PubMed

Publication types

MeSH terms

Substances