

doi: 10.1038/s41598-020-67745-5.
Development of fluorescence oligonucleotide probes based on cytosine- and guanine-rich sequences
Affiliations
- PMID: 32620895
- PMCID: PMC7335195
- DOI: 10.1038/s41598-020-67745-5
Item in Clipboard
Development of fluorescence oligonucleotide probes based on cytosine- and guanine-rich sequences
Sci Rep.
.
Abstract
The properties of cytosine- and guanine-rich oligonucleotides contributed to employing them as sensing elements in various biosensors. In this paper, we report our current development of fluorescence oligonucleotide probes based on i-motif or G-quadruplex forming oligonucleotides for cellular measurements or bioimaging applications. Additionally, we also focus on the spectral properties of the new fluorescent silver nanoclusters based system (ChONC12-AgNCs) that is able to anchor at the Langmuir monolayer interface, which is mimicking the surface of living cells membrane.
Conflict of interest statement
The authors declare no competing interests.
Figures

The spectra of tC-MB-520 probe (1 μM) prefolded in different pH buffers: (A) CD spectra with insert showing the dependence of CD signals at 286 nm against the pH values; (B) UV–Vis absorption spectra with insert showing absorption changes in UV region.

The maximum fluorescence intensity of molecular beacons in different pH solutions: (A) tC-MB-520 probe (0.25 μM); (B) MB-520 reference probe (0.25 μM).

Confocal microscopy images of HeLa cells transfected with 50 nM tC-MB-520 using Lipofectamine 2000: (A) Atto520 fluorescence, marked red; (B) tC/Atto520 fluorescence, marked blue (C) bright field image (D) overlay of all images. Fluorescence emission filters: (1) for red color, 520–640 nm; excitation wavelength: 514 nm; (2) for blue color, 520–640 nm; excitation wavelength: 405 nm. Scale bars: 20 μm.

Confocal microscopy images of HeLa cells treated with 50 nM Ch(F-TBA-T) for 3.5 h (A): (a) FAM fluorescence, marked green; (b) FRET image, marked red; (c) TAMRA image, marked red; (d) overlay of all images. Fluorescence emission filters: (1) for FAM, 510–540 nm; excitation wavelength: 480 nm; (2) for FRET, 595–630 nm; excitation wavelength: 480 nm; (3) for TAMRA, 595–630 nm; excitation wavelength: 560 nm. Scale bars: 50 μm. (B) Scheme of using the FRET process to generate a fluorescent signal by the Ch(F-TBA-T) probe; (C) fluorescence intensity ratio (F583/F520) for Ch(F-TBA-T) (C) plotted against K+ concentration in the presence 150 mM Na+ at 25.0 °C (circles) and 36.6 °C (triangles).

Absorption spectra (A) and CD spectra (B) of the ChONC12-AgNCs. The solutions contained 2 µM ChONC12, Tris–CH3COOH buffer (10 mM, pH = 7.5), [Ag+] = [BH4] = 24 µM.

Upper panel: Excitation and emission spectra of ChONC12Ag-NCs (A) and the effect of time on the emission stability of ChONC12-AgNCs for 1 h to 21 days after the reduction of silver (B). Conditions: 2 µM DNA, Tris–CH3COOH buffer solution (10 mM, pH 7.5), [Ag+] = [BH4−] = 24 µM; λex = 475 nm/λem = 560 nm, λex = 560 nm/λem = 610 nm. Lower panel: Absorbance (C) and emission (D) spectra of ChONC12-AgNCs nanoclusters obtained at different molar ratio C/Ag+. Conditions: 2 μM DNA, 10 mM Tris-CH3COOH (pH = 7.5), λex = 475 nm and λex = 560 nm.
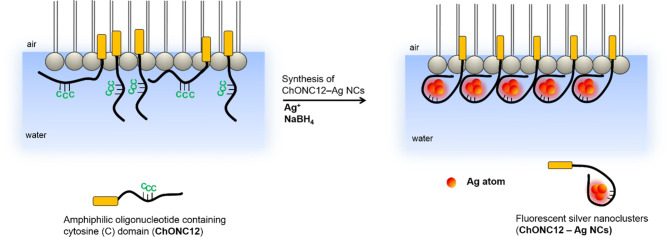
Scheme showing the synthesis of ChONC12-AgNCs incorporated into the Langmuir monolayer.

The π-A isotherms recorded for ChONC12 (black line), DODAB monolayer (red line) and ChONC12-AgNCs/DODAB complex (green line). Conditions: 50 µl (1 × 10⁻⁴ M) ChONC12, 5 µl DODAB (1 × 10⁻³ M), [Ag+] = 6 µl (1 × 10⁻² M), [BH4-] = 120 µl (1 × 10⁻² M); subphase contained 10 mM buffer Tris–CH3COOH (pH = 7.5).

Excitation and emission spectra of ChONC12-AgNCs/DODAB system recorded at the air/water interface. Conditions: 50 µl (1 × 10⁻⁴ M) ChONC12, 5 µl DODAB (1 × 10⁻³ M), [Ag+] = 6 µl (1 × 10⁻² M), [BH4−] = 120 µl (1 × 10⁻² M); subphase contained 10 mM buffer Tris-CH3COOH (pH = 7.5), λex = 475 nm/λem = 560 nm, λex = 560 nm/λem = 620 nm.
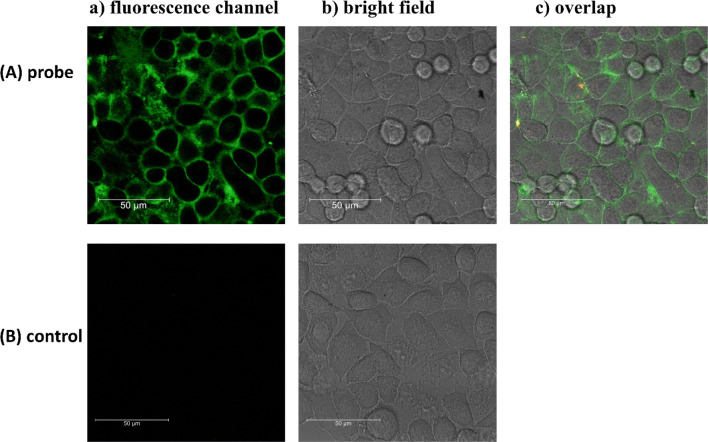
Confocal fluorescence imaging of HeLa cells loaded with 1 μM ChONC12-AgNCs for 2 h (A) or control HeLa cells treated with AgNO3 for 30 min (B). Fluorescence emission filter: 510–550 nm; excitation wavelength: 500 nm. Scale bars: 50 μm.

Schematic diagram of the preparation of DNA-Ag NCs.
References
-
- Sen D, Gilbert W. Formation of parallel four-stranded complexes by guanine-rich motifs in DNA and its applications for meiosi. Nature. 1998;334:364–366. - PubMed
-
- Sundquist WI, Klug A. Telomeric DNA dimerizes by formation of guanine tetrads between hairpin loops. Nature. 1989;342:825–829. - PubMed
-
- Gehring K, Leroy J-L, Guéron M. A tetrameric DNA structure with protonated cytosine-cytosine base pairs. Nature. 1993;363:561–565. - PubMed
Publication types
MeSH terms
Substances
LinkOut - more resources
Full Text Sources
Other Literature Sources
