. 2020 Jul 3;3(1):341.
doi: 10.1038/s42003-020-1067-1.

Geometric regulation of histone state directs melanoma reprogramming

Affiliations

Geometric regulation of histone state directs melanoma reprogramming

Junmin Lee et al. Commun Biol. .

Abstract

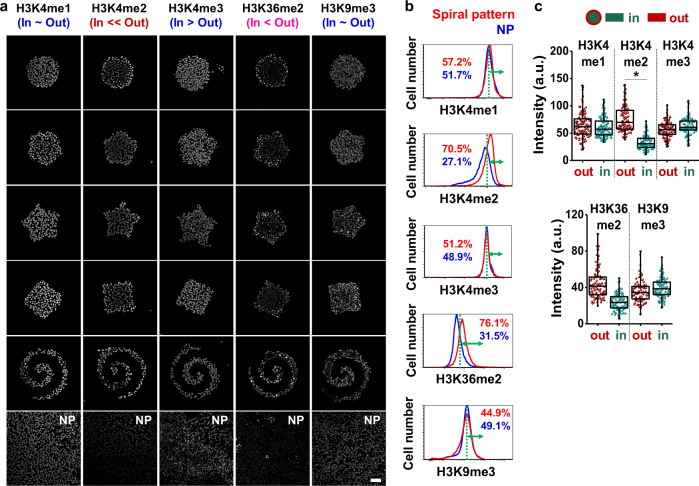
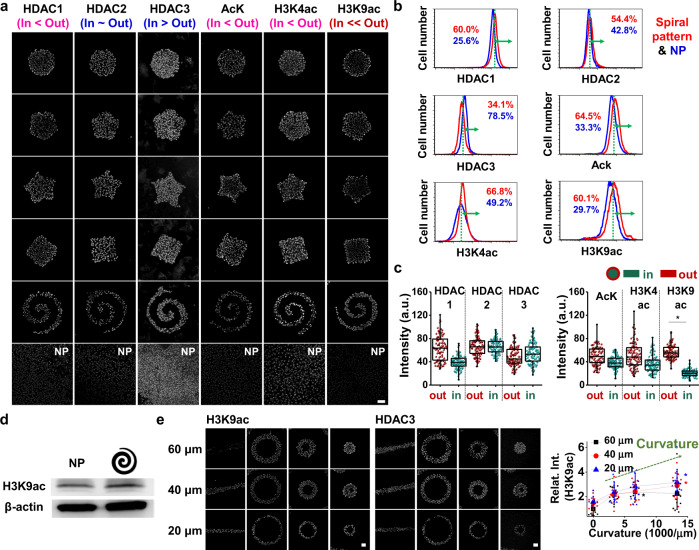
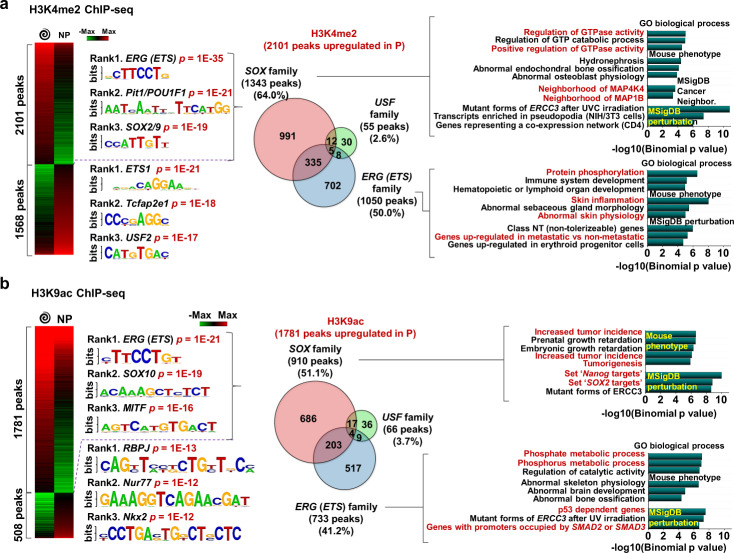
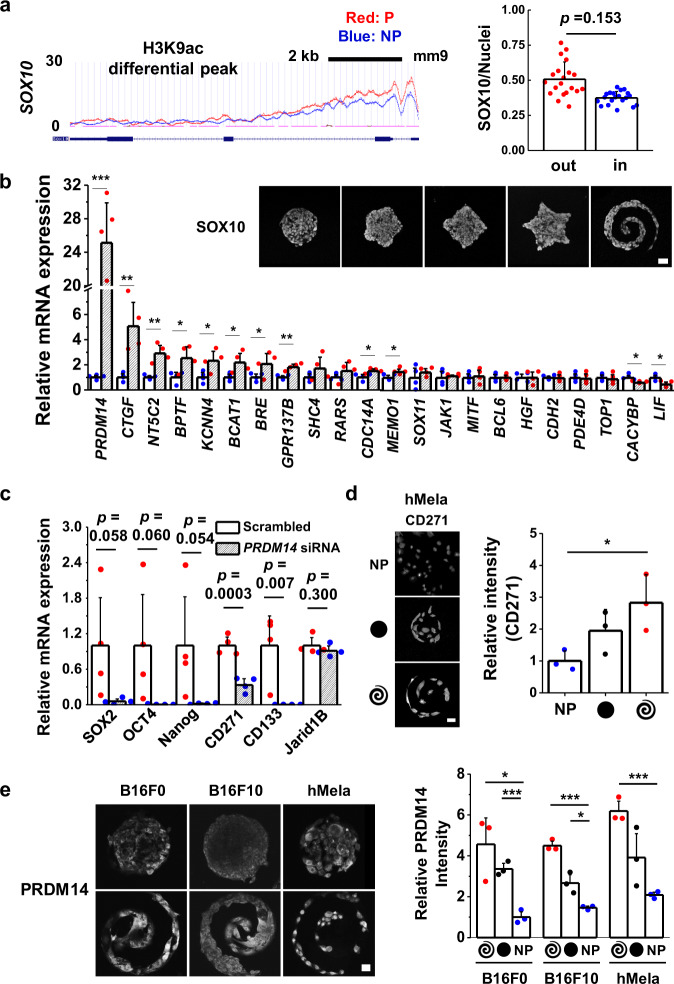
Malignant melanoma displays a high degree of cellular plasticity during disease progression. Signals in the tumor microenvironment are believed to influence melanoma plasticity through changes in the epigenetic state to guide dynamic differentiation and de-differentiation. Here we uncover a relationship between geometric features at perimeter regions of melanoma aggregates, and reprogramming to a stem cell-like state through histone marks H3K4Me2 and H3K9Ac. Using an in vitro tumor microengineering approach, we find spatial enrichment of these histone modifications with concurrent expression of stemness markers. The epigenetic modifier PRDM14 overlaps with H3K9Ac and shows elevated expression in cells along regions of perimeter curvature. siRNA knockdown of PRDM14 abolishes the MIC phenotype suggesting a role in regulating melanoma heterogeneity. Our results suggest mechanotransduction at the periphery of melanoma aggregates may orchestrate the activity of epigenetic modifiers to regulate histone state, cellular plasticity, and tumorigenicity.


Conflict of interest statement

The authors declare no competing interests.

Figures

Fig. 1
Fig. 1. Histone methylation state is influenced by perimeter curvature.
a Representative immunofluorescence images of H3K4me1/2/3, H3K36me2, and H3K9me3 for B16F0 cells cultured in a panel of shapes. b Flow cytometry characterization of histone methylation in B16F0 cells and quantification of the difference between patterned and non-patterned cells for each condition with thresholds (green dots) assigned by overlapping regions of patterned and non-patterned plots. c Single cell analysis of histone methylation in B16F0 cells cultured in perimeter or central regions of the circular geometry (n = 3, biological replicates, total 100 cells for each marker). Boxes represent 25th to 75th percentile and whiskers represent minimum-maximum. Horizontal lines and points within boxes represent the median and mean respectively for three duplicates. Scale bars, 50 μm. *P < 0.05, ANOVA. Error bars represent s.d.
Fig. 2
Fig. 2. Histone acetylation and deacetylation correspond to epigenetic-mediated phenotype changes in melanoma.
a Representative immunofluorescence images of histone acetylation and deacetylation for B16F0 cells cultured on a panel of shapes. b Flow cytometry characterization of histone acetylation and deacetylation in B16F0 cells and quantification of the difference between patterned and non-patterned cells for each condition with thresholds (green dots) assigned by overlapping regions of patterned and non-patterned plots. c Single cell analysis of histone acetylation and deacetylation in B16F0 cells cultured in two different regions of the circular shape (n = 3, biological replicates, total 100 cells for each marker). Boxes represent 25th to 75th percentile and whiskers represent minimum-maximum. Horizontal lines and points within boxes represent the median and mean respectively for three duplicates. d Western blots for H3K9ac with non-patterned or spiral-patterned melanoma cells. e Shapes regulating curvature and perimeter/area to explore the relationship between H3K9ac and HDAC3 (n = 3, biological replicates, total 12 patterns for each condition, except for 20 μm-width line shape: 7 patterns and 40 μm-width medium torus shape: 9 patterns). Significant differences were compared to those cultured on 60 μm line shapes. Scale bars, 50 μm. *P < 0.05, ANOVA. Error bars represent s.d.
Fig. 3
Fig. 3. H3K4me2/H3K9ac-regulated gene panels predict phenotypic alterations of melanoma.
Heatmap of a H3K4me2 and b H3K9ac ChiP-seq results for cells cultured on spiral geometry or non-patterned substrates. The top three high ranked regulatory motifs cut by p-values. Venn diagram showing the number of enriched genes for cells cultured on spiral patterns linked to SOX, ETS, and USF families among H3K4me2-marked genes.
Fig. 4
Fig. 4. SOX10 and PRDM14 are involved in regulating the epigenetic state associated with the MIC phenotype.
a ChiP-seq occupancy for H3K9ac over SOX10, intensity ratio of SOX10 normalized by the fluorescent signal to the intensity of DAPI (n = 3, biological replicates, total 20 patterns for each condition), and representative immunofluorescence confocal images of SOX10 for B16F0 cells cultured in a panel of shapes. b Results of qPCR to measure the expression of genes associated with the differential peaks of H3K9ac/SOX10 motif. (n = 4, biological replicates) c Results of qPCR to measure the gene expression of stemness (SOX2, OCT4, Nanog) and MIC (CD271, CD133, Jarid1B) for B16F0 cells cultured on spiral geometries for 5 days with PRDM14 or scrambled siRNAs (n = 4, biological replicates). d Representative immunofluorescence images and relative intensity of representative MIC marker, CD271 for hMela cells cultured for five days on circular or spiral geometries or non-patterned substrates. (n = 3, biological replicates, total 12 patterns for each condition). e Representative immunofluorescence confocal image and relative intensity of PRDM14 expression for B16F0, B16F10, and hMela cells cultured for five days on circular or spiral geometries or non-patterned substrates. (n = 3, biological replicates, total 12 patterns for each condition). Scale bars, 50 μm. *P < 0.05, **P < 0.005, ***P < 0.0005, ANOVA. Error bars represent s.d.

References

    1. Nowell PC. The clonal evolution of tumor cell populations. Science. 1976;194:23–28. doi: 10.1126/science.959840. - DOI - PubMed
    1. Esteller M. Cancer epigenetics: DNA methylation and chromatin alterations in human cancer. Adv. Exp. Med. Biol. 2003;532:39–49. doi: 10.1007/978-1-4615-0081-0_5. - DOI - PubMed
    1. Goldberg AD, Allis CD, Bernstein E. Epigenetics: a landscape takes shape. Cell. 2007;128:635–638. doi: 10.1016/j.cell.2007.02.006. - DOI - PubMed
    1. Feinberg AP, Tycko B. The history of cancer epigenetics. Nat. Rev. Cancer. 2004;4:143–153. doi: 10.1038/nrc1279. - DOI - PubMed
    1. Core LJ, Waterfall JJ, Lis JT. Nascent RNA sequencing reveals widespread pausing and divergent initiation at human promoters. Science. 2008;322:1845–1848. doi: 10.1126/science.1162228. - DOI - PMC - PubMed

Publication types