. 2020 Jul 3;10(1):10974.
doi: 10.1038/s41598-020-67481-w.

Nanoscale trace metal imprinting of biocalcification of planktic foraminifers by Toba's super-eruption

Affiliations

Nanoscale trace metal imprinting of biocalcification of planktic foraminifers by Toba's super-eruption

L Lemelle et al. Sci Rep. .

Abstract

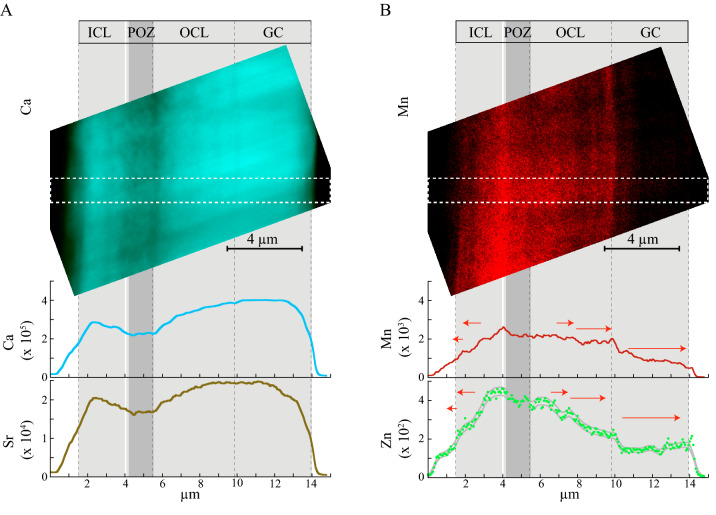
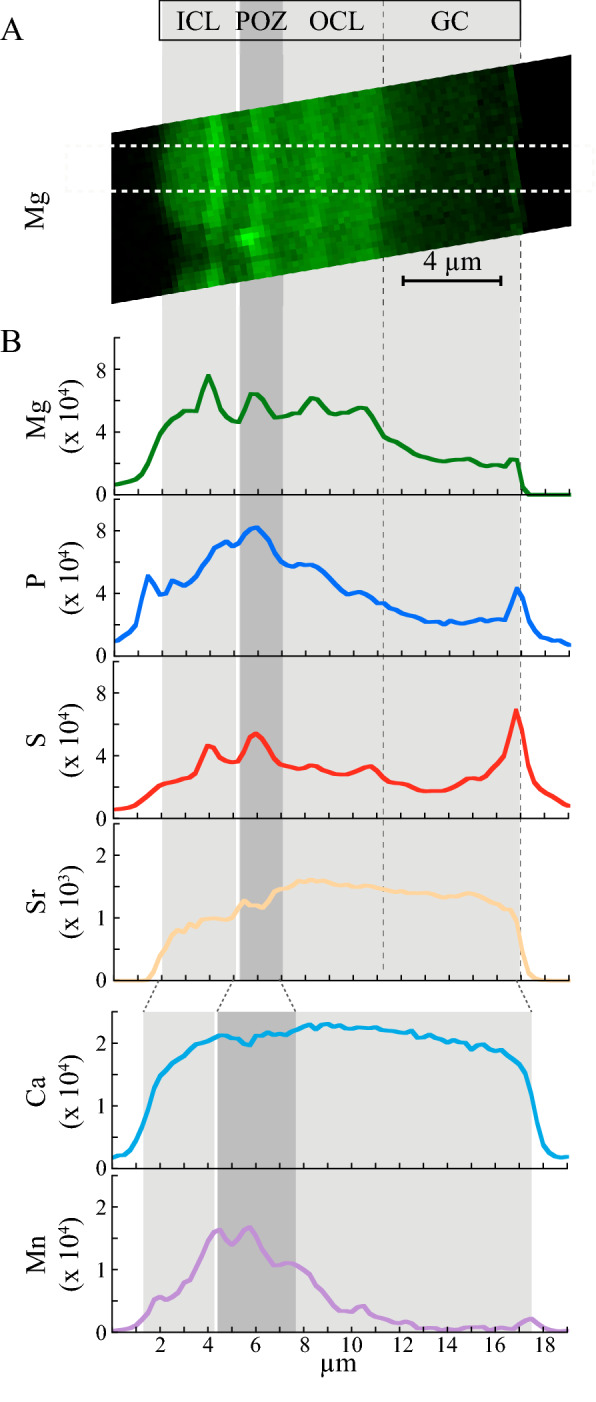
Bioactive metal releases in ocean surface water, such as those by ash falls during volcanic super-eruptions, might have a potentially toxic impact on biocalcifier planktic microorganisms. Nano-XRF imaging with the cutting-edge synchrotron hard X-ray nano-analysis ID16B beamline (ESRF) revealed for the first time a specific Zn- and Mn-rich banding pattern in the test walls of Globorotalia menardii planktic foraminifers extracted from the Young Toba Tuff layer, and thus contemporaneous with Toba's super-eruption, 74,000 years ago. The intra-test correlation of Zn and Mn patterns at the nanoscale with the layered calcareous microarchitecture, indicates that the incorporation of these metals is syngenetic to the wall growth. The preferential Mn and Zn sequestration within the incipient stages of chamber formation suggests a selective incorporation mechanism providing a resilience strategy to metal pollution in the test building of planktic foraminifers.


Conflict of interest statement

The authors declare no competing interests.

Figures

Figure 1
Figure 1
Mn from the last chamber of Globorotalia menardii. (A) Average XRF spectrum compiled from a µ-XRF map recorded at 7.3 keV (dwell-time is 5 s, scan step size is 250 nm) on a FIB cut of the last chamber wall of a Globorotalia menardii extracted from the YTT level of the specimen TYTT1 (BAR94-25 core, 307 cm depth). (B) Same measurement on a test of Globorotalia menardii sampled live in the Indian Ocean water column of the specimen TIND (Gyrafor-B, St.C, T3N4-2F). The main Kα lines of the samples are reported and the Mn Kα line is in the red zone. The Mn Kα raw counts were compiled using PyMCA indicating Mn contents in YTT specimen wall chamber 5 to 10 times higher than in the living water column specimen wall chamber. Note that Fe Kα shows close counts in A and B.
Figure 2
Figure 2
Wall structure of the last chamber of Globorotalia menardii. (A) Secondary Electron Scanning Electron Micrograph (SE-SEM) of the G. menardii TYTT5 specimen coming from the YTT level (BAR94-25 core, 318 cm depth). The white rectangle corresponds to the zone where the fragment TYTT5 (Fig. 2C) was collected. (B) Classical diagram of planktic foraminifer test construction via the sequential addition chambers: with the formation of every newly secreted chamber, the whole of the pre-existing test is covered by a new OCL. The black lines represent the organic linings, the red line the POS zone (Primary Organic Sheet, starting point of the shell construction), the dark-gray layer the Inner Calcitic Layer (ICL), the light-gray layers the Outer Calcitic Layers (OCLs), the light-blue layer the Gametogenic Crust (GC). (C) SE-SEM image of the fragment TYTT5 coming from the last chamber (n) of the G. menardii specimen illustrated in Fig. 2A and showing the ICL-POZ-OCL-GC growing structure of the wall described elsewhere in the text. The red line indicates the Primary Organic Sheet (POS) sensu stricto. The Primary Organic Zone (POZ) corresponds to the Ca-poor precursor layer (Fig. 3A) and it is adjacent to the thin POS (see text for more details). The GC has a distinct crystal structure with large elongated euhedral crystals, while the ICL and OCL consist of much smaller submicron crystallites.
Figure 3
Figure 3
Mn-Zn distributions imprinted on the calcitic structure of the wall as seen by nano-XRF. (A) High spatial resolution map of the Ca Kα lines recorded at 17.4 keV on ID 16B ESRF (dwell-time is 3 s, pixel size is 60 nm) and the Ca and Sr profiles measured on the G. menardii last chamber TYTT5 fragment parallel to the axis of the ICL-POZ-OCL-GC wall growth structure (see corresponding SE-SEM image in Fig. 2C). Profiles have been averaged along a 21 pixel-wide rectangle (displayed by a white dashed line box). Data is reported in counts of fluorescence. The ICL-POZ-OCL-GC wall growth structure is indicated as gray boxes and displays a Ca-poor POZ, a Ca-rich GC and nano-bands in the ICL and OCL. Error bars are in the line widths, or comprised between gray lines. (B) Same representation for the Mn and Zn Kα lines displaying the map of Mn, and the Mn and Zn profiles highlighting the Mn-Zn rich POZ, the Mn-Zn poor GC and nano-bands in the ICL and OCL. Error bars are in the line widths. The red arrows indicate the bipolar growth direction of ICL, OCL and GC.
Figure 4
Figure 4
Zn, Mn and Ca correlations in the wall. Same data as in Fig. 3. (A) Relative variation of the Ca Kα plotted versus Mn Kα line fluorescence data showing from right to left the Ca-poor and Mn-rich POZ (in red), the continuous depletion trajectories in Mn of ICL and OCL parallel to the direction of growth (in gray) and the Ca-richest and Mn-poorest GC (in blue). The gray arrows indicate the growth direction of ICL and OCL. (B) The ratio of the Kα line fluorescence counts of Mn over Ca and its second derivative along the profile of Fig. 3. The relative Mn/Ca error bar of ca. 2% is in the line width. The values at ± σSX/SY from zero (Eq. 4 in “Materials and methods”) are reported (horizontal dashed lines). Bands are detected events if contiguous fluctuations fall, away from these threshold values. The alternated white and gray bars between two zero values of the second derivative of the Mn/Ca ratio display a banded pattern, whose bands contain alternating positive and negative extrema, and thus minimal and maximal Mn/Ca ratio values. The color-coded image displays the Mn nano-banding (in red) in opposite phase to the Ca nano-banding (in turquoise) (Fig. S2). (C) Zn Kα plotted versus Mn Kα line fluorescence data, both normalized to the Ca Kα line fluorescence data showing a strong positive correlation and its linear fit (the Pearson correlation coefficient ρ = 0.975 and Zn/Ca ≈ 0.19 Mn/Ca).
Figure 5
Figure 5
Mg-S-P-Mn distributions imprinted on the calcitic structure of the wall seen by micro-XRF. (A) High spatial resolution maps of the Mg Kα lines recorded at 2.55 keV on ID 21 ESRF (dwell-time is 10 s, step size is 250 nm, beamsize 300 × 300 nm2) and (B) the corresponding Mg, S, P and Sr profiles measured on a FIB section, cut perpendicularly to the surface of the last chamber of a G. menardii from the YTT level, TYTT1 (BAR94-25 core, 307 cm depth), see SE-SEM image in Fig. S5B. Spectra were averaged along a 10 pixel-wide rectangle. Data is reported in counts of fluorescence. The Ca and Mn profiles measured at 7.3 keV on the same sample and set-up were averaged along a 7 pixel-wide rectangle. The ICL-POZ-OCL-GC structure is indicated as gray boxes and displays a Ca-poor POZ, corresponding to the zone well visible in the TYTT1 FIB lamella SE-SEM image (Fig. S5B). Structures are enlarged and blurred at 7.3 keV due to the larger beamsize (1.2 µm). Error bars are in the line widths.

Similar articles

References

    1. Schiebel R. Planktic foraminiferal sedimentation and the marine calcite budget. Glob. Biogeochem. Cycl. 2002;16(4):1065.
    1. Schiebel R, Hemleben C. Planktic foraminifers in the modern ocean. Berlin: Springer; 2017. p. 358.
    1. Allen KA, et al. Trace element proxies for surface ocean conditions: a synthesis of culture calibrations with planktic foraminifera. Geochim. Cosmochim. Acta. 2016;193:197–221.
    1. de Nooijer LJ, Spero HJ, Erez J, Bijma J, Reichart GJ. Biomineralization in perforate foraminifera. Earth Sci. Rev. 2014;135:1–11.
    1. Eggins S, de Deckker P, Marshall J. Mg/Ca variation in planktonic foraminifera tests: Implications for reconstructing palaeo-seawater temperature and habitat migration. Earth Planet. Sci. Lett. 2003;212:291–306.

Publication types

MeSH terms