

Data-derived metrics describing the behaviour of field-based citizen scientists provide insights for project design and modelling bias
- PMID: 32620931
- PMCID: PMC7334204
- DOI: 10.1038/s41598-020-67658-3
Data-derived metrics describing the behaviour of field-based citizen scientists provide insights for project design and modelling bias
Abstract
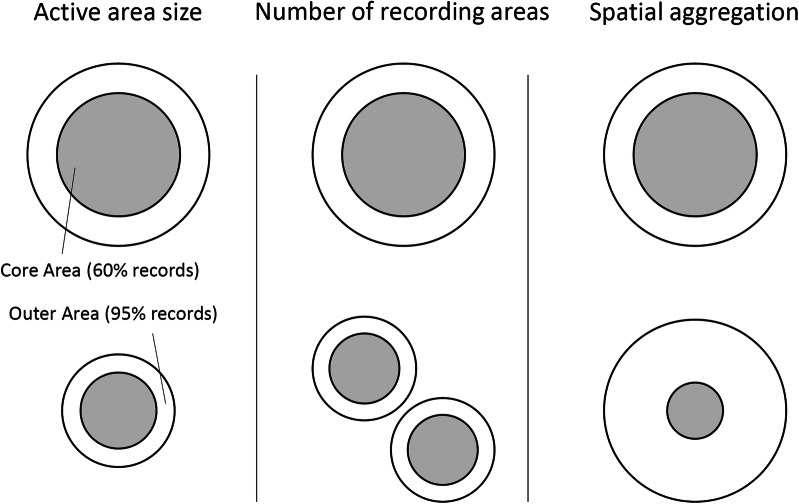
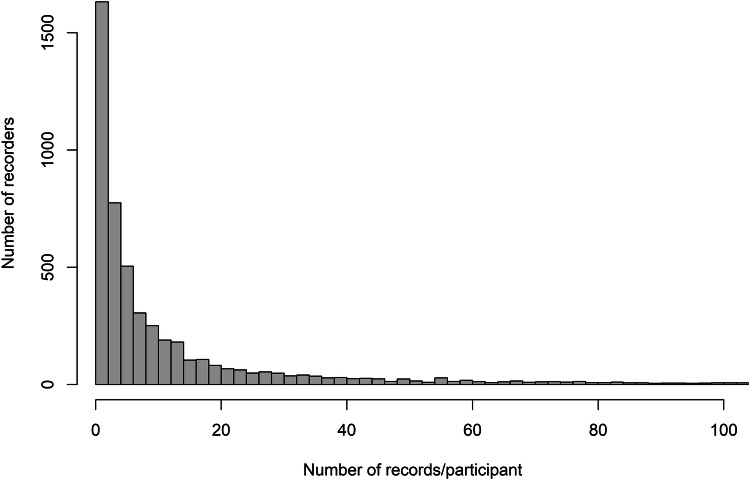
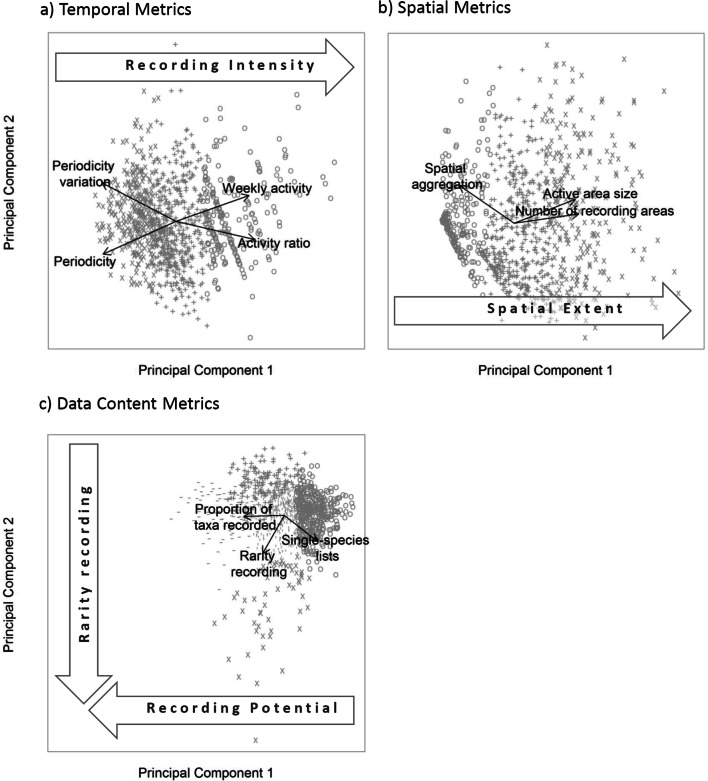
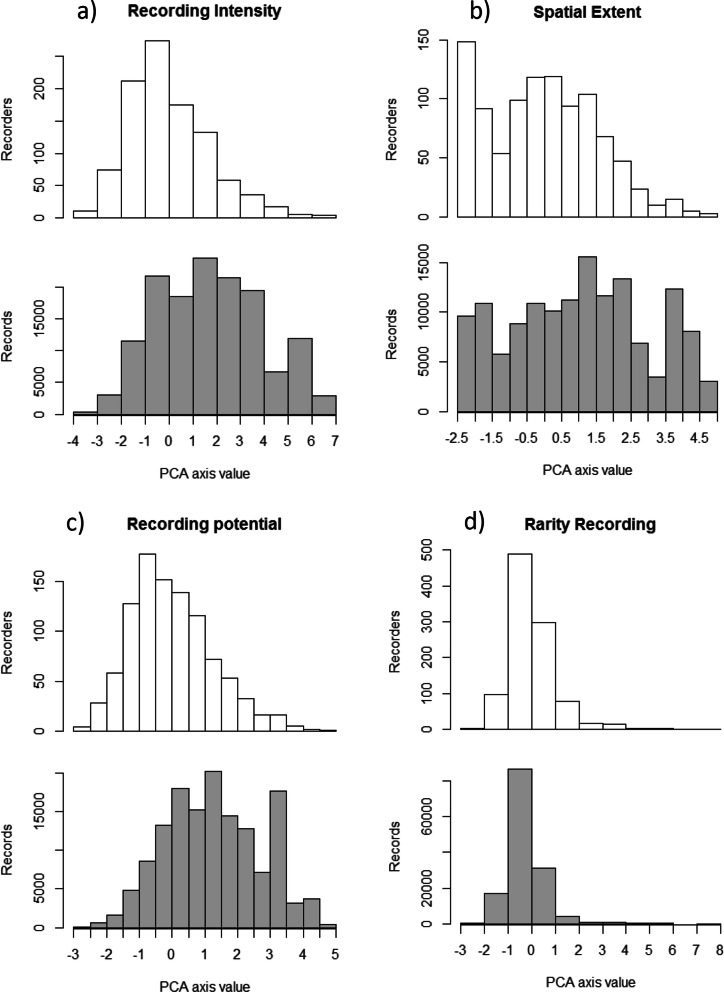
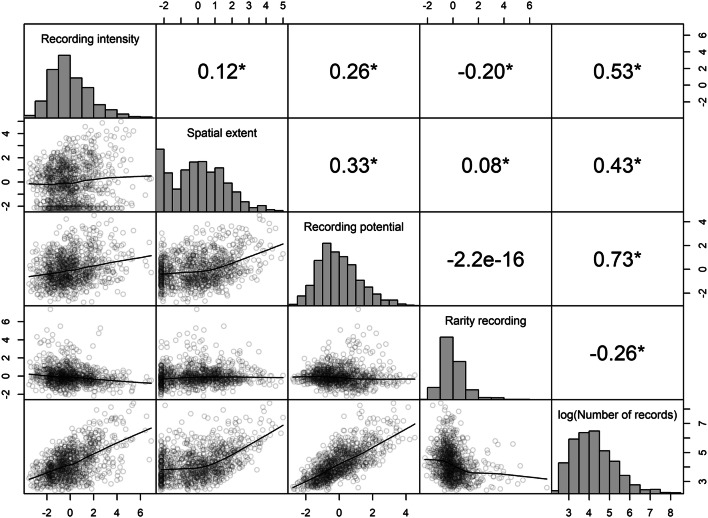
Around the world volunteers and non-professionals collect data as part of environmental citizen science projects, collecting wildlife observations, measures of water quality and much more. However, where projects allow flexibility in how, where, and when data are collected there will be variation in the behaviour of participants which results in biases in the datasets collected. We develop a method to quantify this behavioural variation, describing the key drivers and providing a tool to account for biases in models that use these data. We used a suite of metrics to describe the temporal and spatial behaviour of participants, as well as variation in the data they collected. These were applied to 5,268 users of the iRecord Butterflies mobile phone app, a multi-species environmental citizen science project. In contrast to previous studies, after removing transient participants (those active on few days and who contribute few records), we do not find evidence of clustering of participants; instead, participants fall along four continuous axes that describe variation in participants' behaviour: recording intensity, spatial extent, recording potential and rarity recording. Our results support a move away from labelling participants as belonging to one behavioural group or another in favour of placing them along axes of participant behaviour that better represent the continuous variation between individuals. Understanding participant behaviour could support better use of the data, by accounting for biases in the data collection process.
Conflict of interest statement
The authors declare no competing interests.
Figures
References
-
- Dirzo R, et al. Defaunation in the Anthropocene. Science. 2014;345:401–406. - PubMed
-
- Newbold T, et al. Global effects of land use on local terrestrial biodiversity. Nature. 2015;520:45. - PubMed
-
- Seebens H, Gastner MT, Blasius B. The risk of marine bioinvasion caused by global shipping. Ecol. Lett. 2013;16:782–790. - PubMed
-
- Hooper DU, Chapin FS, III, Ewel JJ. Effects of biodiversity on ecosystem functioning: a consensus of current knowledge. Ecol. Monogr. 2005;75:3–35.
-
- Ehrenfeld JG. Ecosystem consequences of biological invasions. Annu. Rev. Ecol. Evol. Syst. 2010;41:59–80.
Publication types
MeSH terms
LinkOut - more resources
Full Text Sources
