

Variation in groundwater manganese in Finland
- PMID: 32621276
- PMCID: PMC7969565
- DOI: 10.1007/s10653-020-00643-x
Variation in groundwater manganese in Finland
Abstract
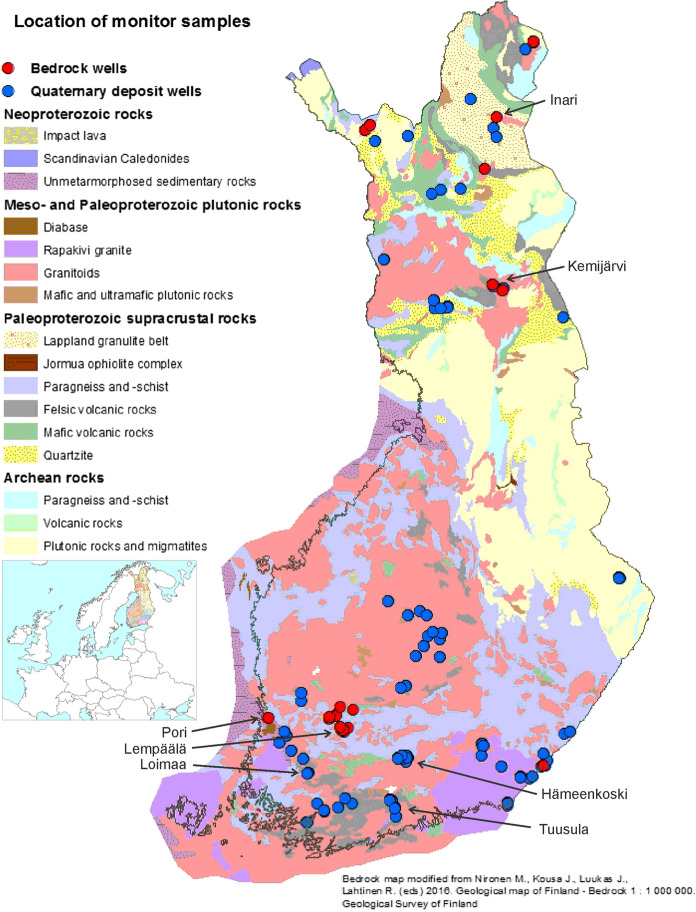
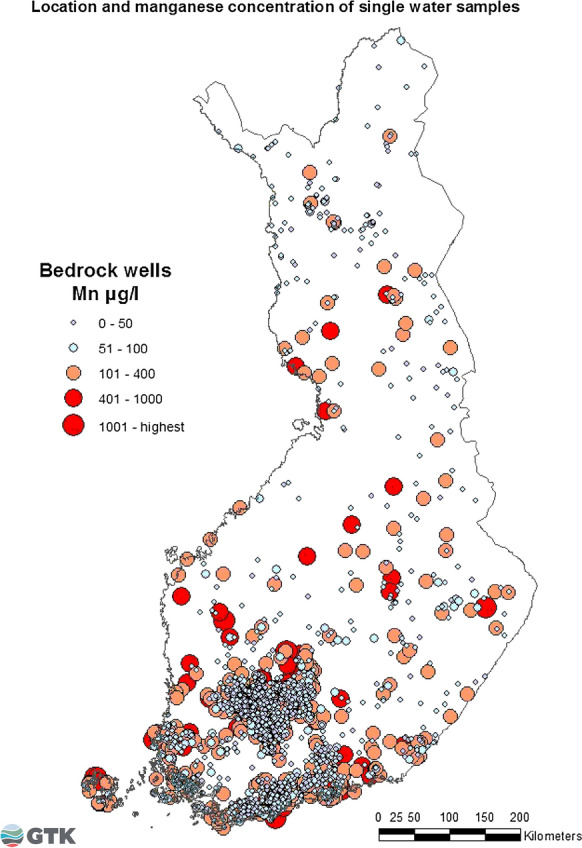
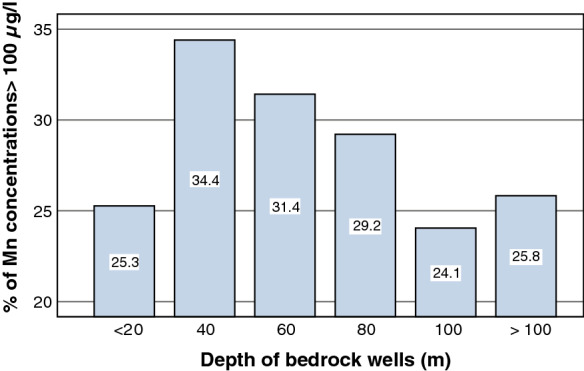
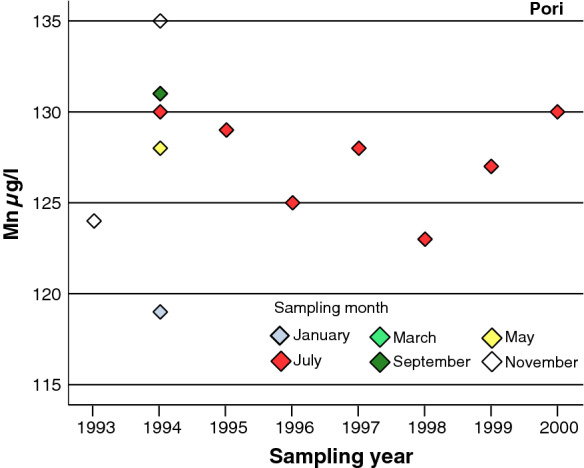
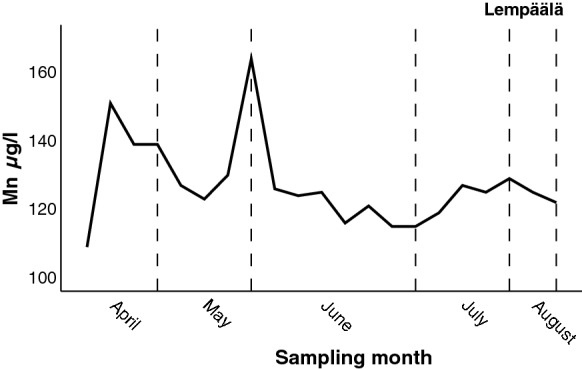
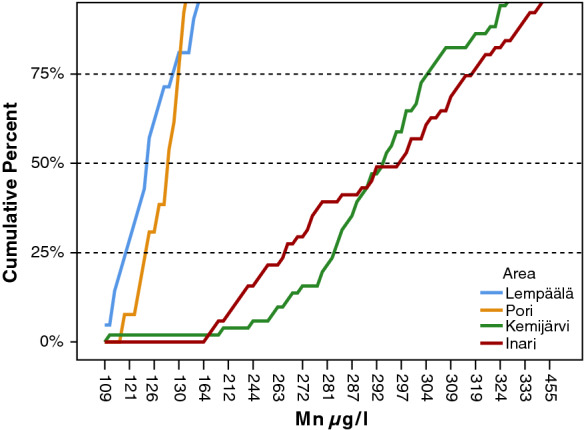
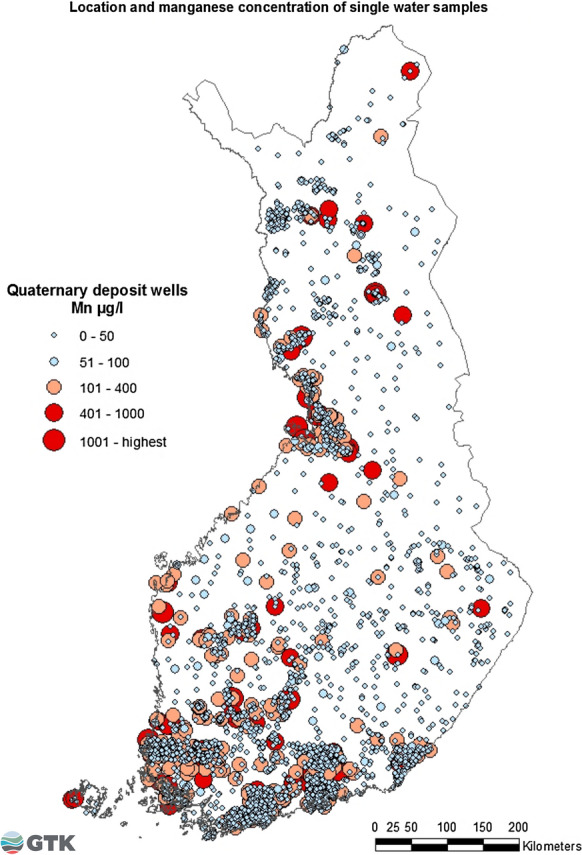
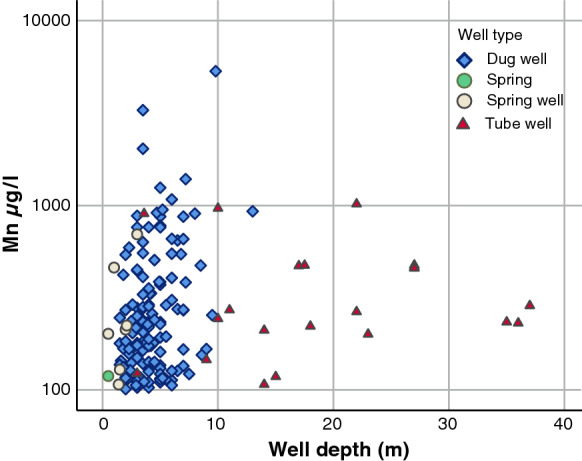
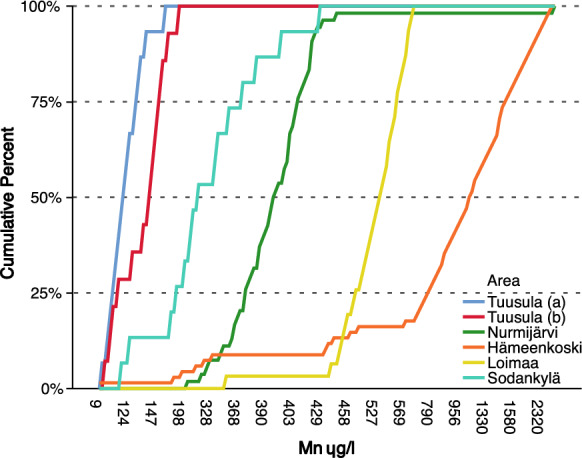
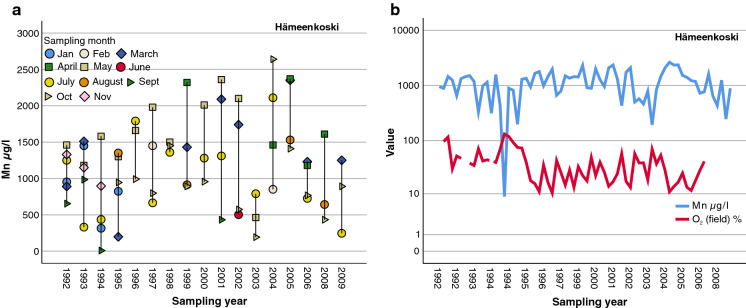
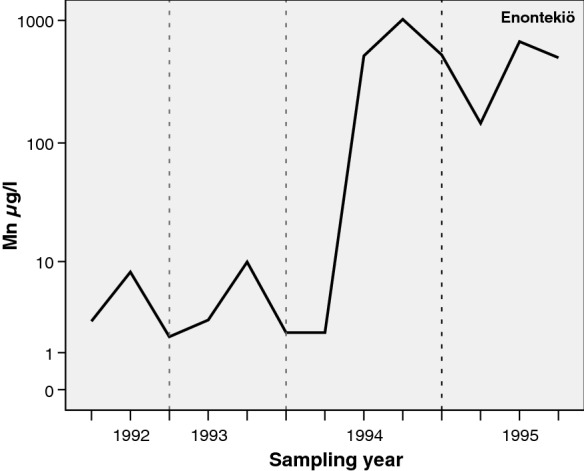
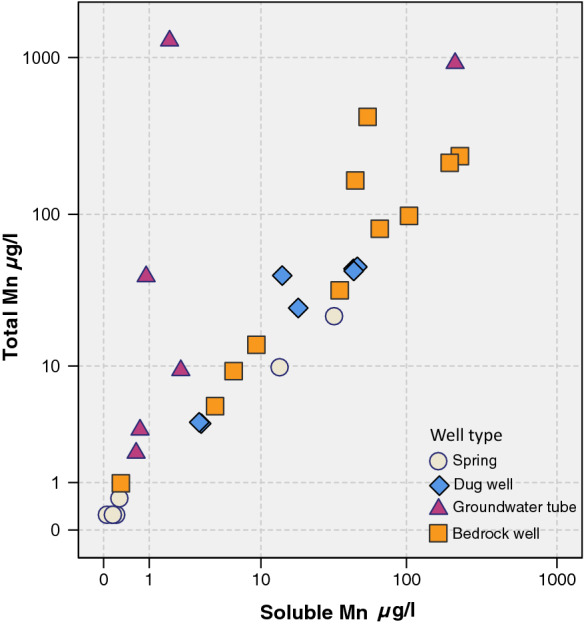
Increasing evidence has emerged that Mn derived from drinking water could be a health risk, especially for children. This study aimed to provide more information on the variation in Mn concentrations in well water and factors that affect manganese concentrations in groundwater in the natural environment. The geochemical data consisted of analyses of single water samples (n = 5311) that were taken only once and data from monitoring sites where water samples (n = 4607) were repeatedly taken and analyzed annually from the same wells. In addition, the well-specific results from six wells at monitoring sites were described in detail. We obtained the data on water samples from the groundwater database of Geological Survey of Finland. In single samples, Mn concentrations varied from < 0.02 µg/l to 5800 µg/l in bedrock well waters and up to 6560 µg/l in Quaternary deposit well waters. Results from single water samples from bedrock wells and Quaternary deposit wells indicated that the dissolved oxygen content has an inverse association with the Mn concentration. When the dissolved oxygen O2 levels were lower, the Mn concentrations were higher. No clear association was found between the Mn concentration and the pH or depth of the well for single samples. Part of Mn was particle bound, because total Mn was higher than soluble Mn in most measured samples. In the monitoring survey, large variation in Mn concentrations was found in bedrock well water in Kemijärvi, 114-352 µg/l, and in dug well water in Hämeenkoski, 8.77-2640 µg/l. Seasonal and spatial variability in Mn concentrations in water samples from two bedrock wells was large at monitoring sites in northern Finland. Variability in the Mn concentrations in groundwater can be large, even in the same area. These data suggest that single measurements of the Mn concentration from a water source may not reveal the Mn status, and measurement of both the total and soluble Mn concentrations may be recommended.
Keywords: Bedrock; Groundwater; Manganese; Medical geology; Quaternary deposit.
Figures


References
-
- Ander EL, Watts MJ, Smedley PL, Hamilton EM, Close R, Crabbe H, et al. Variability in the chemistry of private drinking water supplies and the impact of domestic treatment systems on water quality. Environmental geochemistry and health. 2016;38(6):1313–1332. doi: 10.1007/s10653-016-9798-0. - DOI - PMC - PubMed
-
- Agency for Toxic Substances and Disease Registry (ATSDR). 2012. Toxicological Profile for Manganese. Atlanta, GA: U.S. Department of Health and Human Services, Public Health Services. https://www.atsdr.cdc.gov/substances/toxsubstance.asp?toxid=23 (Last reviewed and updated August 14, 2018, accessed 28.2.2019)
-
- Backman, B. (1993). Lammin–Kosken (HI) alueen pohjaveden seurantatutkimus. Vuosien 1969–1990 tulokset. Summary: Groundwater monitoring in the Lammi–Koski area, results for 1969–1990. Geological Survey of Finland, Report of Investigation, 118. Espoo. (p. 100) https://tupa.gtk.fi/julkaisu/tutkimusraportti/tr_118.pdf. (accessed 1.7.2020)
-
- Backman, B., Lahermo, P., Väisänen, U., Paukola, T., Juntunen, R., Karhu, J.,et al. (1999). Geologian ja ihmisen toiminnan vaikutus pohjaveteen: seurantatutkimuksen tulokset vuosilta 1969–1996 (in Finnish). Summary: The Effect of Geological Environment and Human Activities on Groundwater in Finland. The Results of Monitoring in 1969 - 1996. Geological Survey of Finland. Report of Investigation, 147. ISSN 0781–4240. Espoo, (p. 261).
-
- Backman, B. (2004). Groundwater quality, acidification, and recovery trends between 1969 and 2002 in South Finland. Geological Survey of Finland, Bulletin. Espoo. Academic dissertation. ISBN: 951–690–895–0. (p. 110).
MeSH terms
Substances
LinkOut - more resources
Full Text Sources
