. 2020 Aug 6;182(3):545-562.e23.
doi: 10.1016/j.cell.2020.06.030. Epub 2020 Jul 3.

Type V Collagen in Scar Tissue Regulates the Size of Scar after Heart Injury

Affiliations

Type V Collagen in Scar Tissue Regulates the Size of Scar after Heart Injury

Tomohiro Yokota et al. Cell. .

Abstract

Scar tissue size following myocardial infarction is an independent predictor of cardiovascular outcomes, yet little is known about factors regulating scar size. We demonstrate that collagen V, a minor constituent of heart scars, regulates the size of heart scars after ischemic injury. Depletion of collagen V led to a paradoxical increase in post-infarction scar size with worsening of heart function. A systems genetics approach across 100 in-bred strains of mice demonstrated that collagen V is a critical driver of postinjury heart function. We show that collagen V deficiency alters the mechanical properties of scar tissue, and altered reciprocal feedback between matrix and cells induces expression of mechanosensitive integrins that drive fibroblast activation and increase scar size. Cilengitide, an inhibitor of specific integrins, rescues the phenotype of increased post-injury scarring in collagen-V-deficient mice. These observations demonstrate that collagen V regulates scar size in an integrin-dependent manner.

Keywords: Col5a1; cilengitide; collagen V; fibrosis; heart scar; integrins; scar mechanics.


Conflict of interest statement

Declaration of Interests The authors declare no competing interests. Based on this work, patent no: 63/002,828 “Compositions and methods for treating dysregulated wound healing” has been filed and assigned to the Regents of the University of California.

Figures

Fig 1.
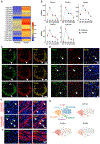
Fig 1.. Temporal changes in gene expression of scar tissue following acute ischemic cardiac injury.
(A) Principal component analysis based on expression profiles of all genes (n=4) (B) Summary of differential gene expression analysis. Arrows and numbers indicate direction and numbers of differentially expressed genes detected in each pairwise comparison. (FDR 1%, fold change>4) (C) Heatmap with expression patterns of collagen genes (n=4). (D) Expression of collagen genes encoding for obligatory units of the respective collagen by qPCR (mean± S.D., *p<0.05, n=5)
Figure 2.
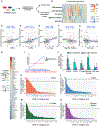
Figure 2.. Expression of Col5a1 in relation to Col1a1 and Col3a1.
(A) Proteomic analysis of individual collagen chains in injured and remote region of myocardium at 7 days post MI (n=3). (B) Normalized expression levels (RPKM) for selected collagen genes. Average expression levels across timepoints are shown in black symbols and dashed lines. Expression levels for individual replicates are shown in colored symbols (n=4). (C) RNA-FISH to demonstrate expression of Col5a1, Col1a1 and Col3a1 in the heart at 7 days post-MI (solid arrowhead, representative images, n=4, unfilled arrowhead indicates remote region). (D) Higher magnification demonstrating co-localization of Col5a1 with Col1a1 and Col3a1 within the same cell (arrows, representative images, n=4). (E) Expression of Col5a1 in cardiac fibroblasts genetically labeled by the TCF21 or Col1a2 label but (F) not in cardiomyocytes (Troponin I stained) in the injury region (arrows, representative images, n=3). (G) Single cell RNA-seq of non-myocytes at 7 days post-MI demonstrating typical cell phenotypes in clusters and distribution of Col1a1, Col3a1 and Col5a1 (n=3).
Figure 3.
Figure 3.. Animals with Col5a1 deletion in cardiac fibroblasts exhibit a paradoxical increase in scar tissue after heart injury.
(A) M mode echocardiogram demonstrating left ventricular (LV) walls and internal dimension (yellow line) prior to basal and 6 weeks post-MI (representative images). (B) Ejection fraction (EF), Fractional shortening (FS), LV dimensions in end diastole (LVIDd) and end systole (LVIDs) at different time points post-MI (n=12/Control and 27/CKO at basal, n=10/Control and 22/CKO at 3D, n=9/Control and 15/CKO at 1wk, n=9/Control and 13/CKO at 2wks, n=8/Control and 12/CKO at 4 and 6wks post-MI) (C) Masson trichrome staining of hearts sectioned at the base (just distal to suture line) at mid ventricle and apex 6 weeks post-MI (representative images) (D) Quantification of surface area of scar normalized to the surface area of the ventricle (n=8/Control and 12/CKO). (E) Fraction of animals demonstrating mild/moderate or severe scarring at 6 weeks post-MI. (F) Measurement of insoluble collagen in scar tissue at 4 weeks post-MI (n=4) (G) Toluidine blue staining of scar tissue at 4 weeks post-MI (arrowhead, representative images, n=2) (H) Transmission electron microscopy (TEM) of scar area showing fibrillar disarray in the Col5a1CKO (arrowhead, FB=fibroblast) (I) Higher magnification with TEM demonstrating fibrillar disarray with fibrils running in orthogonal axes to each other in the Col5a1CKO scar (arrowhead) (J) Cross sectional TEM view demonstrating fibril diameter size (arrowheads, n=2 for all TEM) (K) Average collagen fibril diameter in scars (n=2) (L) Histogram of collagen fibrils diameters demonstrates a clear shift to the right in Col5a1CKO (n=2) (M, N) Electron Tomogram of scar area from (M) Control and (N) Col5a1CKO animal. Data shown as mean± S.D., *p<0.05.
Fig 4.
Fig 4.. Importance of Col5a1 in regulating cardiac function post injury vis-a-vis other ECM genes.
(A) HMDP comprising 96 strains of mice were subjected to continuous isoproterenol infusion for 3 weeks (B) Gene X trait analysis demonstrating strength of association between individual ECM genes and cardiac traits. (C-G) Scatter plots shows correlation of Col5a1 expression with traits of (C) LVIDs (D) LVIDd (E) LV mass (F) EF and (G) E/A ratio following isoproterenol injection across all HMDP strains. (H) Strength of association between Col5a1 expression and that of ECM genes (*p<0.01). (I) Hypothesis of how adjustment for Col5a1 could significantly change the strength of association between ECM genes and cardiac traits (J) Conditional analysis demonstrating the strength of correlation (−log p value) between ECM genes and different cardiac traits following adjustment for Col5a1 expression (***p<0.005,**p<0.01, compared to isoproterenol unadjusted) (K-N) Change in significance of rest of ECM genes and specific trait (K) LVIDs (L) LVIDd (M) LV mass (N) EF following adjustment for specific gene (horizontal dotted line shows a cut off p value=0.01).
Fig 5.
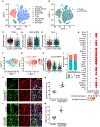
Fig 5.. Single cell RNA-seq of non-myocytes of control and Col5a1CKO hearts harvested at 7 days following injury.
(A) tSNE plot demonstrating non-myocyte cell populations of the heart at 7 days post-MI (B) Distribution of non-myocyte cells from injured Control and Col5a1CKO hearts across these clusters. (C-E) Violin plot demonstrating expression of (C) Col5a1, (D) Acta2 (αSMA), (E) Cnn2 (Calponin) in fibroblast clusters. (F) Sub-clustering of fibroblast population (G) UMAP plot with expression of αSMA in fibroblast subclusters (H) Expression of Acta2 in subclusters of fibroblasts (I) Cell numbers in Cluster 0 (myofibroblasts) versus Cluster 1 and 2 (non-myofibroblasts) (J) Immunostaining for asmooth muscle actin (αSMA) and vimentin (Vim) in the scar of Col5a1CKO at 7 days post-MI (arrows, representative images) (K) Quantitation of the number of αSMA expressing myofibroblasts (n=4/Control and 5/CKO) (L) Immunostaining for αSMA and Vim in the scar of TCF21MCM:Col5a1CKO hearts at 7 days post-MI (arrows, representative images). (M) Quantitation of the number of αSMA expressing myofibroblasts (n=6/Control and 4/CKO) (N) Dot plot representing expression of ECM genes that are significantly upregulated in fibroblasts of Col5a1CKO hearts at 7 days post-MI (adjusted p value <0.05). Data shown as mean± S.D., *p<0.05.
Fig 6.
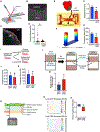
Fig 6.. Col5a1CKO fibroblasts exhibit altered mechano-biological properties.
(A) Schematic illustration of atomic force microscopy (AFM) instrumentation (B) Representative image of AFM probe and cantilever over tissue section (C) Representative image of collagen I (Col I) indirect immunofluorescence detection in scar region (arrow) that was probed with AFM. (D) Young’s Modulus measurements from injured regions (mean± SEM, *p<0.05, n=3). (E-H) Determination of mutant or control cardiac fibroblasts (CFs) to generate contractile forces. (E) CFs were isolated at 7 days post-MI and incorporated into hydrogel scaffolds and suspended between PDMS posts (F) Contraction of CFs determined from displacement of PDMS posts. (G) Displacement of PDMS posts by CFs tissue scaffold (n=3) (H) Contraction forces generated by either Control or Col5a1CKO CFs (n=3) (I-K) Determination of contractile forces by generating Col5a1CKO CFs ex vivo. (I) CFs from hearts of Col5a1fl/fl mice were infected with a lentiviral Cre or GFP virus to create Col5a1 deficient CFs (J) Displacement of the PDMS posts and (K) contractile forces generated by Col5a1CKO CFs (n=3). (L) Schematic illustration of parallel microfiltration (PMF assay) (M) Relative retention of cells measured by PMF assay and normalized to the control (Lenti-GFP) CFs. (n=3) (N) Schematic of set up of Traction force microscopy where myocytes and CFs are seeded onto a matrigel layer containing gold labeled nanoparticles. (O) Heat maps demonstrating displacement of clusters of contracting myocytes and (P) determination of stress forces generated by myocytes in the presence of Col5a1CKO CFs (n=3). Data unless otherwise stated shown as mean± S.D., *p<0.05.
Fig 7.
Fig 7.. Inhibition of αvβ3 and αvβ5 integrins rescues increased scarring and cardiac dysfunction in Col5a1CKO animals.
(A) Expression of ECM and myofibroblast genes in Col5a1CKO CFs generated ex vivo (n=6) (B,C) Flow cytometry to determine expression of (B) αvβ3 and (C) αvβ5 integrins on Col5a1CKO CFs (n=6). (D,E) Immunostaining for Vim and (D) αvβ3, (E) αvβ5 in scar tissue at 7 days post-MI (arrows, representative images) (F) Expression of key myofibroblast genes in Col5a1CKO CFs in the presence or absence of cilengitide (n=6). (G) Experimental design to treat animals with daily cilengitide (20mg/kg) (H) EF/FS in control and Col5a1CKO injected with cilengitide or vehicle (*Col5a1CKO+Cilengitide [red dotted line] vs. Col5a1CKO+Veh [red solid line], n=13/CKO+Cilengitide 10/other groups at basal, n=12/CKo+Cilengitide, 6/CKO+Veh, 9/Control+Cilengitide, 7/Control+Veh at 2wks post MI). (I) Representative images of M mode echocardiogram (yellow line indicates end systolic diameter) (J) Masson trichrome staining of mid ventricle at 2 weeks post-MI to show scar size (arrowhead, n=same number at 2 weeks post-MI as above) (K) Quantitation of fibrotic area (n=same number as above) (L) Fraction of Col5a1CKO animals demonstrating mild, moderate and severe fibrosis following PBS or cilengitide infusion (M) Immunostaining for αSMA and Vimentin in hearts of Col5a1CKO receiving PBS or cilengitide and quantitation of the fraction (arrows, representative images, n=10/CKO+Cilengitide, n=6/CKO+Veh, n=6/animals for all other groups). (N) Dot plot representing expression of ECM genes that are upregulated in CFs of Col5a1CKO hearts at 7 days post-MI compared to controls (left panel), the same genes were shown in fibroblasts from Col5a1CKO+Vehicle and Col5a1CKO+Cilengitide samples (right panel). (O) Box plot showing the module scores of 28 genes from (N) in fibroblasts from Col5a1CKO+Veh and Col5a1CKO+Cilengitide. Data shown as mean± S.D., *p<0.05, ns: Not significant.

Comment in

References

    1. Acharya A, Baek ST, Banfi S, Eskiocak B, and Tallquist MD (2011). Efficient inducible Cre-mediated recombination in Tcf21 cell lineages in the heart and kidney. Genesis 49, 870–877. - PMC - PubMed
    1. Asano Y, Ihn H, Yamane K, Jinnin M, Mimura Y, and Tamaki K (2005). Increased expression of integrin alpha(v)beta3 contributes to the establishment of autocrine TGF-beta signaling in scleroderma fibroblasts. J Immunol 175, 7708–7718. - PubMed
    1. Bagnato GL, Irrera N, Pizzino G, Santoro D, Roberts WN, Bagnato G, Pallio G, Vaccaro M, Squadrito F, Saitta A, et al. (2018). Dual alphavbeta3 and alphavbeta5 blockade attenuates fibrotic and vascular alterations in a murine model of systemic sclerosis. Clin Sci (Lond) 132, 231–242. - PubMed
    1. Barer R (1952). Interference microscopy and mass determination. Nature 169, 366–367. - PubMed
    1. Bashey RI, Martinez-Hernandez A, and Jimenez SA (1992). Isolation, characterization, and localization of cardiac collagen type VI. Associations with other extracellular matrix components. Circ Res 70, 1006–1017. - PubMed

Publication types

MeSH terms