

Chest CT score in COVID-19 patients: correlation with disease severity and short-term prognosis
- PMID: 32623505
- PMCID: PMC7334627
- DOI: 10.1007/s00330-020-07033-y
Chest CT score in COVID-19 patients: correlation with disease severity and short-term prognosis
Abstract
Objectives: To correlate a CT-based semi-quantitative score of pulmonary involvement in COVID-19 pneumonia with clinical staging of disease and laboratory findings. We also aimed to investigate whether CT findings may be predictive of patients' outcome.
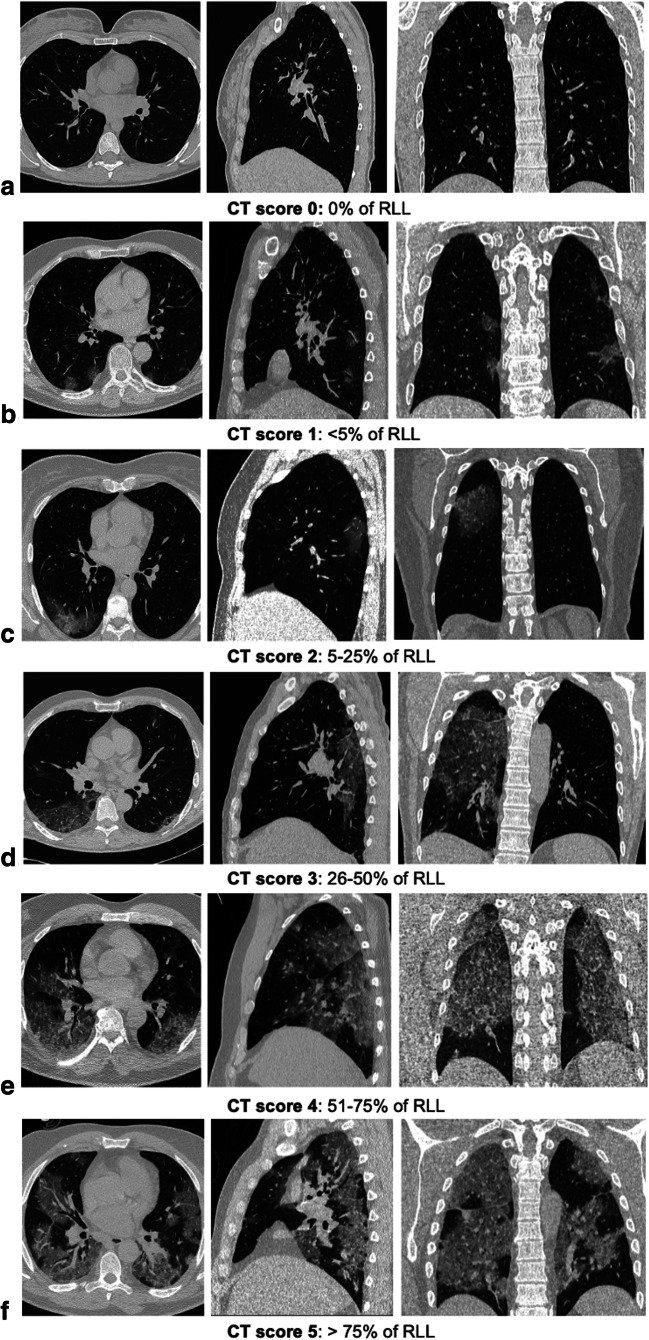
Methods: From March 6 to March 22, 2020, 130 symptomatic SARS-CoV-2 patients were enrolled for this single-center analysis and chest CT examinations were retrospectively evaluated. A semi-quantitative CT score was calculated based on the extent of lobar involvement (0:0%; 1, < 5%; 2:5-25%; 3:26-50%; 4:51-75%; 5, > 75%; range 0-5; global score 0-25). Data were matched with clinical stages and laboratory findings. Survival curves and univariate and multivariate analyses were performed to evaluate the role of CT score as a predictor of patients' outcome.
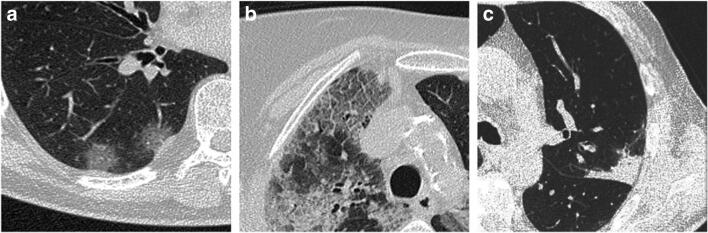
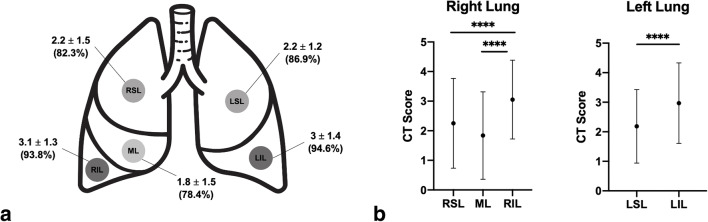
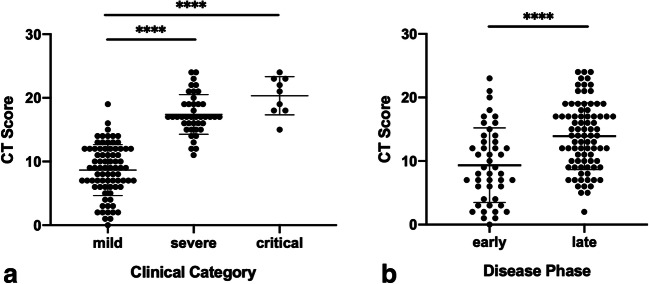
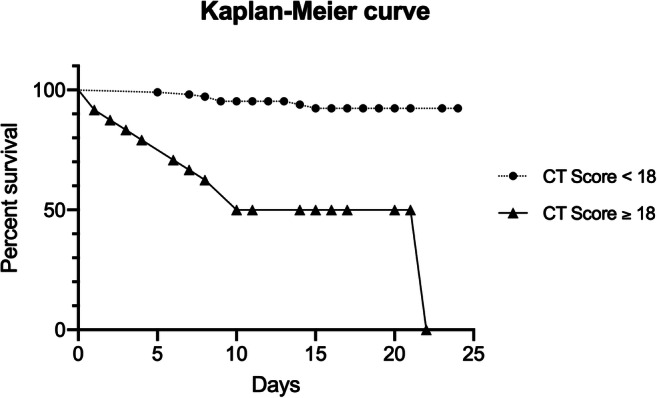
Results: Ground glass opacities were predominant in early-phase (≤ 7 days since symptoms' onset), while crazy-paving pattern, consolidation, and fibrosis characterized late-phase disease (> 7 days). CT score was significantly higher in critical and severe than in mild stage (p < 0.0001), and among late-phase than early-phase patients (p < 0.0001). CT score was significantly correlated with CRP (p < 0.0001, r = 0.6204) and D-dimer (p < 0.0001, r = 0.6625) levels. A CT score of ≥ 18 was associated with an increased mortality risk and was found to be predictive of death both in univariate (HR, 8.33; 95% CI, 3.19-21.73; p < 0.0001) and multivariate analysis (HR, 3.74; 95% CI, 1.10-12.77; p = 0.0348).
Conclusions: Our preliminary data suggest the potential role of CT score for predicting the outcome of SARS-CoV-2 patients. CT score is highly correlated with laboratory findings and disease severity and might be beneficial to speed-up diagnostic workflow in symptomatic cases.
Key points: • CT score is positively correlated with age, inflammatory biomarkers, severity of clinical categories, and disease phases. • A CT score ≥ 18 has shown to be highly predictive of patient's mortality in short-term follow-up. • Our multivariate analysis demonstrated that CT parenchymal assessment may more accurately reflect short-term outcome, providing a direct visualization of anatomic injury compared with non-specific inflammatory biomarkers.
Keywords: COVID-19; Pneumonia; Severe acute respiratory syndrome coronavirus 2; Tomography, X-ray computed.
Conflict of interest statement
The authors of this manuscript declare no relationships with any companies whose products or services may be related to the subject matter of the article.
Figures
Comment in
-
Severity of inflammatory lung lesions in COVID-19 based on computed tomography examination as a prognostic factor for respiratory failure and death.Pol Arch Intern Med. 2021 Sep 30;131(9):882-884. doi: 10.20452/pamw.16074. Epub 2021 Sep 20. Pol Arch Intern Med. 2021. PMID: 34542248 No abstract available.
References
-
- WHO Director-General’s opening remarks at the media briefing on COVID-19 - 11 March 2020. https://www.who.int/dg/speeches/detail/who-director-general-s-opening-re.... Accessed 27 Mar 2020
-
- Coronavirus disease (COVID-19) Situation Dashboard. https://experience.arcgis.com/experience/685d0ace521648f8a5beeeee1b9125cd. Accessed 2 Apr 2020
-
- Remuzzi A, Remuzzi G (2020) COVID-19 and Italy: what next? Lancet 0: 10.1016/S0140-6736(20)30627-9
MeSH terms
LinkOut - more resources
Full Text Sources
Medical
Research Materials
Miscellaneous
