Meta-Analysis
. 2020 Sep;14(5):711-722.
doi: 10.1007/s12072-020-10071-9. Epub 2020 Jul 4.

Coronavirus disease (COVID-19) and the liver: a comprehensive systematic review and meta-analysis

Affiliations
Meta-Analysis

Coronavirus disease (COVID-19) and the liver: a comprehensive systematic review and meta-analysis

Praveen Kumar-M et al. Hepatol Int. 2020 Sep.

Abstract

Background: Liver function derangements have been reported in coronavirus disease (COVID-19), but reported rates are variable.

Methods: We searched PubMed and Embase with terms COVID and SARS-COV-2 from December 1, 2019 till April 5, 2020. We estimated overall prevalence, stratified prevalence based on severity, estimated risk ratio (RR), and estimated standardized mean difference (SMD) of liver function parameters in severe as compared to non-severe COVID. Random effect method utilizing inverse variance approach was used for pooling the data.

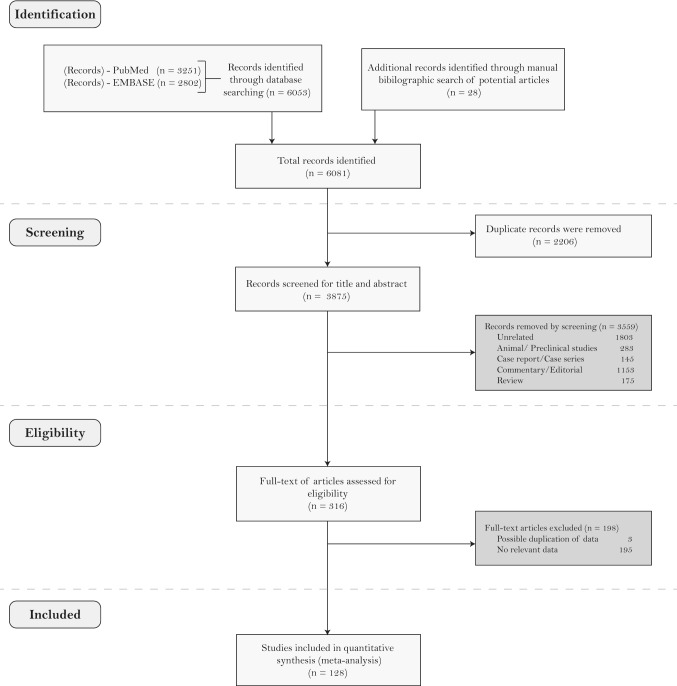
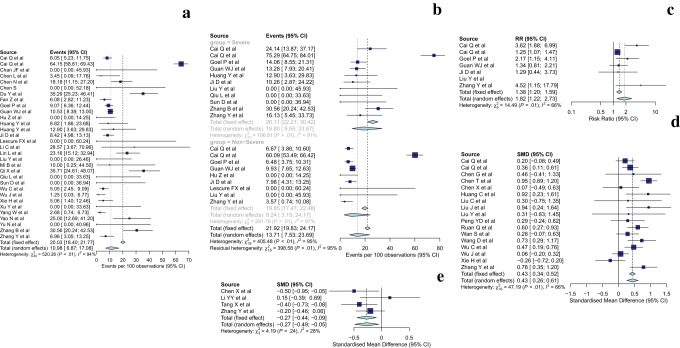
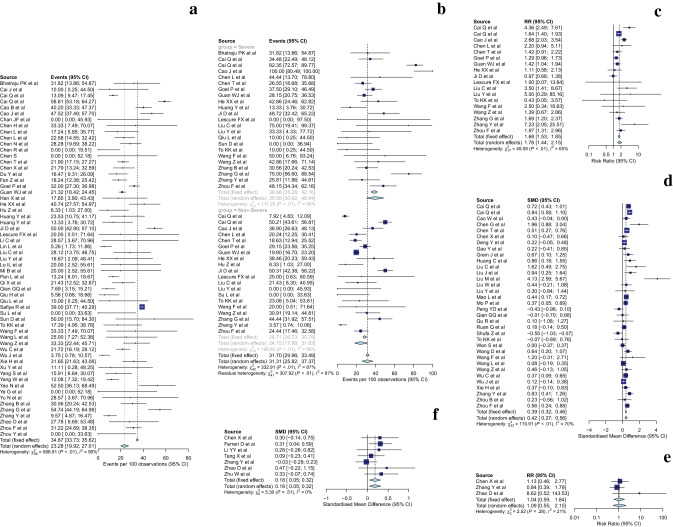
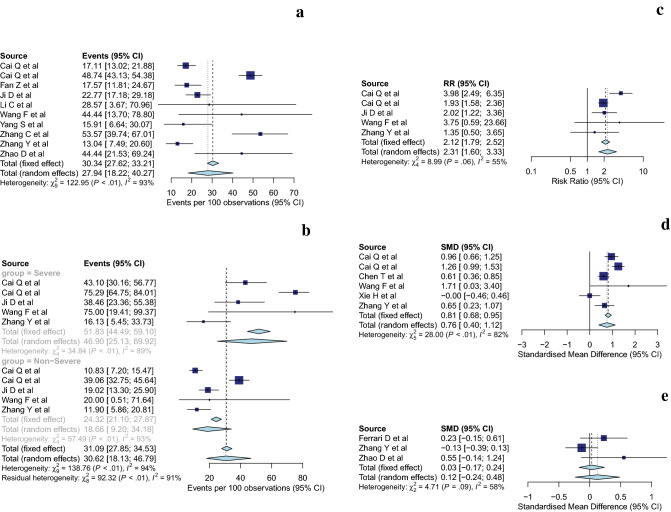
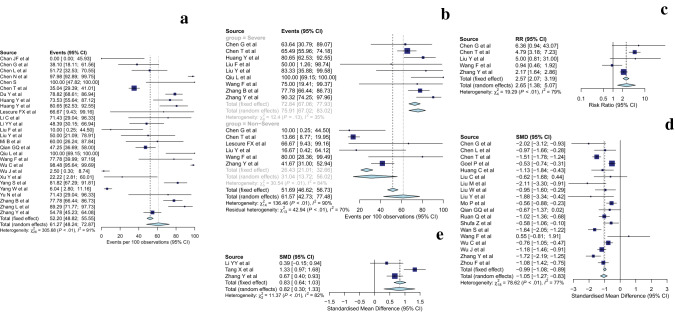
Results: In all, 128 studies were included. The most frequent abnormalities were hypoalbuminemia [61.27% (48.24-72.87)], elevations of gamma-glutamyl transferase (GGT) [27.94% (18.22-40.27)], alanine aminotransferase (ALT) [23.28% (19.92-27.01)], and aspartate aminotransferase (AST) [23.41% (18.84-28.70)]. Furthermore, the relative risk of these abnormalities was higher in the patients with severe COVID-19 when compared to non-severe disease [Hypoalbuminemia-2.65 (1.38-5.07); GGT-2.31 (1.6-3.33); ALT-1.76 (1.44-2.15); AST-2.30 (1.82-2.90)]. The SMD of hypoalbuminemia, GGT, ALT, and AST elevation in severe as compared to non-severe were - 1.05 (- 1.27 to - 0.83), 0.76 (0.40-1.12), 0.42 (0.27-0.56), and 0.69 (0.52-0.86), respectively. The pooled prevalence and RR of chronic liver disease as a comorbidity was 2.64% (1.73-4) and 1.69 (1.05-2.73) respectively.

Conclusion: The most frequent abnormality in liver functions was hypoalbuminemia followed by derangements in gamma-glutamyl transferase and aminotransferases, and these abnormalities were more frequent in severe disease. The systematic review was, however, limited by heterogeneity in definitions of severity and liver function derangements. Graphical depiction of the summary of meta-analytic findings a) pooled prevalence of abnormalities b) Risk ratio of abnormality in severe versus non-severe COVID-19 c) standardized mean difference (SMD) between severe and non-severe group and d) pooled prevalence for parameters based on severity stratification for bilirubin, alanine aminotransferase (ALT), aspartate aminotransferase (AST), alkaline phosphatase (ALP), gamma-glutamyl transferase (GGT), albumin, globulin and acute hepatic injury (AHI) . Also estimates for overall/total liver disease (TLD) and chronic liver disease (CLD) amongst COVID-19 patients are depicted in a, b, d. For d) In addition to severity stratification, Overall (all studies for a particular estimate) and combined (only those studies which reported severity) estimates are provided.

Keywords: COVID-19; Cirrhosis; Histology; SARS-CoV-2; Transplantation.


Conflict of interest statement

M. Praveen Kumar, Shubhra Mishra, Daya Krishna Jha, Jayendra Shukla, Arup Choudhury, Ritin Mohindra, Harshal S. Mandavdhare, Usha Dutta, and Vishal Sharma declare that they have no conflict of interest.

Figures

Fig. 1
Fig. 1
PRISMA chart showing the flow of study inclusion for the meta-analysis
Fig. 2
Fig. 2
Forest plots of bilirubin. Random effects summary were reported in the manuscript. The heterogeneity was measured across studies by I2 and p value of heterogeneity. a Pooled prevalence of hyperbilirubinemia reported in various studies. b Pooled prevalence of hyperbilirubinemia among the studies which reported the findings on the basis of underlying severity of COVID-19. c Risk ratio (RR) of hyperbilirubinemia in severe as compared to non-severe subgroups. For RR, the middle vertical line at 1 stands for line of no-difference d SMD for bilirubin concentration between the severe and non-severe groups. For SMD, the middle vertical line at 0 stands for line of no difference. e SMD of bilirubin concentration between COVID and non-COVID subgroups. SMD standardized mean difference, RR risk ratio, CI confidence interval
Fig. 3
Fig. 3
Forest plots of alanine aminotransferase (ALT). Random effects summary were reported in the manuscript. The heterogeneity was measured across studies by I2 and p values of heterogeneity. a Pooled prevalence of ALT elevation reported in various studies. b Pooled prevalence of ALT elevation among the studies which reported the finding on the basis of underlying severity of COVID-19. c Risk ratio (RR) of ALT elevation in severe as compared to non-severe subgroups. For RR, the middle vertical line at 1 stands for line of no-difference. d SMD for ALT elevation between the severe and non-severe groups. For SMD, the middle vertical line at 0 stands for line of no difference. e RR of ALT elevation in the COVID as compared to non-COVID subgroups. f SMD of ALT elevation between COVID and non-COVID subgroup. SMD standardized mean difference, RR risk ratio, CI confidence interval
Fig. 4
Fig. 4
Forest plots of aspartate aminotransferase (AST). Random effects summary were reported in the manuscript. The heterogeneity was measured across studies by I2 and p values of heterogeneity. a Pooled prevalence of AST elevation reported in various studies. b Pooled prevalence of AST elevation among the studies which reported the finding on the basis of underlying severity of COVID-19. c Risk ratio (RR) of AST elevation in severe as compared to non-severe subgroups. For RR, the middle vertical line at 1 stands for line of no-difference. d SMD for AST elevation between the severe and non-severe groups. For SMD, the middle vertical line at 0 stands for line of no difference. e RR of AST elevation in the COVID as compared to non-COVID subgroups. f SMD of AST elevation between COVID and non-COVID subgroups. SMD standardized mean difference, RR risk ratio, CI confidence interval
Fig. 5
Fig. 5
Forest plots of gamma-glutamyl transferase (GGT). Random effects summary were reported in the manuscript. The heterogeneity was measured across studies by I2 and p values of heterogeneity. a Pooled prevalence of GGT elevation reported in various studies. b Pooled prevalence of GGT elevation among the studies which reported the finding on the basis of underlying severity of COVID-19. c Risk ratio (RR) of GGT elevation in severe as compared to non-severe subgroups. For RR, the middle vertical line at 1 stands for line of no-difference. d SMD for GGT elevation between the severe and non-severe groups. For SMD, the middle vertical line at 0 stands for line of no difference. e SMD of GGT elevation between COVID and non-COVID subgroup. SMD standardized mean difference, RR risk ratio, CI confidence interval
Fig. 6
Fig. 6
Forest plots of albumin. Random effects summary were reported in the manuscript. The heterogeneity was measured across studies by I2 and p values of heterogeneity. a Pooled prevalence of hypoalbuminemia reported in various studies. b Pooled prevalence of hypoalbuminemia among the studies which reported the finding on the basis of underlying severity of COVID-19. c Risk ratio (RR) of hypoalbuminemia in severe as compared to non-severe subgroups. For RR, the middle vertical line at 1 stands for line of no-difference. d SMD for hypoalbuminemia between the severe and non-severe groups. For SMD, the middle vertical line at 0 stands for line of no difference. e SMD of hypoalbuminemia between COVID and non-COVID subgroups. SMD standardized mean difference, RR risk ratio, CI confidence interval

Similar articles

Cited by

References

    1. World Health Organisation. Interim guidance: Clinical management of severe acute respiratory infection (SARI) when COVID-19 disease is suspected. 2nd Edition. WHO/2019-nCoV/clinical/2020.4
    1. Cheung KS, Hung IF, Chan PP, Lung KC, Tso E, Liu R, et al. Gastrointestinal manifestations of SARS-CoV-2 infection and virus load in fecal samples from the Hong Kong cohort and systematic review and meta-analysis. Gastroenterology. 2020 doi: 10.1053/j.gastro.2020.03.065. - DOI - PMC - PubMed
    1. Xu L, Liu J, Lu M, Yang D, Zheng X. Liver injury during highly pathogenic human coronavirus infections. Liver Int. 2020 doi: 10.1111/liv.14435. - DOI - PMC - PubMed
    1. Guan GW, Gao L, Wang JW, Wen XJ, Mao TH, Peng SW, Zhang T, Chen XM, Lu FM. Exploring the mechanism of liver enzyme abnormalities in patients with novel coronavirus-infected pneumonia. Zhonghua Gan Zang Bing Za Zhi. 2020;28(2):E002. doi: 10.3760/cma.j.issn.1007-3418.2020.02.002. - DOI - PubMed
    1. Bangash MN, Patel J, Parekh D. COVID-19 and the liver: little cause for concern. Lancet Gastroenterol Hepatol. 2020 doi: 10.1016/S2468-1253(20)30084-4. - DOI - PMC - PubMed

MeSH terms