. 2020 Aug 21;15(8):2212-2220.
doi: 10.1021/acschembio.0c00412. Epub 2020 Jul 16.

Photo-SNAP-tag, a Light-Regulated Chemical Labeling System

Affiliations

Photo-SNAP-tag, a Light-Regulated Chemical Labeling System

Joseph D Cleveland et al. ACS Chem Biol. .

Abstract

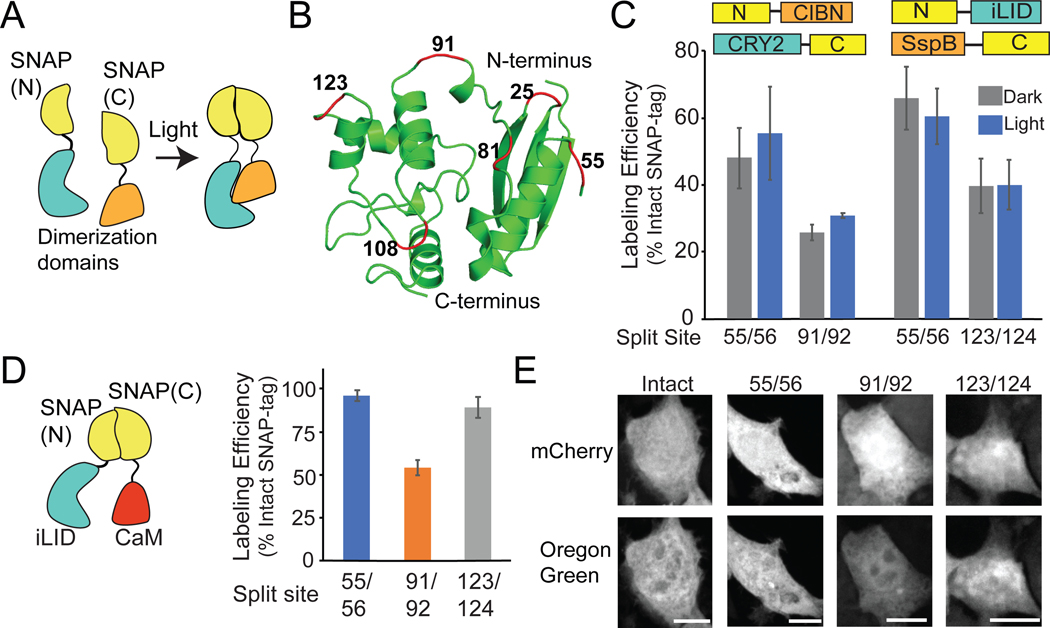
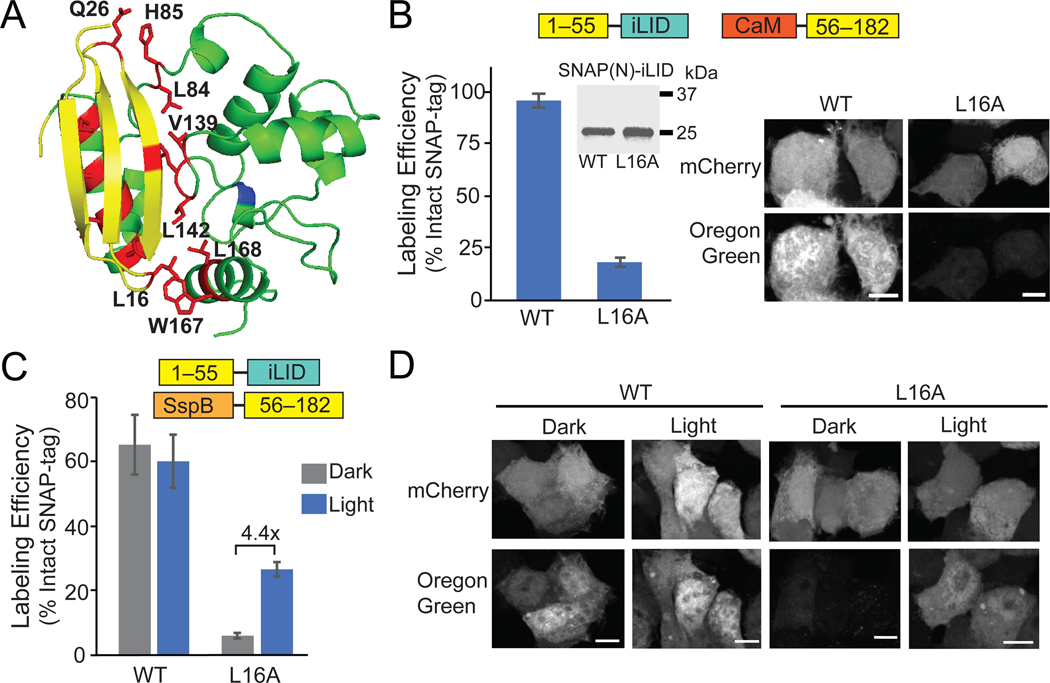
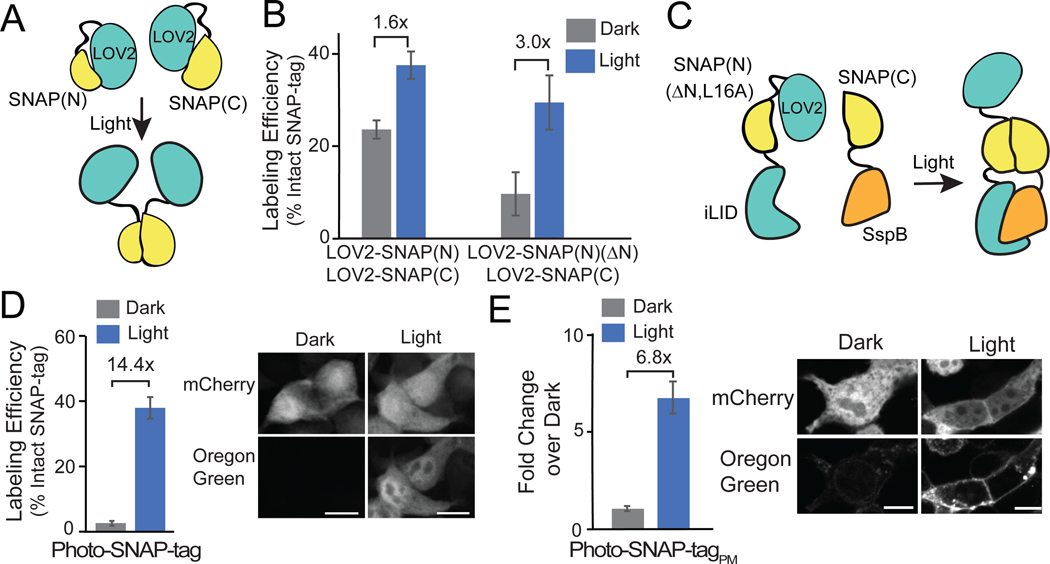
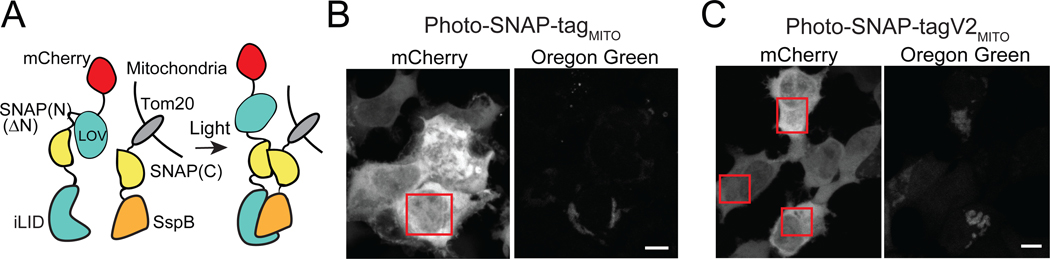
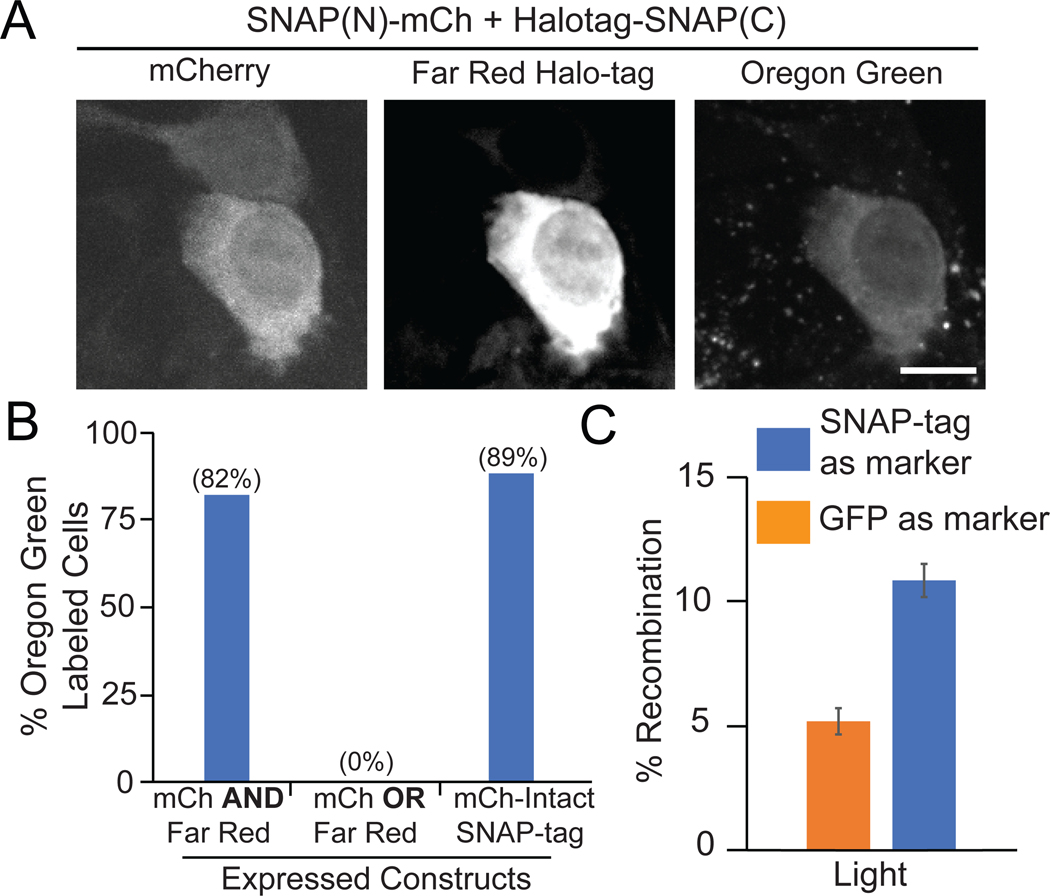
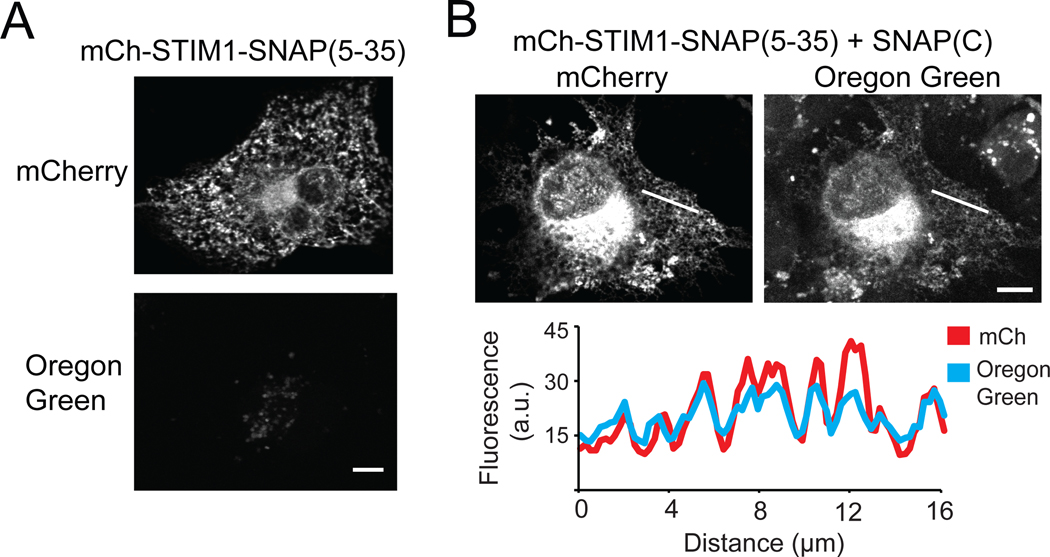
Methods that allow labeling and tracking of proteins have been instrumental for understanding their function. Traditional methods for labeling proteins include fusion to fluorescent proteins or self-labeling chemical tagging systems such as SNAP-tag or Halo-tag. These latter approaches allow bright fluorophores or other chemical moieties to be attached to a protein of interest through a small fusion tag. In this work, we sought to improve the versatility of self-labeling chemical-tagging systems by regulating their activity with light. We used light-inducible dimerizers to reconstitute a split SNAP-tag (modified human O6-alkylguanine-DNA-alkyltransferase, hAGT) protein, allowing tight light-dependent control of chemical labeling. In addition, we generated a small split SNAP-tag fragment that can efficiently self-assemble with its complement fragment, allowing high labeling efficacy with a small tag. We envision these tools will extend the versatility and utility of the SNAP-tag chemical system for protein labeling applications.


Figures

Figure 1.
Figure 1.
SNAP-tag activity can be reconstituted from split fragments. A) Schematic illustrating the reconstitution of SNAP(N) and SNAP(C) using dimerization domains. B) Location of tested split sites (red) within SNAP-tag (PDB:3KZY). C) Quantification of SNAP-tag activity (using BG-Oregon Green) with CRY2/CIBN or iLID/SspB photodimerizers. Labeling efficiency is expressed as a percent of intact SNAP-tag labeling. D, E) Quantification and representative images of BG-Oregon Green labeling with SNAP 55/56, 91/92, and 123/124 fused to non-interacting proteins iLID and CaM. Cells were labeled for 1 hr. Graphs represent average and error (S.E.M.) of 3 biological replicates, with over 30 cells quantified for each condition. Scale bars, 10 μm.
Figure 2.
Figure 2.
A L16A mutation disrupts SNAP 1–55/56–182 self-assembly and allows light-dependent activity. A) Residues (red) along SNAP(N) and SNAP(C) interface targeted for mutation. B) Quantification and representative images of BG-Oregon Green labeling using Calmodulin-SNAP(C) and SNAP(N)-iLID (wt or L16A). Inset shows immunoblot of HA-SNAP(N)-iLID (wt or L16A). C, D) Quantification (C) and images (D) of labeling of SspBmicro-SNAP(C) with SNAP(N)-iLID (wt or L16A), kept in dark or treated with light (1 s pulse 461 nm, every 30s for 2 hr). Graphs show average and error (S.E.M.) of 3 biological replicates. For each biological replicate, over 30 cells were quantified for each condition. Scale bars, 10 μm.
Figure 3.
Figure 3.
Steric blocking the N-terminus of SNAP(N) using AsLOV2 improves light regulation. A) Schematic of strategy to control interaction of SNAP(N) and SNAP(C) with AsLOV2. B) Quantification of labeling, comparing initial AsLOV2-fused version (left), and improved version (right, SNAP(N)(ΔN)), for cells kept in dark or light-treated (1s 461 nm pulse every 30s for 2h). Graph shows average and error (S.E.M.) of 3 biological replicates for graph at left, average and range for 2 for graph at right C) Strategy combining AsLOV2 steric blocking and dimerization. D) Quantification and images of Photo-SNAP-tag labeling in the cytosol in cells expressing LOV2-SNAP(N)(ΔN,L16A)-iLID and SspBmicro-SNAP(C). Graph shows average and error (S.E.M) of 3 biological replicates. E) Light/dark fold change and images of SNAP-Tag labeling (not normalized to intact SNAP-tag) in cells expressing mCh-LOV2-SNAP(N)(ΔN,L16A)-iLID(V416I) and plasma-membrane localized SspBmicro-SNAP(C)-CAAX. Graph reports average and error (S.E.M) of one experiment. 30 cells were quantified for each condition in all graphs. All scale bars, 10 μm.
Figure 4.
Figure 4.
Spatial control of Photo-SNAP-tag at the mitochondria. A) Schematic of constructs. B,C) HEK293T cells were incubated with 1 μM BG-Oregon Green for 20 min (Photo-SNAP-tagMITO) (B) or 30 min (Photo-SNAP-tagV2MITO) (C). The boxed regions were focally stimulated with 488 nm light. Scale bars, 10 μm.
Figure 5.
Figure 5.
Split SNAP(N)/(C) as intersectional reporter. A) Representative images of cells expressing mCherry and Halo-tag, or only mCherry, with BG-Oregon Green. Scale bars, 10 μm. B) Quantification of BG-Oregon Green labeling of cells expressing both mCherry and Halo-tag, only one construct, or a mCh-fused intact SNAP-tag control. Data represents a single experiment, 21–45 cells quantified each condition. C) Use of split SNAP-tag to quantify efficiency of a two-component split photoactivable Cre system. Cells were transfected with SNAP(N)-iLID-IRES-CIB1-Cre(C)/SNAP(C)-IRES-CRY2(L348F)-Cre(N) or CIB1-Cre(C)/EGFP-IRES-CRY2(L348F)-Cre(N), along with a floxed dsRed Cre reporter. Recombination efficiency was calculated using the split SNAP-tag, or a single transfection marker (EGFP-IRES upstream of the Cre recombinase fragment). Graph shows average and range of two biological replicates.
Figure 6.
Figure 6.
Using SNAP(5–35)/SNAP(C) to label ER-localized STIM1. A) COS-7 cell expressing mCh-STIM1-SNAP(5–35) showing mCherry localized to the ER and no Oregon Green labeling. B) Cell expressing mCh-STIM1-SNAP(5–35) and soluble SNAP(C) showing mCherry and Oregon Green labeling at the ER. Fluorescence intensity profiles at the white line are shown below. Scale bars, 10 μm.

References

    1. Patterson GH, and Lippincott-Schwartz J. (2002) A photoactivatable GFP for selective photolabeling of proteins and cells. Science 297, 1873–1877. - PubMed
    1. Adam V, Berardozzi R, Byrdin M, and Bourgeois D. (2014) Phototransformable fluorescent proteins: Future challenges. Curr. Opin. Chem. Biol. 20, 92–102. - PubMed
    1. Cranfill PJ, Sell BR, Baird MA, Allen JR, Lavagnino Z, De Gruiter HM, Kremers GJ, Davidson MW, Ustione A, and Piston DW (2016) Quantitative assessment of fluorescent proteins. Nat. Methods 13, 557–562. - PMC - PubMed
    1. Suzuki T, Arai S, Takeuchi M, Sakurai C, Ebana H, Higashi T, Hashimoto H, Hatsuzawa K, and Wada I. (2012) Development of cysteine-free fluorescent proteins for the oxidative environment. PLoS One 7, e37551. - PMC - PubMed
    1. Snapp EL, Hegde RS, Francolini M, Lombardo F, Colombo S, Pedrazzini E, Borgese N, and Lippincott-Schwartz J. (2003) Formation of stacked ER cisternae by low affinity protein interactions. J. Cell Biol. 163, 257–269. - PMC - PubMed

Publication types