

A reference single-cell transcriptomic atlas of human skeletal muscle tissue reveals bifurcated muscle stem cell populations
- PMID: 32624006
- PMCID: PMC7336639
- DOI: 10.1186/s13395-020-00236-3
A reference single-cell transcriptomic atlas of human skeletal muscle tissue reveals bifurcated muscle stem cell populations
Abstract
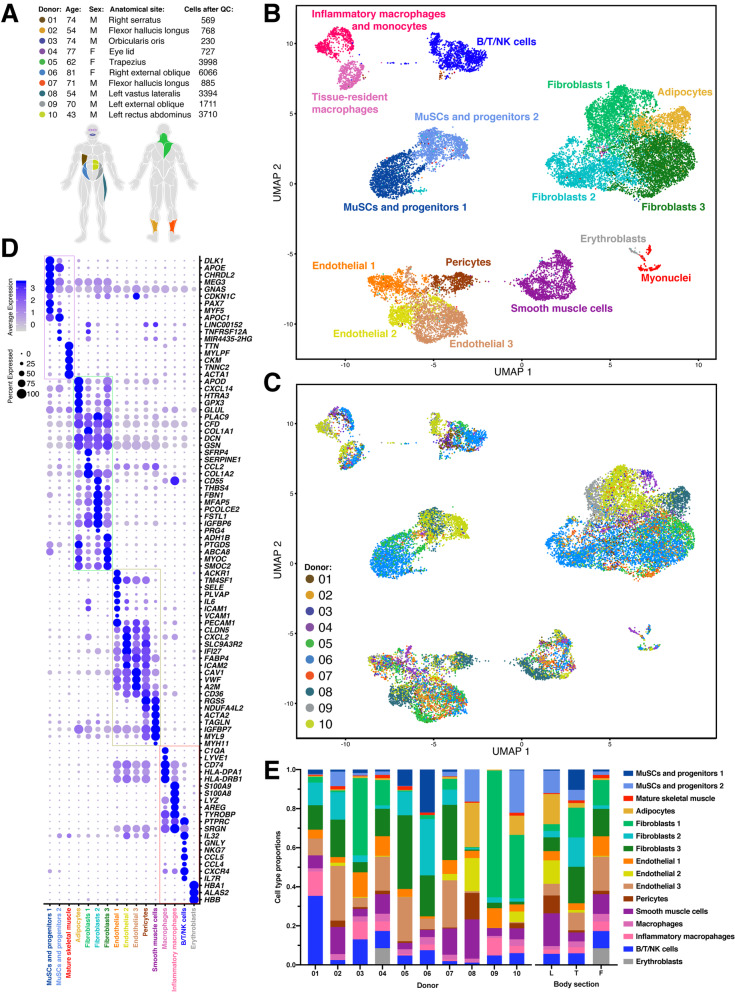
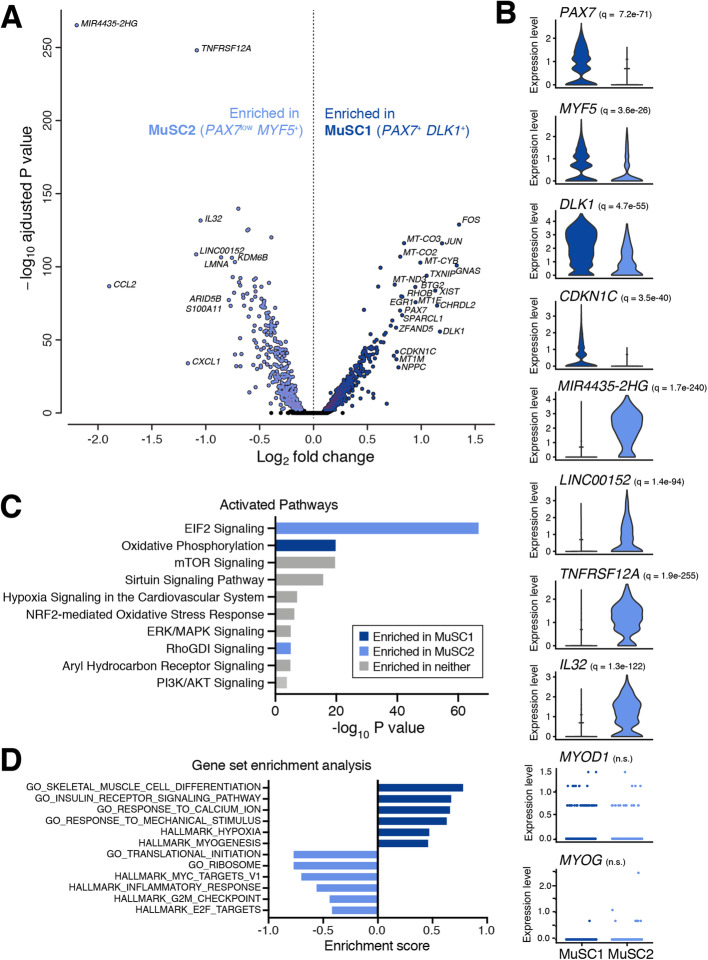
Single-cell RNA-sequencing (scRNA-seq) facilitates the unbiased reconstruction of multicellular tissue systems in health and disease. Here, we present a curated scRNA-seq dataset of human muscle samples from 10 adult donors with diverse anatomical locations. We integrated ~ 22,000 single-cell transcriptomes using Scanorama to account for technical and biological variation and resolved 16 distinct populations of muscle-resident cells using unsupervised clustering of the data compendium. These cell populations included muscle stem/progenitor cells (MuSCs), which bifurcated into discrete "quiescent" and "early-activated" MuSC subpopulations. Differential expression analysis identified transcriptional profiles altered in the activated MuSCs including genes associated with aging, obesity, diabetes, and impaired muscle regeneration, as well as long non-coding RNAs previously undescribed in human myogenic cells. Further, we modeled ligand-receptor cell-communication interactions and observed enrichment of the TWEAK-FN14 pathway in activated MuSCs, a characteristic signature of muscle wasting diseases. In contrast, the quiescent MuSCs have enhanced expression of the EGFR receptor, a recognized human MuSC marker. This work provides a new benchmark reference resource to examine human muscle tissue heterogeneity and identify potential targets in MuSC diversity and dysregulation in disease contexts.
Conflict of interest statement
The authors declare no conflicts of interest.
Figures

Similar articles
-
Single cell analysis of adult mouse skeletal muscle stem cells in homeostatic and regenerative conditions.Development. 2019 Apr 11;146(12):dev174177. doi: 10.1242/dev.174177. Development. 2019. PMID: 30890574 Free PMC article.
-
Transcriptional Profiling of Quiescent Muscle Stem Cells In Vivo.Cell Rep. 2017 Nov 14;21(7):1994-2004. doi: 10.1016/j.celrep.2017.10.037. Cell Rep. 2017. PMID: 29141228 Free PMC article.
-
Single-Cell Analysis of the Muscle Stem Cell Hierarchy Identifies Heterotypic Communication Signals Involved in Skeletal Muscle Regeneration.Cell Rep. 2020 Mar 10;30(10):3583-3595.e5. doi: 10.1016/j.celrep.2020.02.067. Cell Rep. 2020. PMID: 32160558 Free PMC article.
-
Controversies in TWEAK-Fn14 signaling in skeletal muscle atrophy and regeneration.Cell Mol Life Sci. 2020 Sep;77(17):3369-3381. doi: 10.1007/s00018-020-03495-x. Epub 2020 Mar 21. Cell Mol Life Sci. 2020. PMID: 32200423 Free PMC article. Review.
-
SMART approaches for genome-wide analyses of skeletal muscle stem and niche cells.Crit Rev Biochem Mol Biol. 2021 Jun;56(3):284-300. doi: 10.1080/10409238.2021.1908950. Epub 2021 Apr 7. Crit Rev Biochem Mol Biol. 2021. PMID: 33823731 Review.
Cited by
-
Regulation of RNA N6-methyladenosine modification and its emerging roles in skeletal muscle development.Int J Biol Sci. 2021 Apr 12;17(7):1682-1692. doi: 10.7150/ijbs.56251. eCollection 2021. Int J Biol Sci. 2021. PMID: 33994853 Free PMC article. Review.
-
Single nuclei transcriptomics of muscle reveals intra-muscular cell dynamics linked to dystrophin loss and rescue.Commun Biol. 2022 Sep 19;5(1):989. doi: 10.1038/s42003-022-03938-0. Commun Biol. 2022. PMID: 36123393 Free PMC article.
-
Novel insights from human induced pluripotent stem cells on origins and roles of fibro/adipogenic progenitors as heterotopic ossification precursors.Front Cell Dev Biol. 2024 Sep 2;12:1457344. doi: 10.3389/fcell.2024.1457344. eCollection 2024. Front Cell Dev Biol. 2024. PMID: 39286484 Free PMC article. Review.
-
A transcriptome atlas of leg muscles from healthy human volunteers reveals molecular and cellular signatures associated with muscle location.Elife. 2023 Feb 6;12:e80500. doi: 10.7554/eLife.80500. Elife. 2023. PMID: 36744868 Free PMC article.
-
Skeletal muscle methylome and transcriptome integration reveals profound sex differences related to muscle function and substrate metabolism.Clin Epigenetics. 2021 Nov 3;13(1):202. doi: 10.1186/s13148-021-01188-1. Clin Epigenetics. 2021. PMID: 34732242 Free PMC article.
References
Publication types
MeSH terms
Substances
Grants and funding
LinkOut - more resources
Full Text Sources
Other Literature Sources
Molecular Biology Databases
Research Materials
Miscellaneous
