Randomized Controlled Trial
. 2020 Jul;52(7):1048-1061.
doi: 10.1038/s12276-020-0459-0. Epub 2020 Jul 6.

Exercise training modulates the gut microbiota profile and impairs inflammatory signaling pathways in obese children

Affiliations
Randomized Controlled Trial

Exercise training modulates the gut microbiota profile and impairs inflammatory signaling pathways in obese children

Rocío Quiroga et al. Exp Mol Med. 2020 Jul.

Abstract

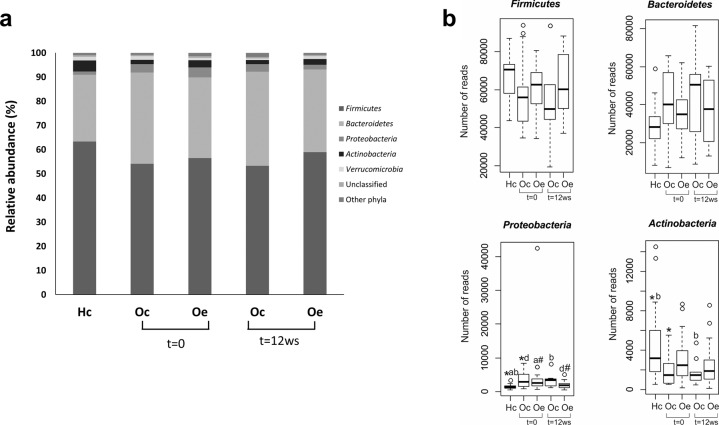
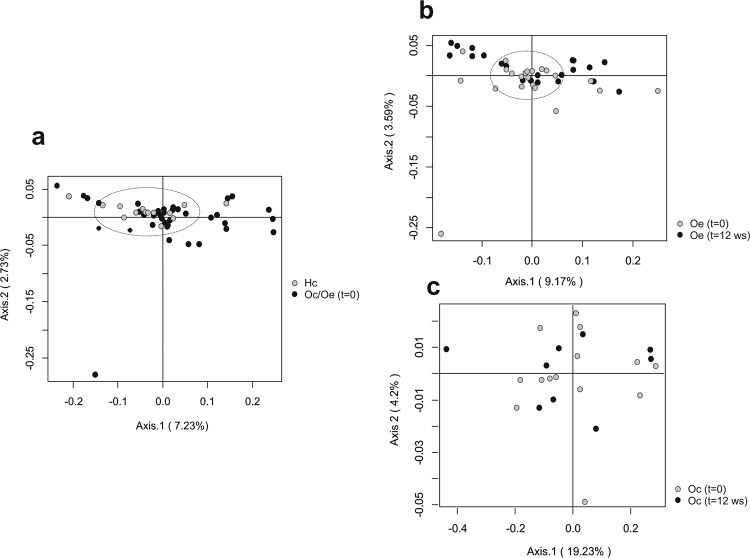
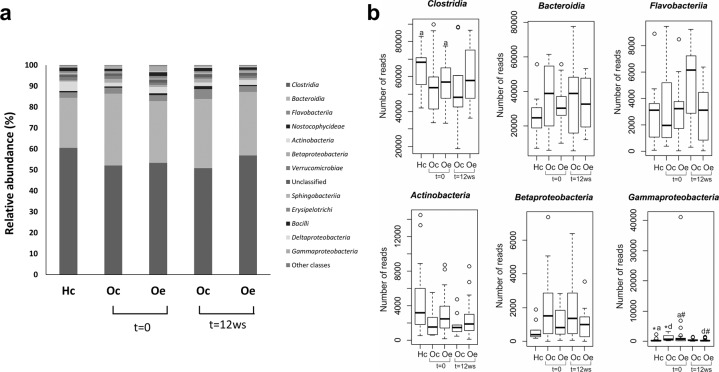
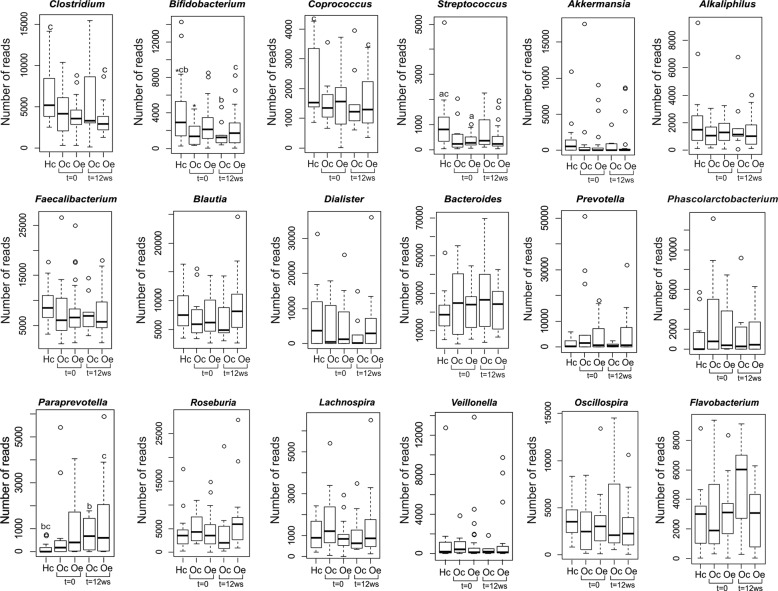
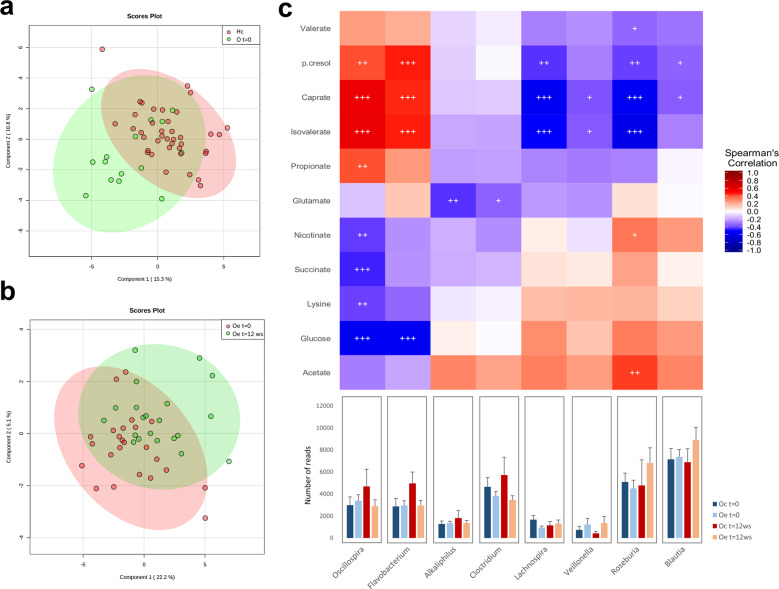
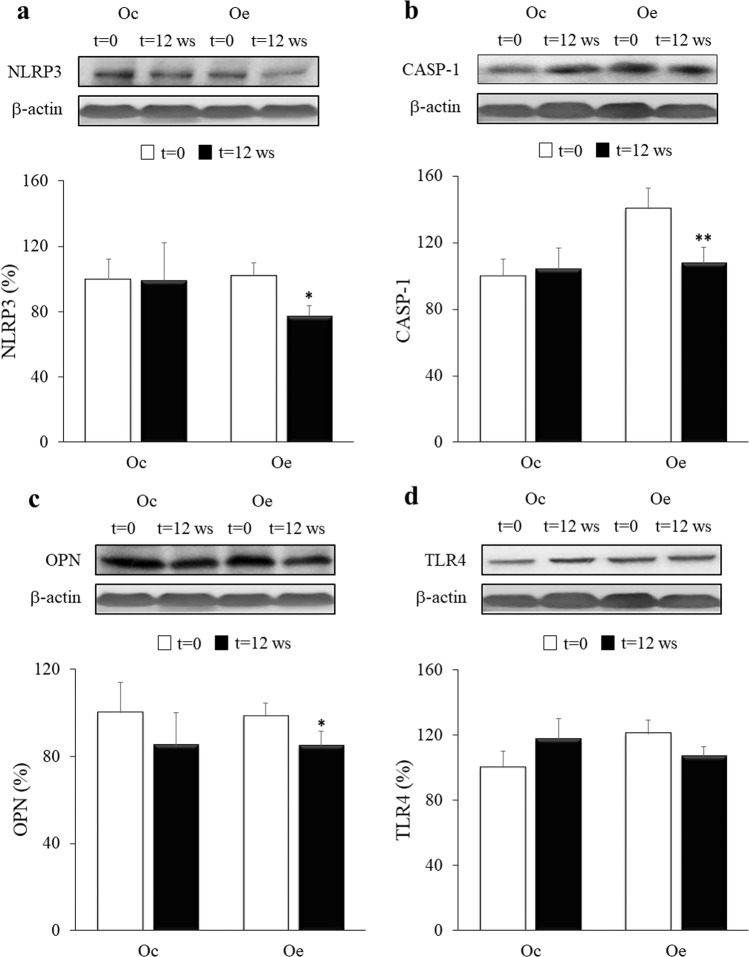
Childhood obesity has reached epidemic levels and is a serious health concern associated with metabolic syndrome, nonalcoholic fatty liver disease, and gut microbiota alterations. Physical exercise is known to counteract obesity progression and modulate the gut microbiota composition. This study aims to determine the effect of a 12-week strength and endurance combined training program on gut microbiota and inflammation in obese pediatric patients. Thirty-nine obese children were assigned randomly to the control or training group. Anthropometric and biochemical parameters, muscular strength, and inflammatory signaling pathways in mononuclear cells were evaluated. Bacterial composition and functionality were determined by massive sequencing and metabolomic analysis. Exercise reduced plasma glucose levels and increased dynamic strength in the upper and lower extremities compared with the obese control group. Metagenomic analysis revealed a bacterial composition associated with obesity, showing changes at the phylum, class, and genus levels. Exercise counteracted this profile, significantly reducing the Proteobacteria phylum and Gammaproteobacteria class. Moreover, physical activity tended to increase some genera, such as Blautia, Dialister, and Roseburia, leading to a microbiota profile similar to that of healthy children. Metabolomic analysis revealed changes in short-chain fatty acids, branched-chain amino acids, and several sugars in response to exercise, in correlation with a specific microbiota profile. Finally, the training protocol significantly inhibited the activation of the obesity-associated NLRP3 signaling pathway. Our data suggest the existence of an obesity-related deleterious microbiota profile that is positively modified by physical activity intervention. Exercise training could be considered an efficient nonpharmacological therapy, reducing inflammatory signaling pathways induced by obesity in children via microbiota modulation.


Conflict of interest statement

The authors declare that they have no conflict of interest.

Figures

Fig. 1
Fig. 1. Comparison of the phylotypes between healthy control children (Hc) and obese patients assigned randomly to a control (Oc) or a training (Oe) group at the beginning (t = 0) and at the end of the study (t = 12 weeks) at the phylum level.
a Bar graphs represent the relative abundance of the total population. b Box plot summarizing significant differences using the Kruskal–Wallis test followed by the Mann–Whitney U test (p < 0.05). *Hc vs Oc (t = 0), aHc vs Oe (t = 0), bHc vs Oc (t = 12 weeks), dOc (t = 0) vs Oe (t = 12 weeks), #Oe (t = 0) vs Oe (t = 12 weeks).
Fig. 2
Fig. 2. Principal coordinates analysis (PCoA) plot derived from the Morisita-Horn index at the phylum level.
The percentage of the total variance explained is indicated in parentheses in each axis. Dashed lines denote sample clusters according to obesity or exercise. a Comparison of bacterial communities between healthy control children (Hc) and obese patients (Oc and Oe) at the beginning of the study (t = 0). b Effect of exercise on the bacterial communities comparing trained obese patients (Oe, t = 12 weeks) with the corresponding group at the beginning of the study (Oe, t = 0). c PCoA comparing bacterial communities longitudinally in obese control patients (Oc, t = 0, t = 12 weeks).
Fig. 3
Fig. 3. Gut microbiota composition at the class level.
a Bar graphs representing the bacterial community composition in healthy controls (Hc) and obese patients randomly assigned to a control (Oc) or a training (Oe) group. b Box plot showing the significant differences at the class level using the Kruskal–Wallis test followed by the Mann–Whitney U test (p < 0.05). *Hc vs Oc (t = 0), aHc vs Oe (t = 0), dOc (t = 0) vs Oe (t = 12 weeks), #Oe (t = 0) vs Oe (t = 12 weeks).
Fig. 4
Fig. 4. Box plots represent the differences at the genus level among heathy control children (Hc), obese control patients (Oc) and trained obese patients (Oe) at the beginning (t = 0) and at the end of the study (t = 12 weeks) using the Kruskal–Wallis test followed by the Mann–Whitney U test (p < 0.05).
*Hc vs Oc (t = 0), aHc vs Oe (t = 0), bHc vs Oc (t = 12 weeks), cHc vs Oe (t = 12 weeks).
Fig. 5
Fig. 5. Relationship between fecal microbiota composition and metabolic profile.
a Partial least squares-discriminant analysis (PLS-DA) of metabolites from healthy control children (Hc) and obese patients (O) at the beginning of the study. b PLS-DA showing the exercise performance effect on the metabolic profile in pediatric obese patients. Colored ellipses represent the 95% confidence range for the indicated experimental group. The explained variance of each component is shown in parentheses on the corresponding axis. c Heat map of the correlations between fecal bacterial populations at the genus and metabolite levels considering the results obtained longitudinally in all groups. Each square represents the Spearman’s correlation coefficient (p < 0.05). Red and blue cells specify positive and negative correlations. p values are corrected for multiple comparisons based on the false discovery rate (FDR).
Fig. 6
Fig. 6. Effects of the combined strength and endurance training on NLRP3, OPN, CASP-1, and TLR4 expression.
Densitometric quantification and representative western blots of NLRP3, OPN, CASP-1, and TLR4 in response to 12 weeks of combined resistance and endurance training for Oe and the same period of normal daily routines for Oc. Protein from PBMCs was separated by sodium dodecyl sulfate-polyacrylamide gel electrophoresis, followed by immunoblotting. Equal loading of proteins is illustrated by β-actin bands. Values are presented as the mean and standard error of the mean (SEM). *p < 0.05; **p < 0.01 vs Oe (t = 0).

References

    1. Bleich SN, et al. Interventions to prevent global childhood overweight and obesity: a systematic review. Lancet Diabetes Endocrinol. 2018;6:332–346. - PubMed
    1. Güngör NK. Overweight and obesity in children and adolescents. J. Clin. Res. Pediatr. Endocrinol. 2014;6:129–143. - PMC - PubMed
    1. Llewellyn A, Simmonds M, Owen CG, Woolacott N. Childhood obesity as a predictor of morbidity in adulthood: A systematic review and meta-analysis. Obes. Rev. 2016;17:56–67. - PubMed
    1. Turnbaugh PJ, et al. A core gut microbiome in obese and lean twins. Nature. 2009;457:480–484. - PMC - PubMed
    1. Ley RE, Turnbaugh PJ, Klein S, Gordon JI. Microbial ecology: human gut microbes associated with obesity. Nature. 2006;444:1022–1023. - PubMed

Publication types