. 2020 Jun 18:11:1191.
doi: 10.3389/fimmu.2020.01191. eCollection 2020.

Glioblastoma Myeloid-Derived Suppressor Cell Subsets Express Differential Macrophage Migration Inhibitory Factor Receptor Profiles That Can Be Targeted to Reduce Immune Suppression

Affiliations

Glioblastoma Myeloid-Derived Suppressor Cell Subsets Express Differential Macrophage Migration Inhibitory Factor Receptor Profiles That Can Be Targeted to Reduce Immune Suppression

Tyler J Alban et al. Front Immunol. .

Abstract

The application of tumor immunotherapy to glioblastoma (GBM) is limited by an unprecedented degree of immune suppression due to factors that include high numbers of immune suppressive myeloid cells, the blood brain barrier, and T cell sequestration to the bone marrow. We previously identified an increase in immune suppressive myeloid-derived suppressor cells (MDSCs) in GBM patients, which correlated with poor prognosis and was dependent on macrophage migration inhibitory factor (MIF). Here we examine the MIF signaling axis in detail in murine MDSC models, GBM-educated MDSCs and human GBM. We found that the monocytic subset of MDSCs (M-MDSCs) expressed high levels of the MIF cognate receptor CD74 and was localized in the tumor microenvironment. In contrast, granulocytic MDSCs (G-MDSCs) expressed high levels of the MIF non-cognate receptor CXCR2 and showed minimal accumulation in the tumor microenvironment. Furthermore, targeting M-MDSCs with Ibudilast, a brain penetrant MIF-CD74 interaction inhibitor, reduced MDSC function and enhanced CD8 T cell activity in the tumor microenvironment. These findings demonstrate the MDSC subsets differentially express MIF receptors and may be leveraged for specific MDSC targeting.

Keywords: MDSC; MIF–macrophage migration inhibitory factor; glioma; immunesuppresion; immunetherapy.


Figures

Figure 1
Figure 1
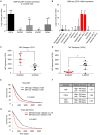
Glioma educated MDSCS can be generated in vitro. MDSCs are induced using freshly isolated bone marrow cultured with 50:50 mix of fresh media and conditioned media from a 24-h culture of GL261 cells with the addition of IL-13 and GM-CSF over 3 days (A). M-MDSCs were gated by Live/CD45+/CD11b+/CD68/MHC/Ly6C+/Ly6G while G-MDSCs were gated by Live/CD45+/CD11b+/CD68/MHC/Ly6C+/Ly6G+. Co-cultured MDSCs from n = 6 mice were generated over 3 days and then isolated by magnetic bead sorting and subsequently used for T cell suppression assay where the controls were T cells alone unstimulated without CD3/CD28 activation beads and T cells with CD3/CD28 activation beads (B). FACs sorting of M-MDSCs and G-MDSCs from 3 day old co-cultures of n = 3 mice was used to isolate RNA and perform qPCR for Arginase (Arg1), Nitric oxide synthase (iNOS), and Ly6G (C). Two-Tailed T-Test was performed for comparisons in (B,C) *<0.05, **<0.01, ***<0.001.
Figure 2
Figure 2
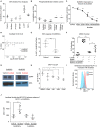
Murine M-MDSCs express the MIF receptor CD74. n = 10 mice were intracranially injected with the syngeneic mouse glioma cell line GL261 at day 0 and then at Day 18 post injection the tumor bearing and non-tumor bearing hemispheres were resected, dissociated, and analyzed by flow cytometry (A). M-MDSCs Live/CD45+/CD11b+/CD68/P2Ry12 − /MHC/Ly6C+/Ly6G, and G-MDSCs Live/CD45+/CD11b+/CD68/P2Ry12 − /MHC/Ly6C+/Ly6G+. n = 3 mice were used for co-culture induction of MDSCs and at day 3 M-MDSCs and G-MDSCs were analyzed for the MIF receptors CD74, CD44, CXCR2 CXCR4, and CXCR7 by flow cytometry and gated for the % positive in each group (B, C). FACs sorting of G-MDSCs and M-MDSCs from co-cultures of n = 3 mice were performed and then RNA isolated for qPCR analysis of the expression of MIF receptors (CXCR2, and CD74) as well as MCP-1, the CD74 downstream activation product (D). CD74 expression was assessed by flow cytometry using flow cytometry staining of co-cultures where the histogram demonstrates the expression level of CD74 on M-MDSCs compared to G-MDSCs (E). Quantification of n = 3 co-culture derived M-MDSCs and G-MDSCs CD74 Mean Fluorescence intensity shows higher levels of CD74 on M-MDSCs (F). Intracellular staining post permiablization of the same cohort of M-MDSCs and G-MDSs from (F) shows that CD74 levels were not significantly different when staining internally (G). In vivo, the tumor bearing mice that were evaluated for MDSC levels in (A) were also evaluated for CD74 expression on the surface of M-MDSCS, G-MDSCS and Microglia (H). Two-Tailed T-Test was performed for comparisons in (A, D, F, G, H). *<0.05, **<0.01, ***<0.001.
Figure 3
Figure 3
Human derived M-MDSCs express the MIF receptor CD74. Data mining of the GBM-seq database from Darmanis et al. (51), was used to analyze the myeloid cell expression of the MIF receptors CD74, CXCR2, CXCR4, CXCR7 and CD44 showing that CD74 expressed by the myeloid populations in GBM tumor single cell sequencing (A). Further analysis was performed separating the single cell populations into the previously published cell identities (B). Using a previously published cohort of GBM patient tumors (20) n = 8 GBM patients the MIF receptors CD74 and CXCR2 were assessed on M-MDSCs and G-MDSCs (M-MDSCs: CD11b+/HLADR/CD33+/CD14+/CD15, G-MDSCs: CD11b+/HLADR/CD33+/CD14/CD15+) (C,D). TCGA data analysis of GBMLGG cohort identified MIF expression and CD74 expression levels correlating with survival with a similar hazard ratio (HR) (E,F). When a signature for both MIF and CD74 is created where samples that were above the median for both MIF and CD74 expression compared to those below the median for both MIF and CD74 further separates survival (F,G). Two-Tailed T-Test was performed for comparisons in (A,C,D) *<0.05, **<0.01, ***<0.001. Survival curve analysis was performed in GraphPad Prism using Log-rank (Mantel-Cox) test for p-value and hazard ratio log rank was computed on the same data using GraphPad Prism.
Figure 4
Figure 4
Ibudilast inhibits the MIF disrupting M-MDSC generation in vitro. Utilizing the co-culture system described in Figure 1 MIF inhibitors were assessed for their ability to inhibit MDSC generation (A). Inhibitors were added at 200 μM at day 0 during the co-culture initiation and then assessed at day 3 for the % of M-MDSCs of CD45+ cells (A) n = 6 mice from n = 2 separate experiments. As a control for Ibudilast off target effects on phosphodiesterase Ibudilast was directly compared to Rolipram at 100 and 200 μM doses n = 6 control and Ibudilast treated co-cultures from n = 6 mice and n = 3 Rolipram treated co-cultures (B). n = 3 mice per co-culture were used and ibudilast evaluated at 10, 20, 50, 100, and 200 μM and then assessed by flow cytometry at day 3 (C). To determine if ibudilast was killing the M-MDSCs or G-MDSCs we isolated M-MDSCs and G-MDSCs from untreated co-cultures at day 3 from n = 3 mice by FACs sorting and then treated them for 24 h with Ibudilast as an IC50 using celltiterglo as a readout for viability (D). Flow cytometry Ki67 staining of M-MDSCs at day 4 post treatment from co-culture generation in n = 6 biological replicates (E). Shows The function of MDSCs treated with ibudilast was assessed by generating MDSCs in the presence of ibudilast and then magnetically sorting for MDSCs comparing untreated and Ibudilast treated MDSCs (F). To assess the disruption of the MIF/CD74 signaling mechanism M-MDSCs and G-MDSCs were FACs sorted from day 3 co-cultures and then subsequently 50 ng/ml MIF was added to each well containing 500,000 cells and then treated with Ibudilast at 200 μM for 24 h prior to lysing the cells and performing western blot analysis for pERK and total ERK (G). MCP-1 ELISA was performed on conditioned media from Co-cultures at day 4 post initiation, treated with Ibudilast ranging from 0 to 10 μM, n = 3 biological replicates. (H) Representative MCP-1 levels, y-axis normalized to mode and graphed in FlowJo using histogram plot comparing vehicle and Ibudilast treated M-MDSCs from co-cultures treated with 200 μM Ibudilast at day 4. (I) Quantification of n = 6 replicates from the experiment performed in (H), briefly, live M-MDSCs and G-MDSCs were gated and then the mean fluorescent intensity of internally stained MCP-1 was measured and graphed for each replicate. T between Two-Tailed T-Test was performed for comparisons in (A,B,D,E,H,J) *<0.05, **<0.01, ***<0.001.
Figure 5
Figure 5
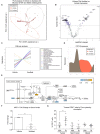
Ibudilast inhibits the MIF disrupting M-MDSC generation in vitro. n = 6 vehicle and n = 6 Ibudilast treated mice (50 mg/kg 2x weekly starting day 5 post tumor implantation) were sacrificed at endpoint and tumors were dissected from the brain for RNA isolation. RNA from isolated tumors of vehicle and ibudilast treated mice was analyzed via Nanostring murine myeloid panel and PCA was performed showing separation of ibudilast vs vehicle (A). Volcano plot comparing log2fold change in genes between Ibudilast and vehicle demonstrates significant changes in the myeloid populations between vehicle and ibudilast treated tumors (B). Pathway analysis of Ibudilast treated tumors shows increased activation of many immune pathways including lymphocyte activation while there is a reduction in antigen presentation (C). Summary of CD74 expression in histogram format comparing all Vehicle and all Ibudilast treated samples (D). Pathway analysis of Nanostring data identifies the MAPK signaling pathway in Ibudilast treated tumors with a reduction in MEK2 (E). n = 3 mice treated with vehicle of 50 mg/kg 2x per week Ibudilast were sacrificed at day 18 post tumor initiation and serum was isolated from their blood and measured MCP-1 by ELISA (F). A cohort of n = 8 vehicle and n = 8 Ibudilast treated mice were sacrificed at day 18 post injection and tumor, non-tumor tissue, and blood were analyzed by flow cytometry for immune populations where CD8 T cells were shown to be significantly increased in the tumors of Ibudilast treated mice (G). Two-Tailed T-Test was performed for comparisons in (F) * <0.05, ** <0.01, *** <0.001. All other statistics were performed in Nanostring Nsolver software including the PCA and volcano plot differential gene expression and pathway analysis.
Figure 6
Figure 6
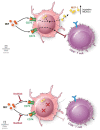
Schematic depicting pathway described where MIF binds CD74 on M-MDSCs enhancing their activity to inhibit CD8 T cells and also produce the downstream target MCP-1. With the addition of Ibudilast to inhibit this process we show a reduction of the MDSCs generation and function removing the inhibitor effect from CD8 T cells.

References

    1. McGirt MJ, Chaichana KL, Gathinji M, Attenello FJ, Than K, Olivi A, et al. . Independent association of extent of resection with survival in patients with malignant brain astrocytoma. J Neurosurg. (2009) 110:156–62. 10.3171/2008.4.17536 - DOI - PubMed
    1. Stupp R, Hegi ME, Mason WP, van den Bent MJ, Taphoorn MJ, Janzer RC, et al. Effects of radiotherapy with concomitant and adjuvant temozolomide versus radiotherapy alone on survival in glioblastoma in a randomised phase III study: 5-year analysis of the EORTC-NCIC trial. Lancet Oncol. (2009) 10:459–66. 10.1016/S1470-20450970025-7 - DOI - PubMed
    1. Fecci PE, Mitchell DA, Whitesides JF, Xie W, Friedman AH, Archer GE, et al. . Increased regulatory T-cell fraction amidst a diminished CD4 compartment explains cellular immune defects in patients with malignant glioma. Cancer Res. (2006) 66:3294–302. 10.1158/0008-5472.CAN-05-3773 - DOI - PubMed
    1. Jacobs JF, Idema AJ, Bol KF, Nierkens S, Grauer OM, Wesseling P, et al. . Regulatory T cells and the PD-L1/PD-1 pathway mediate immune suppression in malignant human brain tumors. Neuro-oncology. (2009) 11:394–402. 10.1215/15228517-2008-104 - DOI - PMC - PubMed
    1. Lewis CE Pollard JW. Distinct role of macrophages in different tumor microenvironments. Cancer Res. (2006) 66:605–12. 10.1158/0008-5472.CAN-05-4005 - DOI - PubMed

Publication types

MeSH terms

Substances