
Abstract

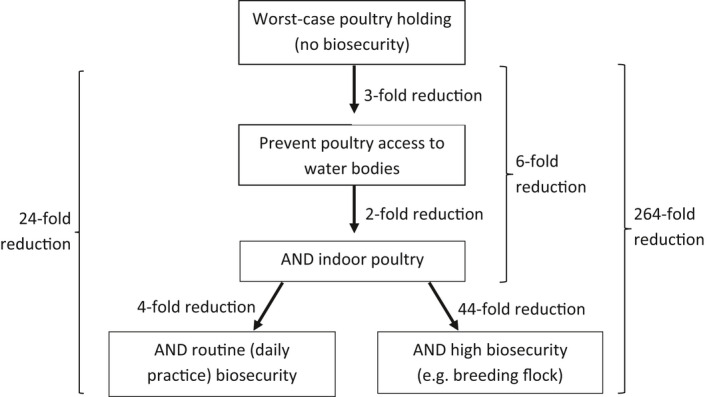
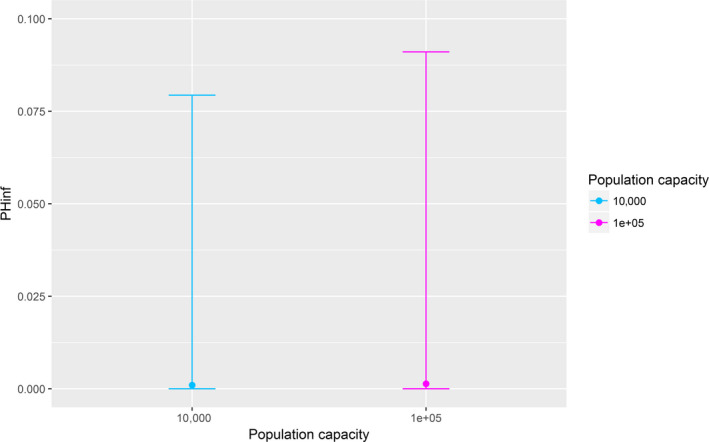
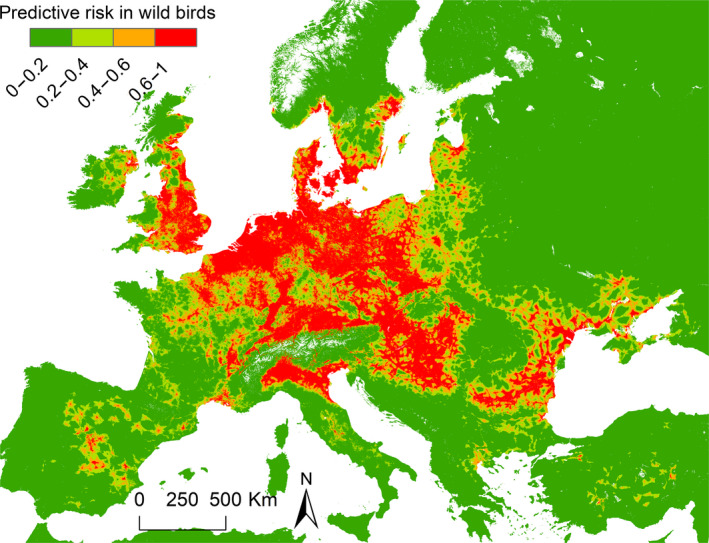
Previous introductions of highly pathogenic avian influenza virus (HPAIV) to the EU were most likely via migratory wild birds. A mathematical model has been developed which indicated that virus amplification and spread may take place when wild bird populations of sufficient size within EU become infected. Low pathogenic avian influenza virus (LPAIV) may reach similar maximum prevalence levels in wild bird populations to HPAIV but the risk of LPAIV infection of a poultry holding was estimated to be lower than that of HPAIV. Only few non-wild bird pathways were identified having a non-negligible risk of AI introduction. The transmission rate between animals within a flock is assessed to be higher for HPAIV than LPAIV. In very few cases, it could be proven that HPAI outbreaks were caused by intrinsic mutation of LPAIV to HPAIV but current knowledge does not allow a prediction as to if, and when this could occur. In gallinaceous poultry, passive surveillance through notification of suspicious clinical signs/mortality was identified as the most effective method for early detection of HPAI outbreaks. For effective surveillance in anseriform poultry, passive surveillance through notification of suspicious clinical signs/mortality needs to be accompanied by serological surveillance and/or a virological surveillance programme of birds found dead (bucket sampling). Serosurveillance is unfit for early warning of LPAI outbreaks at the individual holding level but could be effective in tracing clusters of LPAIV-infected holdings. In wild birds, passive surveillance is an appropriate method for HPAIV surveillance if the HPAIV infections are associated with mortality whereas active wild bird surveillance has a very low efficiency for detecting HPAIV. Experts estimated and emphasised the effect of implementing specific biosecurity measures on reducing the probability of AIV entering into a poultry holding. Human diligence is pivotal to select, implement and maintain specific, effective biosecurity measures.

Keywords: avian influenza; biosecurity; introduction; mutagenesis; spread; surveillance; zoning.


Figures

Figure 1
Figure 1
World‐wide distribution of influenza HPAI H5 and H7 subtypes and clades in domestic birds, wild birds and humans (1 January 2016–31 August 2017)
Figure 2
Figure 2
Map of the borders where migratory wild birds enter the EU via the four entry routes considered in this opinion
Figure 3
Figure 3
Proposed entry pathways of HPAI viruses belonging to clades 2.3.2.1c, 2.2.1.2 and 2.3.4.4 into the EU via migratory wild birds
  1. Bold lines, quantitative assessment; thin lines, qualitative assessment.

Figure 4
Figure 4
Proposed entry pathways of HPAI viruses from migratory water birds into a poultry holding
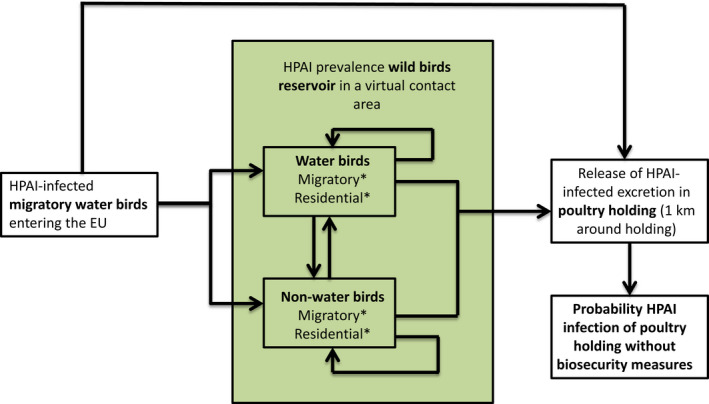
  1. The white fields represent components of the model based on real field situations, whereas the green fields represent components based on theoretical scenarios.

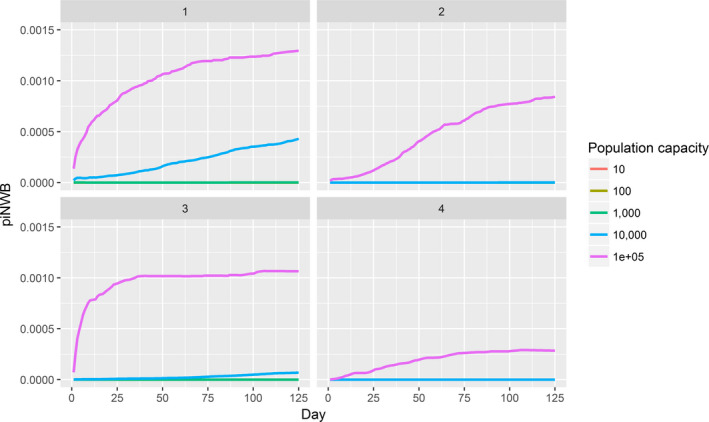
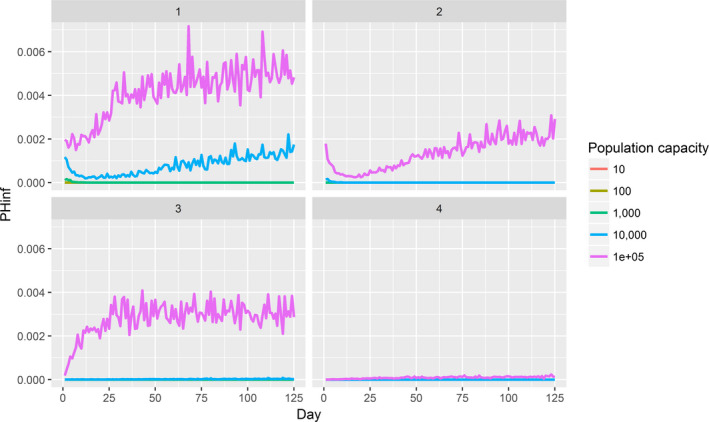
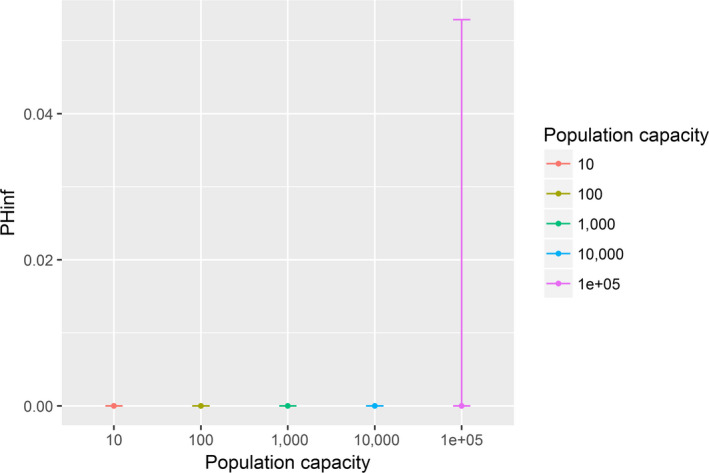
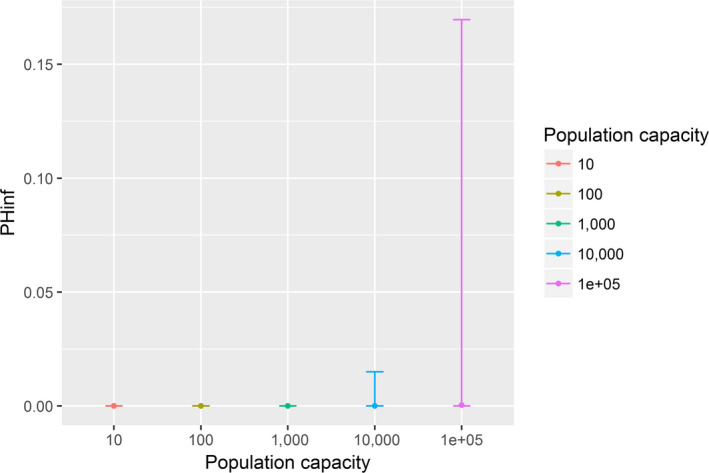
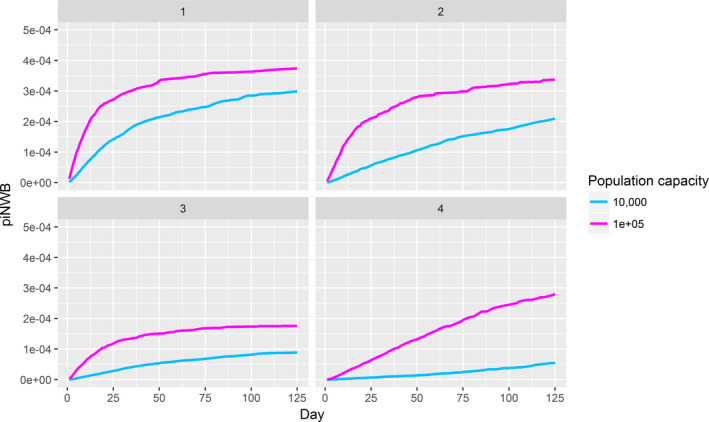
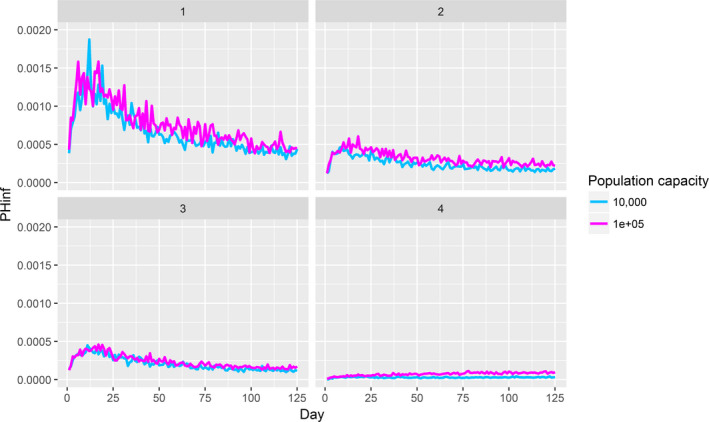
  2. *Four scenarios are considered with respect to proportion of migratory/resident wild birds and proportion of water/non‐water birds (see Table 5).

Figure 5
Figure 5
Modelled HPAI clade 2.3.4.4 worst‐case prevalence (95th percentile) in wild water birds (piWB) after entry of infected wild water birds at day 1 of the migration season. Different population sizes (10–100,000) and scenarios 1–4 are presented. Scenario 1: 90% water birds, 90% migratory birds; scenario 2: 10% water birds, 90% migratory birds; scenario 3: 90% water birds, 10% migratory birds; scenario 4: 10% water birds, 10% migratory birds
Figure 6
Figure 6
Seasonal probability (median (lower bar) – 95th percentile (upper bar)) of a poultry holding without biosecurity becoming infected with HPAIV clade 2.3.4.4 via wild birds over the entire migratory season, when this holding is located in an area where 10–105 wild birds are present (consisting of 90% migratory birds, 90% water birds; scenario 1)
Figure 7
Figure 7
Based on median value of probability that holdings will become infected with HPAI clade 2.3.4.4 given the exposure to 100 infected wild bird, fold reductions were calculated for increasing level of biosecurity
Figure 8
Figure 8
Modelled LPAI 95th percentile prevalence in wild water birds (piWB) after entry of infected wild water birds at day 1 of the migration season. Different population sizes (10,000 and 100,000) and scenarios 1–4 are presented. Scenario 1: 0.06 prevalence in infected entering water birds; scenario 2: 0.02 prevalence in infected entering water birds; scenario 3: 0.02 prevalence in entering infected water birds and 50% immune population; scenario 4: 0.002 prevalence in infected entering water birds
Figure 9
Figure 9
Seasonal probability (median (square) – 95th percentile (upper bar)) of a poultry holding without biosecurity becoming infected with LPAI via wild birds over the entire considered period (125 days), when this holding is located in an area where 10,000–105 naïve wild birds are present (consisting of 90% entering birds, 90% water birds; scenario 1)
Figure 10
Figure 10
HPAI virus detected in Anseriformes and game birds during the 2016/2017 H5 HPAI (clade 2.3.4.4b) epizootic
Figure 11
Figure 11
Active serological surveillance in duck and geese holdings samples between 2014 and 2016
Figure 12
Figure 12
Active serological surveillance in game bird holdings samples between 2014 and 2016
Figure 13
Figure 13
Relative risk map of predicted highly pathogenic avian influenza (HPAI) H5 occurrences in wild birds in Europe based on wild bird events reported in Europe between 2005 and 2017, and using the methodology as described in Si et al., (see Section 2.7)
Figure C.1
Figure C.1
Schematic overview of the model inputs, components and outputs
Figure E.1
Figure E.1
Probability of clade 2.3.4.4 HPAIV introduction into the EU via migratory wild birds
Figure E.2
Figure E.2
Modelled HPAI clade 2.3.4.4 prevalence (95th percentile) in wild water birds (piWB) after entry of infected wild water birds at day 60 of the migration season. Different population capacities (10–100,000) and scenarios (1–4, see definition in Table 5 in Section 3.2.2) are presented
Figure E.3
Figure E.3
Modelled HPAI clade 2.3.4.4 prevalence (95th percentile) in wild non‐water birds after entry of infected wild water birds at day 1 of the migration season. Different population capacities (10–100,000) and scenarios (1–4, see definition in Table 5 in Section 3.2.2) are presented
Figure E.4
Figure E.4
Daily probability (95th percentile) of a poultry holding without biosecurity to become infected with HPAI clade 2.3.4.4 after entry of infected wild birds at day 1 of the migration season. Different population sizes (10–100,000) and scenarios (1–4, see definition in Table 1) are presented
Figure E.5
Figure E.5
Sensitivity analysis on the seasonal probability that a poultry holding without biosecurity becomes infected after entry of infected wild birds at day 1 of the migration season, for the four scenarios (as defined in Table 5 in Section 3.2.2). A wild bird population capacity of 100,000 birds is considered
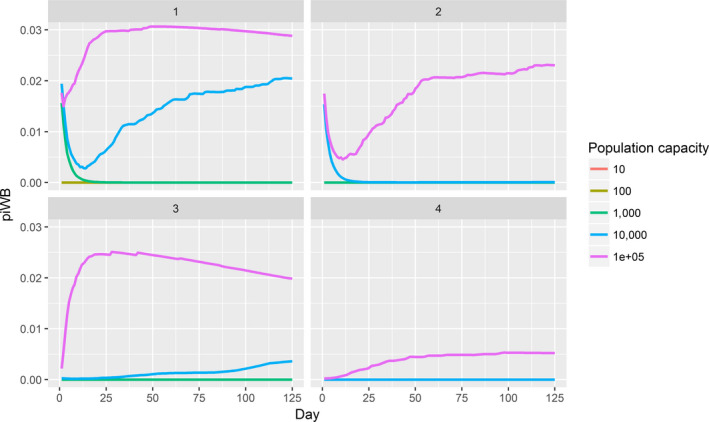
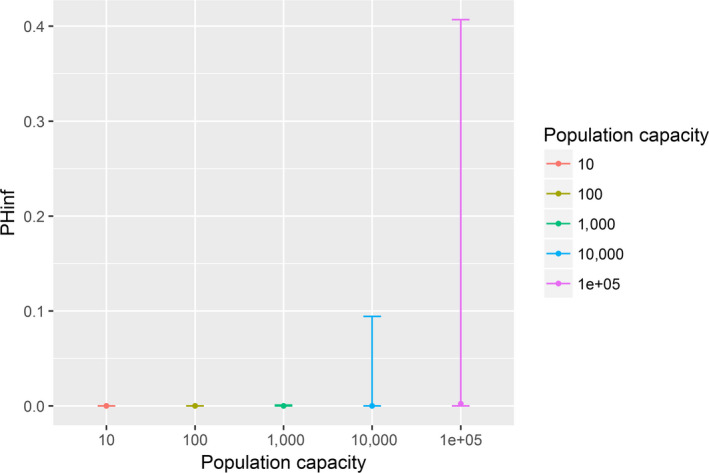
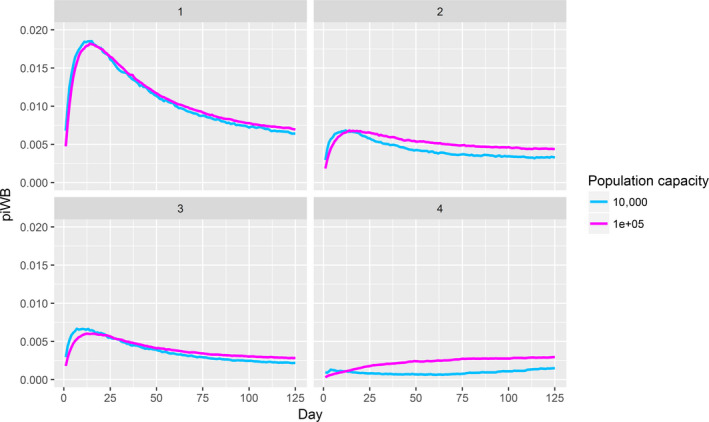
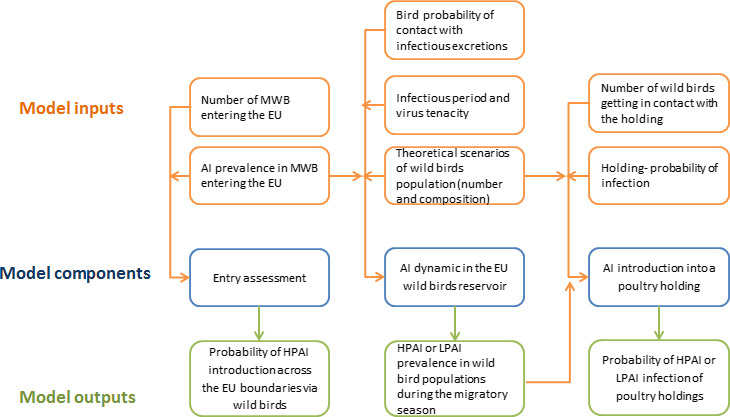
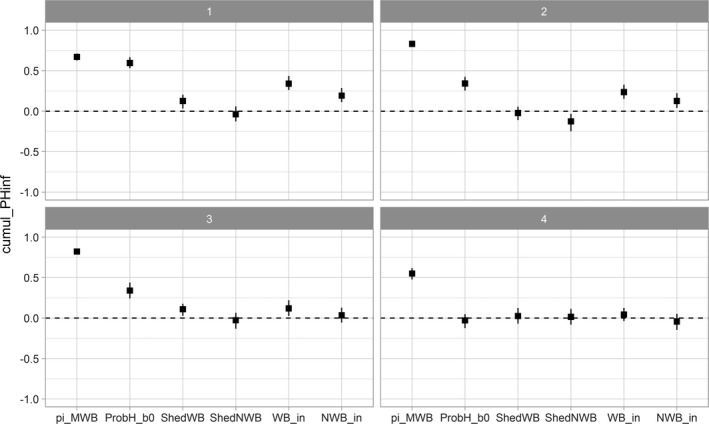
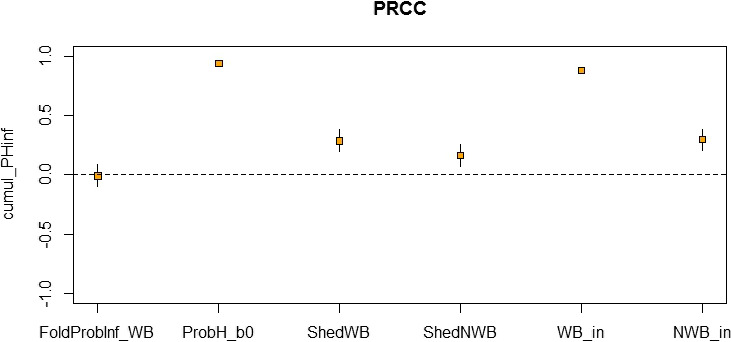
  1. pi_MWB, prevalence of migratory infected water birds; ProbH_b0, probability that a poultry holding is infected due to the presence of infected wild birds; ShedWB, shedding period for water birds; ShedNWB, shedding period for non‐water birds; WG_in, number of water birds present in the holding premise; NWB_in, number of non‐water birds present in the holding premise.

Figure E.6
Figure E.6
Probability of a poultry holding without implementing biosecurity becoming infected with HPAIV clade 2.2.1.2 via wild birds over the entire migratory season, when this holding is located in an area where 10–105 wild birds are present (consisting of 90% migratory birds, 90% water birds; scenario 1)
Figure E.7
Figure E.7
Probability of a poultry holding without implementing biosecurity becoming infected with HPAIV clade 2.3.2.1c via wild birds over the entire migratory season, when this holding is located in an area where 10–105 wild birds are present (consisting of 90% migratory birds, 90% water birds; scenario 1)
Figure E.8
Figure E.8
Modelled LPAI 95th percentile prevalence in wild non‐water birds. Different population capacities (10,000 and 100,000) and scenarios (1–4, see definition in Table 7 in Section 3.3.2) are presented
Figure E.9
Figure E.9
Daily probability (95th percentile) of a poultry holding without biosecurity to become infected with LPAI after entry of infected wild birds. Different population sizes (10–100,000) and scenarios (1–4, see definition in Table 7 in Section 3.3.2) are presented
Figure E.10
Figure E.10
Sensitivity analysis on the seasonal probability that a poultry holding without biosecurity becomes LPAI infected after entry of infected wild birds. A wild bird population capacity of 100,000 and a prevalence of infected entering water birds of 0.6% birds are considered
Figure H.1
Figure H.1
Phylogenetic tree constructed by Bayesian analysis of the H5 haemagglutinin gene segment of avian influenza viruses A collected in Europe, Asia, Africa and Oceania. Posterior probability values (expressed as a percentage) of the main clusters identified are indicated above the nodes (iTOL, 2016)
Figure H.2
Figure H.2
Phylogenetic tree constructed by Bayesian analysis of the H5 haemagglutinin gene segment of avian influenza viruses A collected in the Americas. Posterior probability values (expressed as a percentage) of the main clusters identified are indicated above the nodes (iTOL, 2016)
Figure H.3
Figure H.3
Phylogenetic tree constructed by Bayesian analysis of the H7 haemagglutinin gene segment of avian influenza viruses A collected in Europe, Asia, Africa and Oceania. Human and environmental samples are identified in L1 by a white band. Posterior probability values (expressed as a percentage) of the main clusters identified are indicated above the nodes (iTOL, 2016)
Figure H.4
Figure H.4
Phylogenetic tree constructed by Bayesian analysis of the H7 haemagglutinin gene segment of avian influenza viruses A collected in the Americas. Posterior probability values (expressed as a percentage) of the main clusters identified are indicated above the nodes (iTOL, 2016)
Figure I.1
Figure I.1
Duck and geese production by region reported by MSs to EFSA (autumn 2016) (taken from EFSA, ECDC, EURL, 2017a, 2017b)
Figure I.2
Figure I.2
Game bird production by region reported by MSs to EFSA (autumn 2016) (taken from EFSA, ECDC, EURL, 2017a, 2017b)
Figure I.3
Figure I.3
Breeding duck serological surveillance sampling and regions with positive holdings detected, 2014–2016
Figure I.4
Figure I.4
Breeding goose serological surveillance sampling and regions with positive holdings detected, 2014–2016
Figure I.5
Figure I.5
Fattening duck serological surveillance sampling and regions with positive holdings detected, 2014–2016
Figure I.6
Figure I.6
Fattening goose serological surveillance sampling and regions with positive holdings detected, 2014–2016
Figure I.7
Figure I.7
Game bird (Anseriformes) serological surveillance sampling and regions with positive holdings detected, 2014–2016
Figure I.8
Figure I.8
Game bird (Gallinaceous) serological surveillance sampling and regions with positive holdings detected, 2014–2016
Figure I.9
Figure I.9
Map showing intensity of serological surveillance activity in farmed anseriforme poultry and all game birds between 2014 and 2016
Figure I.10
Figure I.10
Map showing regions with holdings showing prior exposure to AI in farmed anseriforme poultry and all game birds, 2014–2016
Figure J.1
Figure J.1
Example average ranking of biosecurity measures calculated from the individual rankings of the 10 experts (panel A) and example of deviation of the individual versus the average judgements (panel B)
Figure J.2
Figure J.2
Average ranking of biosecurity measures applicable in a commercial chicken holding with only indoor housing (the letter IDs are explained in Table J.1)
Figure J.3
Figure J.3
Average ranking of biosecurity measures applicable in a commercial chicken holding with outdoor access (the letter IDs are explained in Table J.1)
Figure J.4
Figure J.4
Average ranking of biosecurity measures applicable in a non‐commercial poultry holding (backyard) (the letter IDs are explained in Table J.1)

References

    1. Abdelwhab EM, Grund C, Aly MM, Beer M, Harder TC and Hafez HM, 2012. Influence of maternal immunity on vaccine efficacy and susceptibility of one day old chicks against Egyptian highly pathogenic avian influenza H5N1. Veterinary Microbiology, 155, 13–20. - PubMed
    1. Abdelwhab EM, Veits J and Mettenleiter TC, 2013. Avian influenza virus NS1 A small protein with diverse and versatile functions. Virulence, 4, 583–588. - PMC - PubMed
    1. Abdelwhab EM, Veits J and Mettenleiter TC, 2014. Prevalence and control of H7 avian influenza viruses in birds and humans. Epidemiology and Infection, 142, 896–920. - PMC - PubMed
    1. Abdelwhab EM and Abdel‐Moneim AS, 2015. Epidemiology, ecology and gene pool of influenza A virus in Egypt: will Egypt be the epicentre of the next influenza pandemic? Virulence, 6, 6–18. - PMC - PubMed
    1. Abdelwhab EM, Hassan MK, Abdel‐Moneim AS, Naguib MM, Mostafa A, Hussein ITM, Arafa A, Erfan AM, Kilany WH, Agour MG, El‐Kanawati Z, Husseini HA, Selim AA, Kholousy S, El‐Naggar H, El‐Zoghby EF, Samy A, Iqbal M, Eid A, Ibraheem EM, Pleschka S, Veits J, Nasef SA, Beer M, Mettenleiter TC, Grund C, Ali MM, Harder TC and Hafez HM, 2016. Introduction and enzootic of A/H5N1 in Egypt: virus evolution, pathogenicity and vaccine efficacy ten years on. Infection Genetics and Evolution, 40, 80–90. - PubMed

LinkOut - more resources