

ECDC, EFSA and EMA Joint Scientific Opinion on a list of outcome indicators as regards surveillance of antimicrobial resistance and antimicrobial consumption in humans and food-producing animals
- PMID: 32625307
- PMCID: PMC7009961
- DOI: 10.2903/j.efsa.2017.5017
ECDC, EFSA and EMA Joint Scientific Opinion on a list of outcome indicators as regards surveillance of antimicrobial resistance and antimicrobial consumption in humans and food-producing animals
Abstract
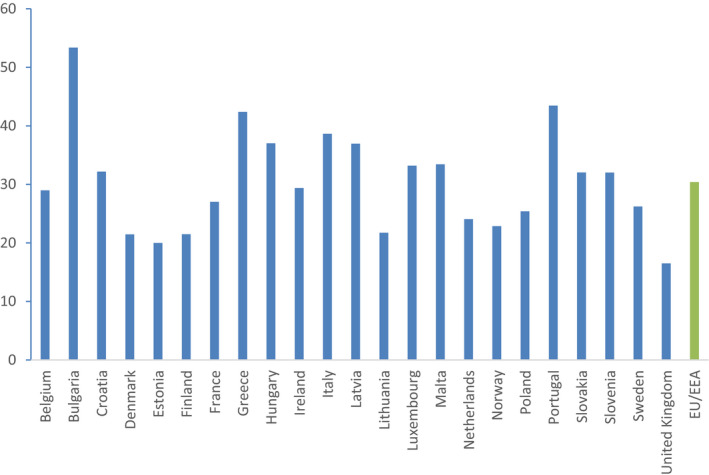
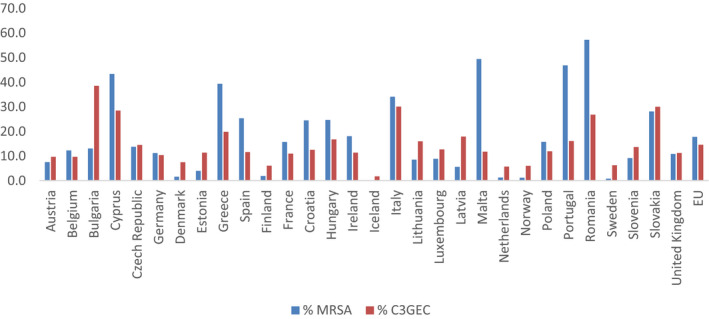
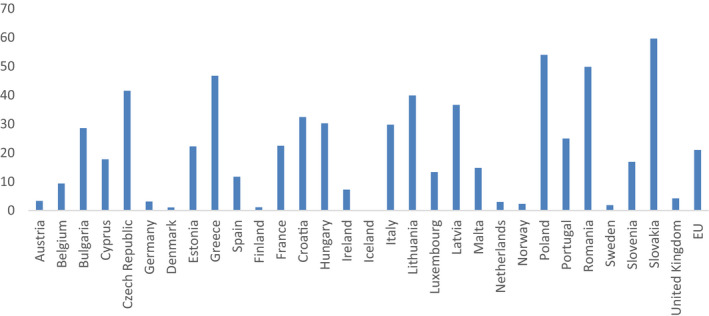
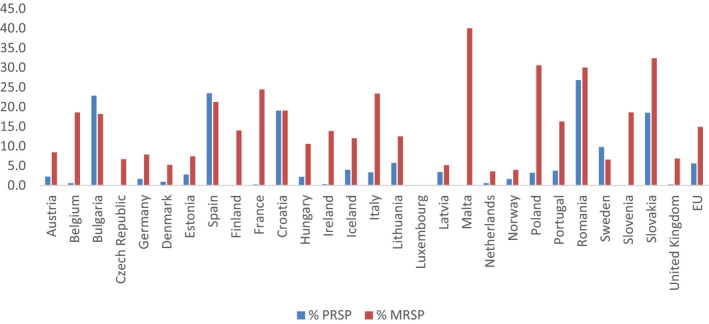
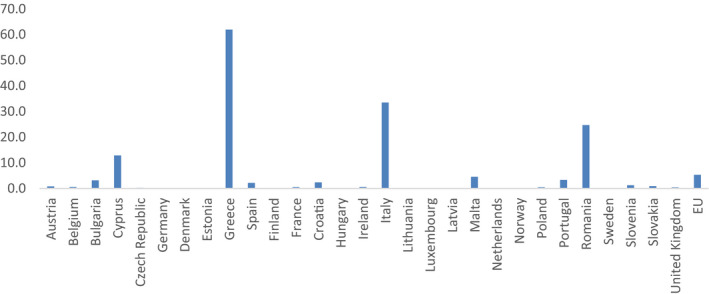
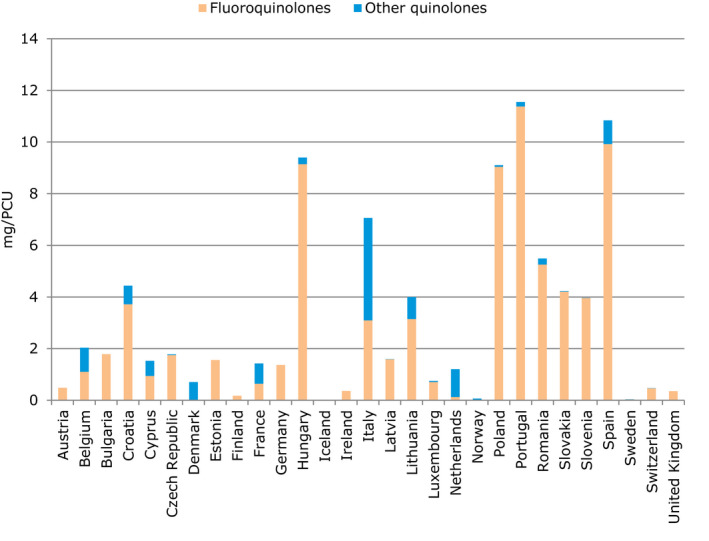
ECDC, EFSA and EMA have jointly established a list of harmonised outcome indicators to assist EU Member States in assessing their progress in reducing the use of antimicrobials and antimicrobial resistance (AMR) in both humans and food-producing animals. The proposed indicators have been selected on the basis of data collected by Member States at the time of publication. For humans, the proposed indicators for antimicrobial consumption are: total consumption of antimicrobials (limited to antibacterials for systemic use), ratio of community consumption of certain classes of broad-spectrum to narrow-spectrum antimicrobials and consumption of selected broad-spectrum antimicrobials used in healthcare settings. The proposed indicators for AMR in humans are: meticillin-resistant Staphylococcus aureus and 3rd-generation cephalosporin-resistant Escherichia coli, Klebsiella pneumoniae resistant to aminoglycosides, fluoroquinolones and 3rd-generation cephalosporins, Streptococcus pneumoniae resistant to penicillin and S. pneumoniae resistant to macrolides, and K. pneumoniae resistant to carbapenems. For food-producing animals, indicators for antimicrobial consumption include: overall sales of veterinary antimicrobials, sales of 3rd- and 4th-generation cephalosporins, sales of quinolones and sales of polymyxins. Finally, proposed indicators for AMR in food-producing animals are: full susceptibility to a predefined panel of antimicrobials in E. coli, proportion of samples containing ESBL-/AmpC-producing E. coli, resistance to three or more antimicrobial classes in E. coli and resistance to ciprofloxacin in E. coli. For all sectors, the chosen indicators, which should be reconsidered at least every 5 years, are expected to be valid tools in monitoring antimicrobial consumption and AMR. With the exception of the proposed human AMR indicators, the indicators are in general not suitable to monitor the effects of targeted interventions in a specific sector, such as in a single animal species or animal production sector. Management decisions should never be based on these indicators alone but should take into account the underlying data and their analysis.
Keywords: antimicrobial consumption; antimicrobial resistance; food‐producing animals; humans; indicator.
© 2017 European Centre for Disease Prevention and Control, © European Food Safety Authority and © European Medicines Agency. EFSA Journal published by John Wiley and Sons Ltd on behalf of European Food Safety Authority.
Figures
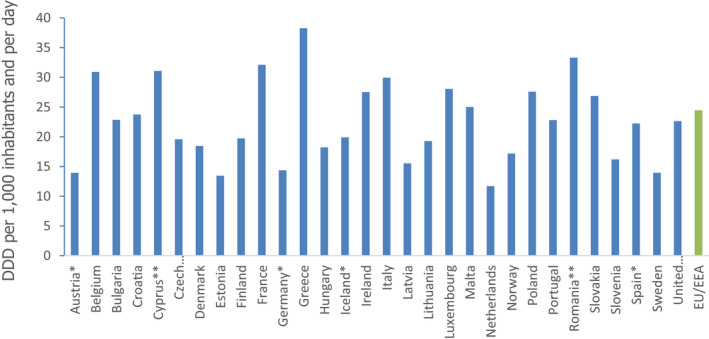
*: Country reported only community data.
**: Country reported total care data (aggregated data for both sectors).
EU/EEA: EU/EEA population‐weighted mean consumption.
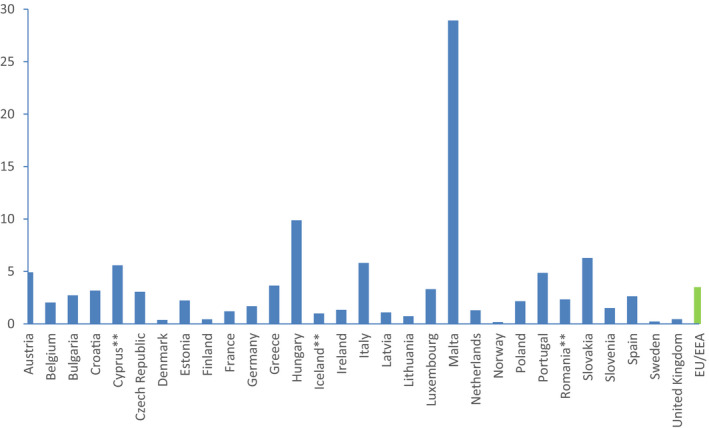
*: Country reported total care data (aggregated data for both sectors).
EU /EEA :EU /EEA population‐weighted mean consumption.
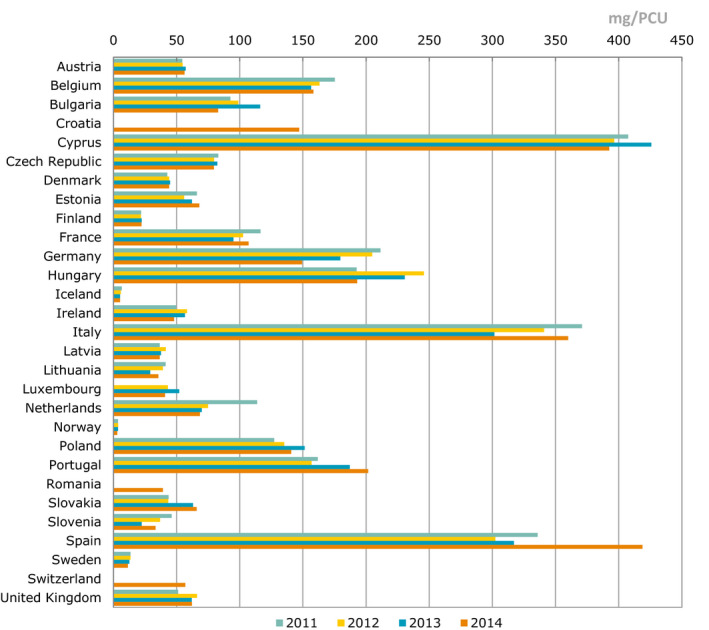
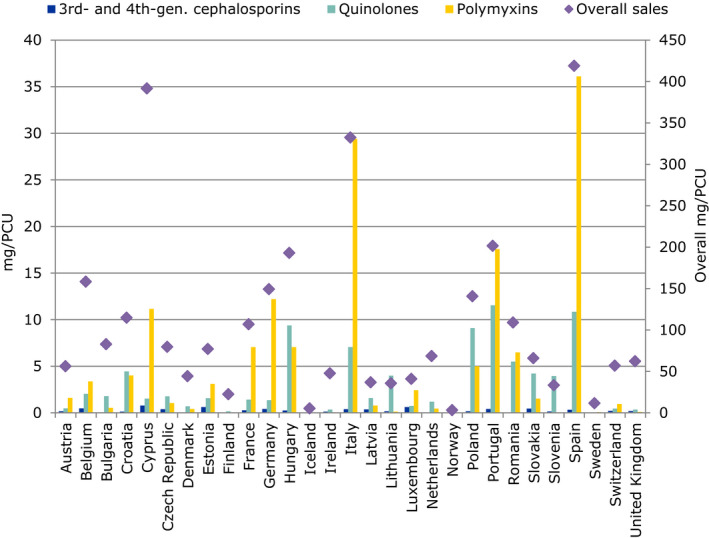
Different axis scale for overall sales and for
HCIA s.
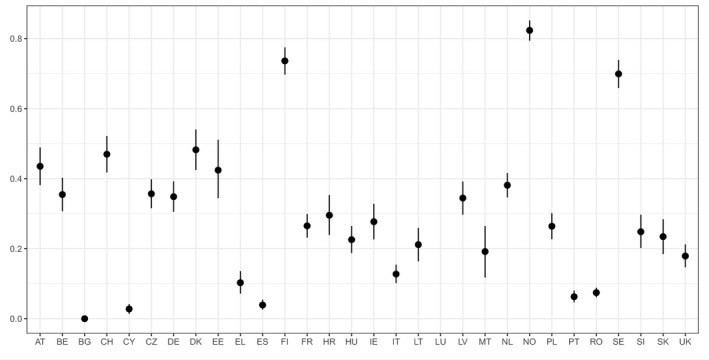
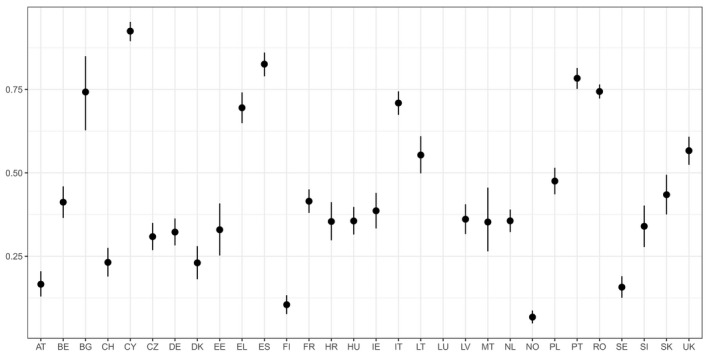
The graph shows median and 95% credibility interval. The indicators have been calculated using the available data presented in the
EUSR ‐AMR reports for years 2014 and 2015 (EFSA and ECDC, 2016, 2017). No data are shown for Luxembourg (no data available).
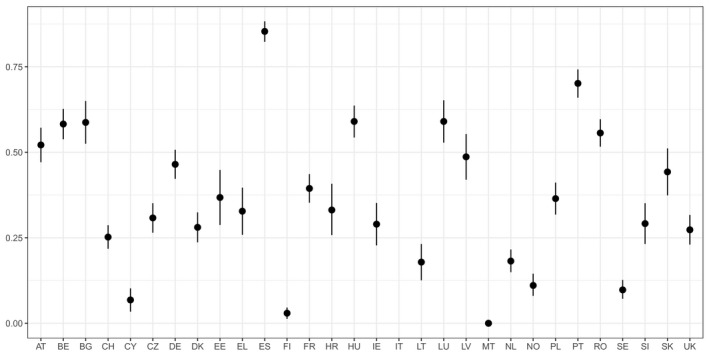
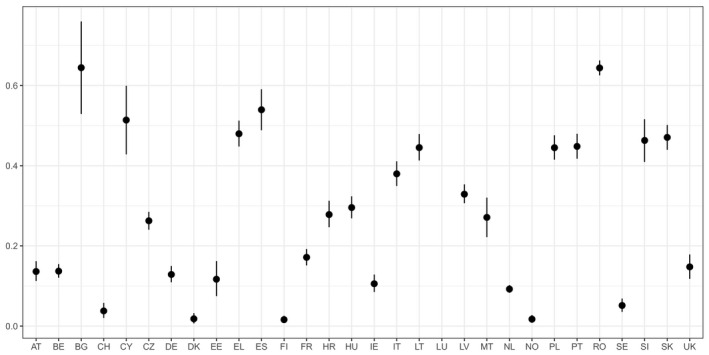
The graph shows median and 95% credibility interval. The indicators have been calculated using the available data presented in the
EUSR ‐AMR reports for year 2015 (EFSA and ECDC, 2017), and is therefore restricted to fattening pigs and calves, since in 2014 the specific monitoring forESBL ‐/AmpC‐producing E. coli was not mandatory, and prevalence data was submitted voluntarily by only one country (Italy). No data are shown for Italy (no data available).
The graph shows median and 95% credibility interval. The indicators have been calculated using the available data presented in the
EUSR ‐AMR reports for years 2014 and 2015 (EFSA and ECDC, 2016, 2017). No data are shown for Luxembourg (no data available).
The graph shows median and 95% credibility interval. The indicators have been calculated using the available data presented in the
EUSR ‐AMR reports for years 2014 and 2015 (EFSA and ECDC, 2016, 2017). No data are shown for Luxembourg (no data available).
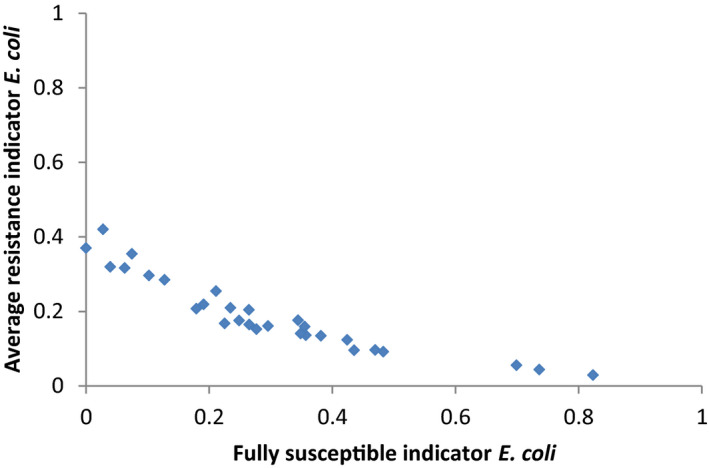
The indicators have been calculated using the available data presented in the
EUSR ‐AMR reports for years 2014 and 2015 (EFSA and ECDC, 2016, 2017). For the purpose of this graph, mean values of the indicators are considered.
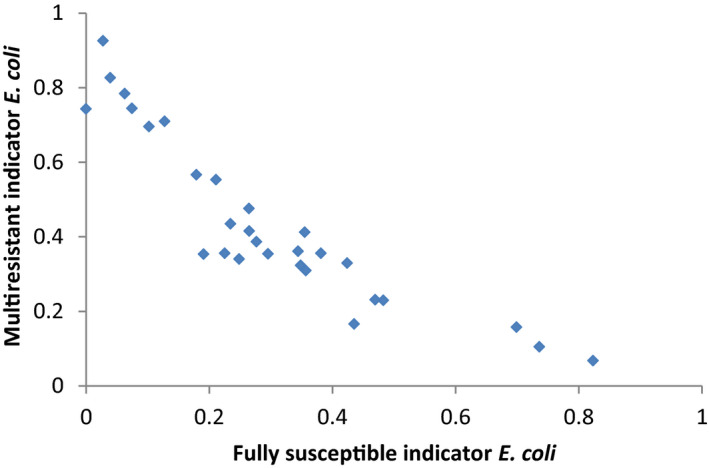
The indicators have been calculated using the available data presented in the
EUSR ‐AMR reports for years 2014 and 2015 (EFSA and ECDC, 2016, 2017). For the purpose of this graph, mean values of the indicators are considered.
The indicators have been calculated using the available data presented in the
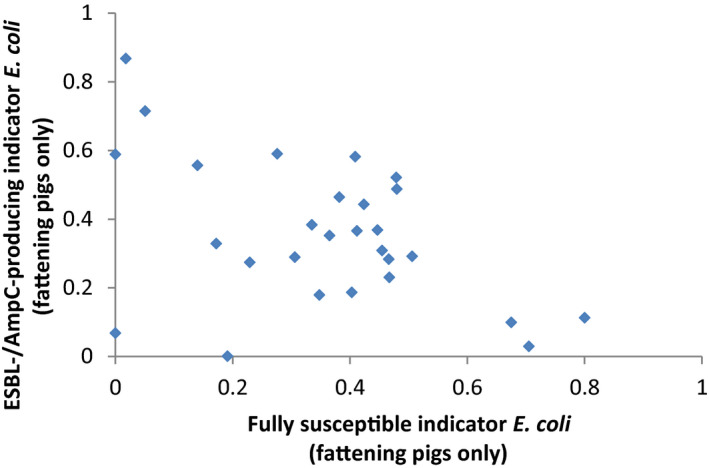
EUSR ‐AMR reports for year 2015 (EFSA and ECDC, 2017). For the purpose of this graph, mean values of the indicators are considered. Since the indicator onESBL ‐/AmpC‐producing indicator E. coli can be calculated based on the data collected during 2015 only (fattening pigs and calves), and since data for calves is available for a limited number of countries, this graph shows the correlation between the two indicators (fully susceptible indicator E. coli vsESBL ‐/AmpC‐producing indicator E. coli) calculated only for fattening pigs. This allows investigating better the correlation between the two indicators.
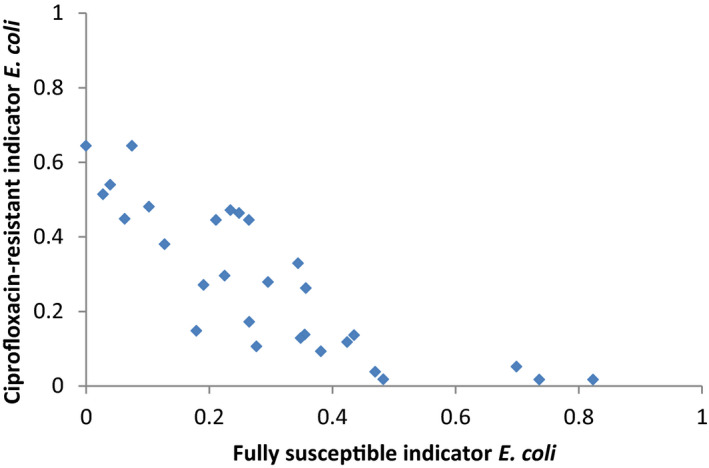
The indicators have been calculated using the available data presented in the
EUSR ‐AMR reports for years 2014 and 2015 (EFSA and ECDC, 2016, 2017). For the purpose of this graph, mean values of the indicators are considered.
References
-
- ANSES‐ANMV (French Agency for Food Environmental and Occupational Health & Safety, French Agency for Veterinary Medicinal Products), Méheust D, Chevance A and Moulin G 2016. Sales survey of veterinary medicinal products containing antimicrobials in France in 2015. French Agency for Food, Environmental and Occupational Health & Safety (ANSES) ‐ French Agency for Veterinary Medicinal Products (ANMV). 105 pp. Available online: https://www.anses.fr/en/system/files/ANMV-Ra-Antibiotiques2015EN.pdf
-
- Buyle FM, Metz‐Gercek S, Mechtler R, Kern WV, Robays H, Vogelaers D and Struelens MJ and Antibiotic Strategy International (ABS) Quality Indicators Team , 2013. Development and validation of potential structure indicators for evaluating antimicrobial stewardship programmes in European hospitals. European Journal of Clinical Microbiology and Infectious Diseases, 32, 1161–1170. 10.1007/s10096-013-1862-4 - DOI - PubMed
-
- Byrne FM and Wilcox MH, 2011. MRSA prevention strategies and current guidelines. Injury‐International Journal of the Care of the Injured, 42, S3–S6. - PubMed
LinkOut - more resources
Full Text Sources
Molecular Biology Databases
Research Materials