

The European Union summary report on trends and sources of zoonoses, zoonotic agents and food-borne outbreaks in 2016
- PMID: 32625371
- PMCID: PMC7009962
- DOI: 10.2903/j.efsa.2017.5077
The European Union summary report on trends and sources of zoonoses, zoonotic agents and food-borne outbreaks in 2016
Abstract
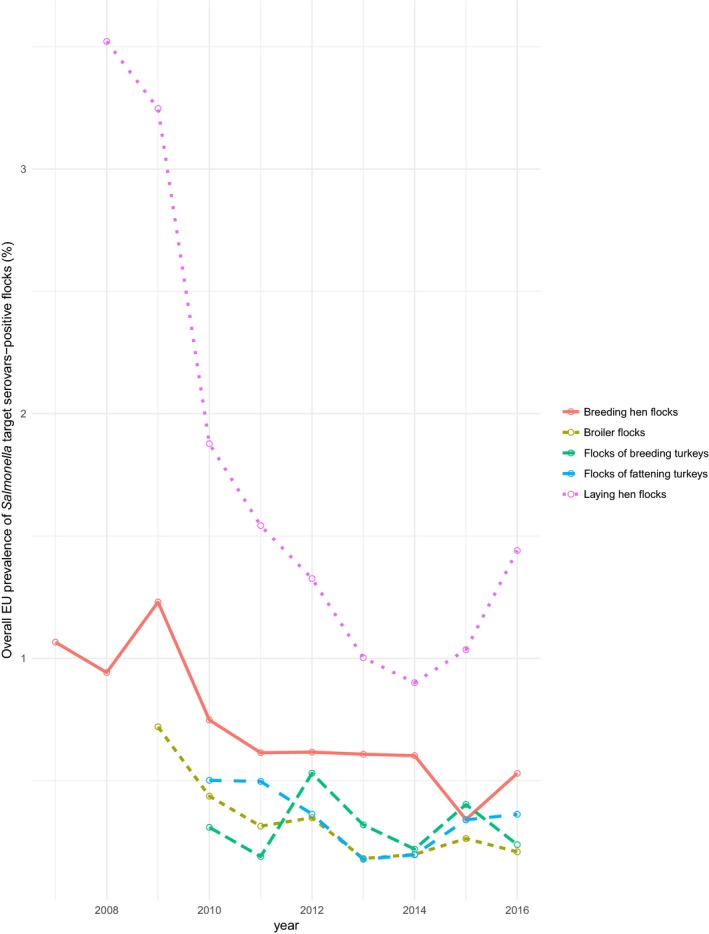
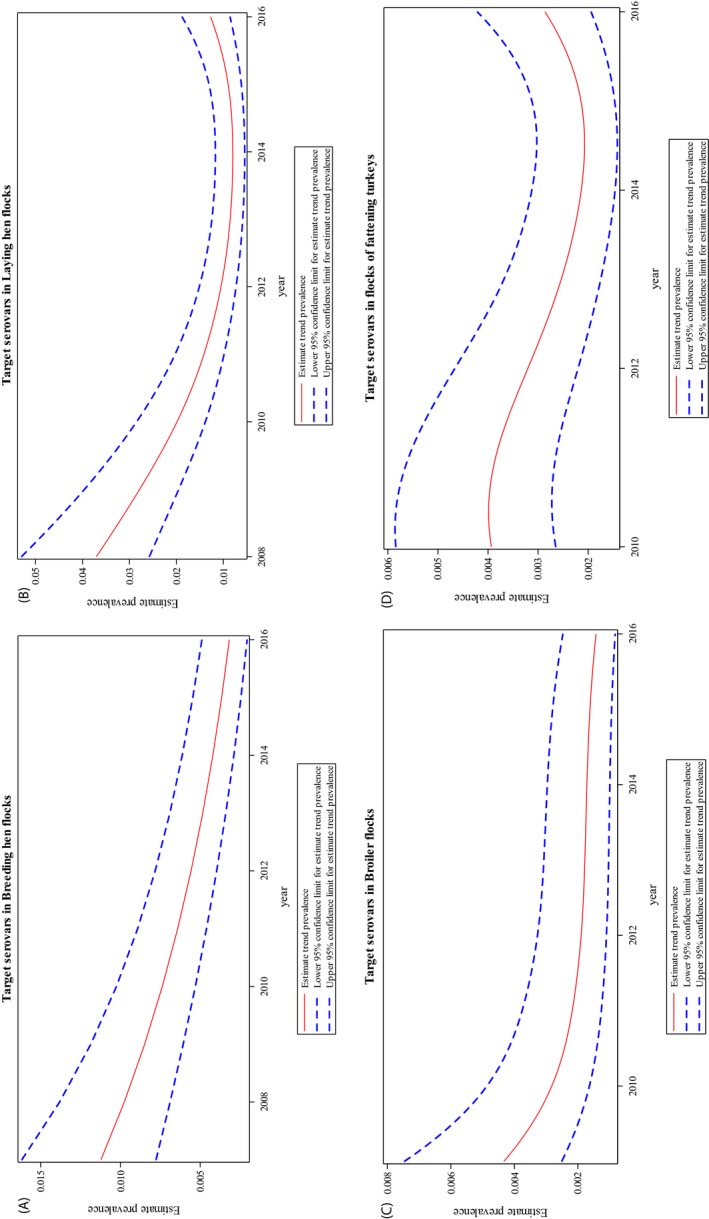
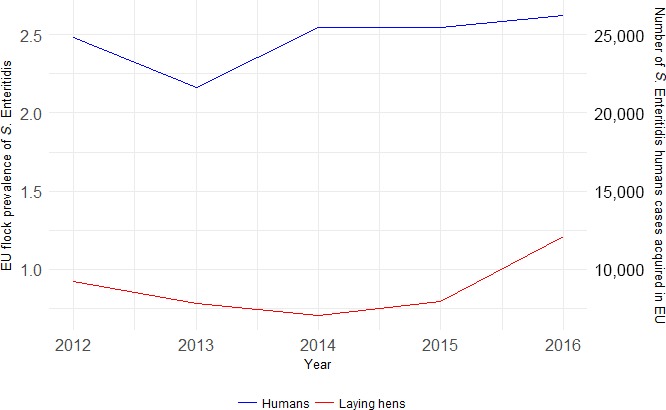
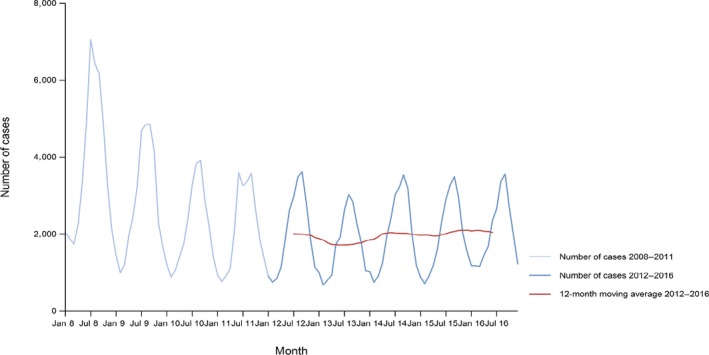
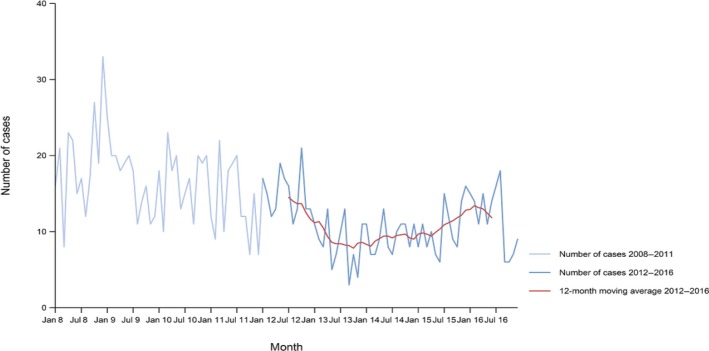
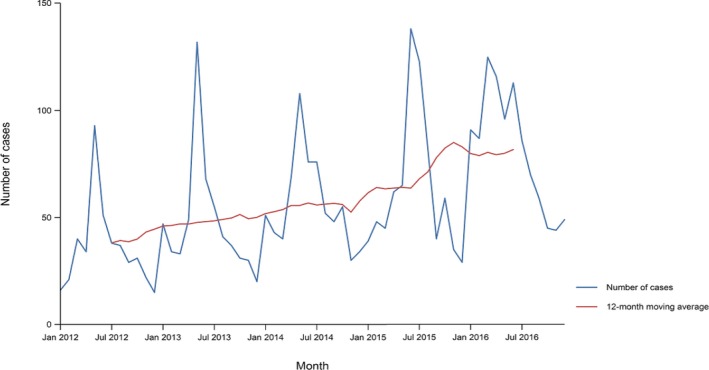
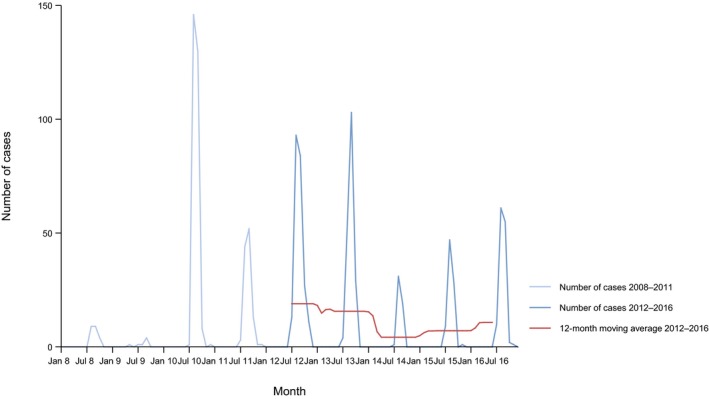
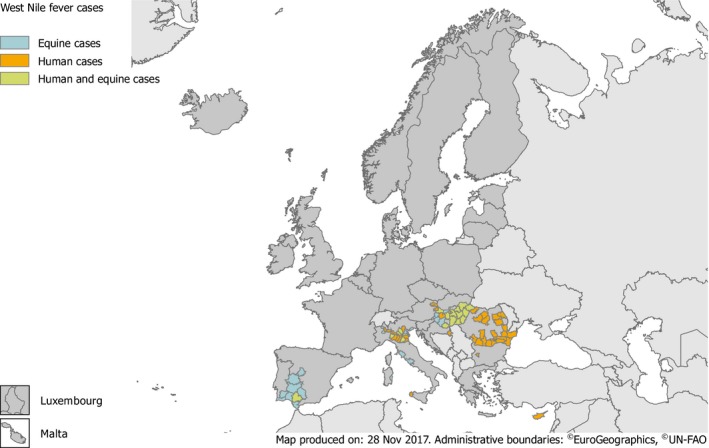
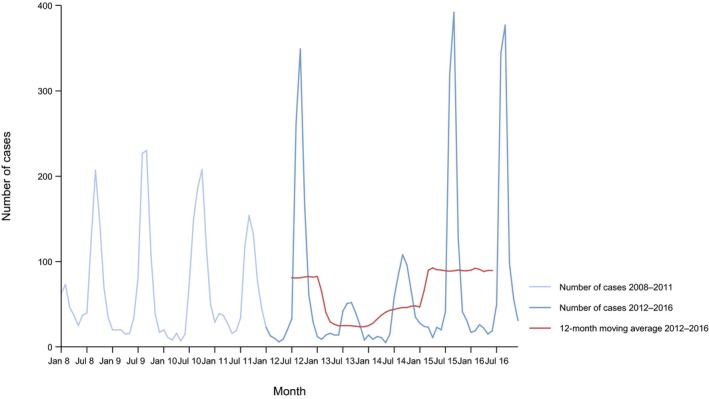
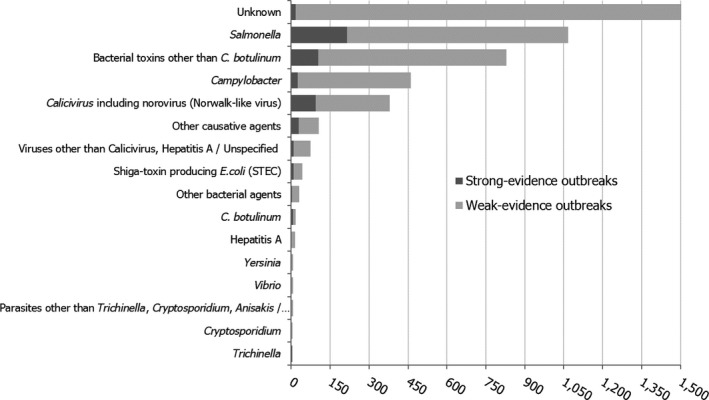
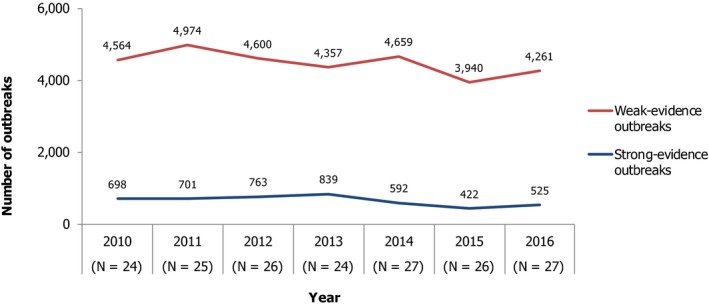
This report of the European Food Safety Authority and the European Centre for Disease Prevention and Control presents the results of the zoonoses monitoring activities carried out in 2016 in 37 European countries (28 Member States (MS) and nine non-MS). Campylobacteriosis was the most commonly reported zoonosis and the increasing European Union (EU) trend for confirmed human cases since 2008 stabilised during 2012-2016. In food, the occurrence of Campylobacter remained high in broiler meat. The decreasing EU trend for confirmed human salmonellosis cases since 2008 ended during 2012-2016, and the proportion of human Salmonella Enteritidis cases increased. Most MS met their Salmonella reduction targets for poultry, except five MS for laying hens. At primary production level, the EU-level flock prevalence of target Salmonella serovars in breeding hens, broilers, breeding and fattening turkeys decreased or stabilised compared with previous years but the EU prevalence of S. Enteritidis in laying hens significantly increased. In foodstuffs, the EU-level Salmonella non-compliance for minced meat and meat preparations from poultry was low. The number of human listeriosis confirmed cases further increased in 2016, despite the fact that Listeria seldom exceeds the EU food safety limit in ready-to-eat foods. The decreasing EU trend for confirmed yersiniosis cases since 2008 stabilised during 2012-2016, and also the number of confirmed Shiga toxin-producing Escherichia coli (STEC) infections in humans was stable. In total, 4,786 food-borne outbreaks, including waterborne outbreaks, were reported. Salmonella was the most commonly detected causative agent - with one out of six outbreaks due to S. Enteritidis - followed by other bacteria, bacterial toxins and viruses. Salmonella in eggs continued to represent the highest risk agent/food combination. The report further summarises trends and sources for bovine tuberculosis, brucellosis, trichinellosis, echinococcosis, toxoplasmosis, rabies, Q fever, West Nile fever and tularaemia.
Keywords: Campylobacter; Listeria; Salmonella; food‐borne outbreaks; monitoring; parasites; zoonoses.
© 2017 European Food Safety Authority and European Centre for Disease Prevention and Control.
Figures
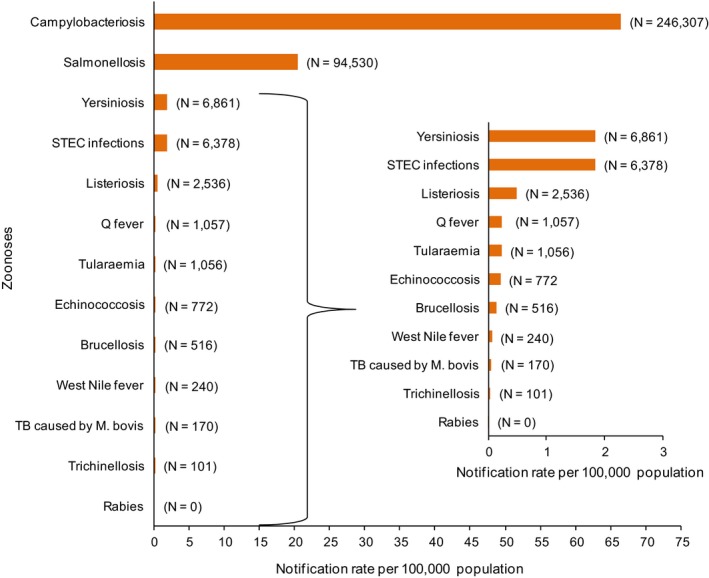
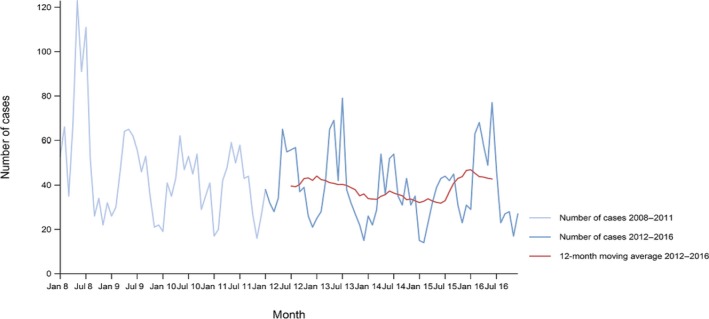
Note: Total number of confirmed cases is indicated in parenthesis at the end each bar. Exception: West Nile fever where the total number of cases was used.
Source(s): Austria, Cyprus, the Czech Republic, Denmark, Estonia, Finland, France, Germany, Hungary, Iceland, Ireland, Italy, Latvia, Lithuania, Luxembourg, Malta, the Netherlands, Norway, Poland, Romania, Slovakia, Slovenia, Spain, Sweden and the United Kingdom. Belgium, Bulgaria, Croatia and Portugal did not report data at the level of detail required for the analysis. In Greece, campylobacteriosis is not under surveillance.
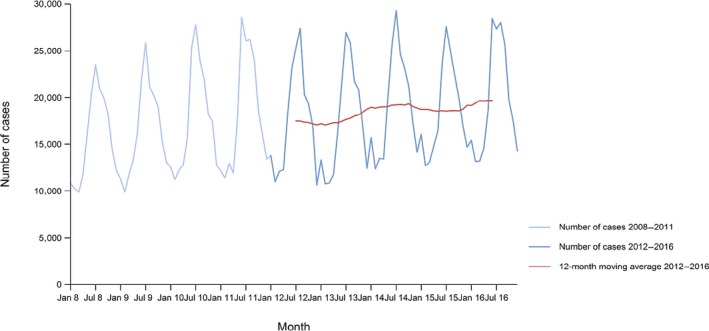
Source(s): Austria, Cyprus, the Czech Republic, Denmark, Estonia, Finland, France, Germany, Greece, Hungary, Iceland, Ireland, Italy, Lithuania, Luxembourg, Latvia, Malta, the Netherlands, Norway, Poland, Portugal, Romania, Slovakia, Slovenia, Spain, Sweden and the United Kingdom. Belgium, Bulgaria and Croatia did not report data to the level of detail required for the analysis.
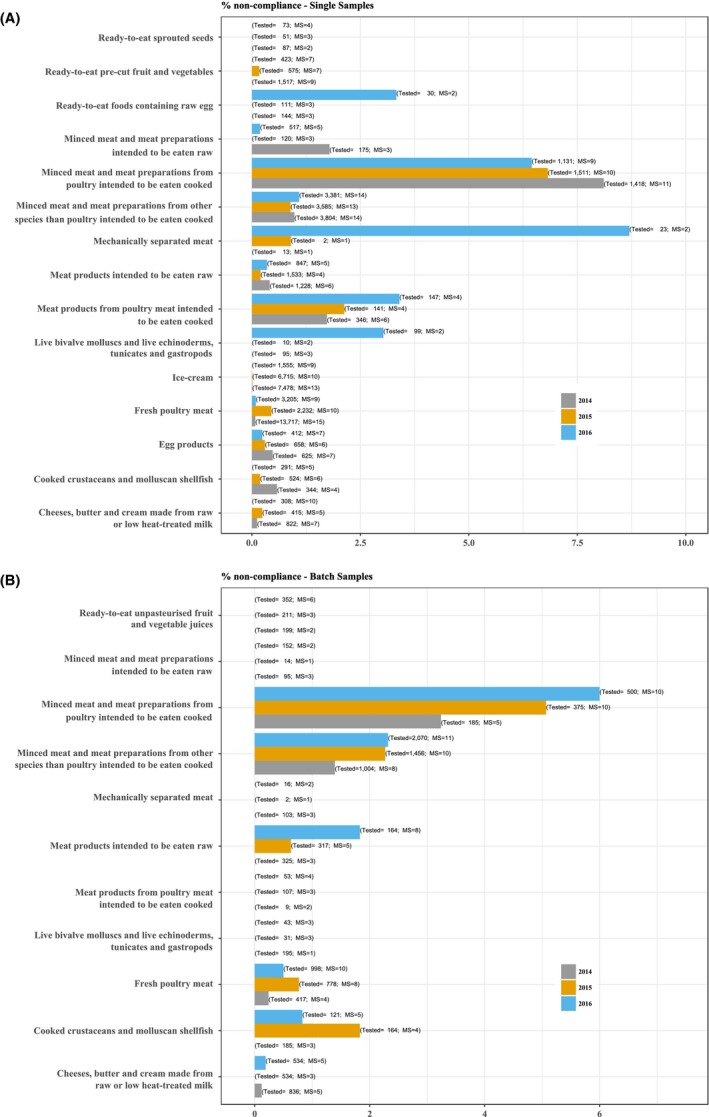
Total sample size at
EU ‐level per year is indicated at the top of each bar.
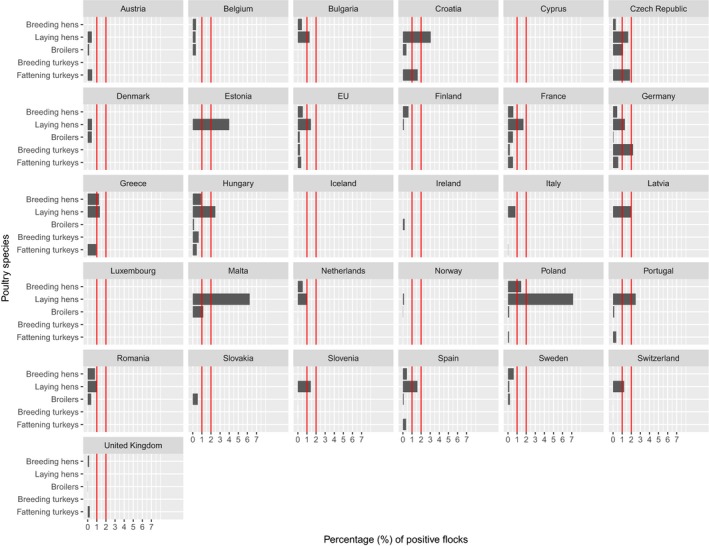
Red vertical bars indicate the target to be reached, which was fixed at 1% for all categories with the exception of laying hens, which was 2% for all
MS with the exception of Poland, for which it was 2.5%. Malta met the target in laying hens because only 1 flock tested positive for target serovars (S. Enteritidis) but had less than 50 flocks of adult laying hens.
AL : Albania;BA : Bosnia and Herzegovina;FYRM : the Former Yugoslav Republic of Macedonia;ME : Montenegro; andSR : Serbia.
AL : Albania;BA : Bosnia and Herzegovina;FYRM : the Former Yugoslav Republic of Macedonia;ME : Montenegro; andSR : Serbia.
AL : Albania;BA : Bosnia and Herzegovina;FYRM : the Former Yugoslav Republic of Macedonia;ME : Montenegro; andSR : Serbia.
AL : Albania;BA : Bosnia and Herzegovina;FYRM : the Former Yugoslav Republic of Macedonia;ME : Montenegro; andSR , Serbia.
AL : Albania;BA : Bosnia and Herzegovina;FYRM : the Former Yugoslav Republic of Macedonia;ME : Montenegro; andSR : Serbia.
AL : Albania;BA : Bosnia and Herzegovina;FYRM : the Former Yugoslav Republic of Macedonia:ME : Montenegro; andSR : Serbia.
AL : Albania;BA : Bosnia and Herzegovina;FYRM : the Former Yugoslav Republic of Macedonia;ME : Montenegro; andSR : Serbia.
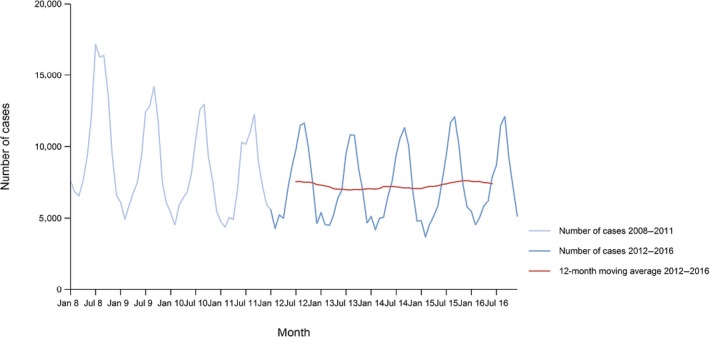
Source(s): Austria, Cyprus, the Czech Republic, Denmark, Estonia, Finland, France, Germany, Greece, Hungary, Iceland, Ireland, Italy, Lithuania, Luxembourg, Latvia, Malta, the Netherlands, Norway, Poland, Portugal, Romania, Slovakia, Slovenia, Spain, Sweden and the United Kingdom. Belgium, Bulgaria and Croatia did not report data to the level of detail required for the analysis.
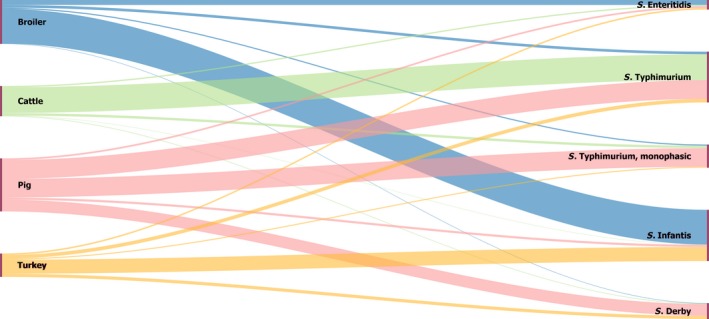
The left side of the diagram shows the five most commonly reported serovars from
EU domestic cases of human infection: S. Infants (blue), S. Typhimurium (green), S. Enteritidis (pink), monophasic S. Typhimurium (yellow) and S. Derby (violet). Animal and food data from the same source were merged: broiler includes isolates from broilers and broiler meat, cattle includes isolates from bovine animals and bovine meat, pig includes isolates from pigs and pig meat, turkey includes isolates from turkeys and turkey meat. The right side shows the four sources considered (broiler, cattle, pig and turkey). The width of the coloured bands linking sources and serovars is proportional to the percentage of isolation of each serovar in each source.
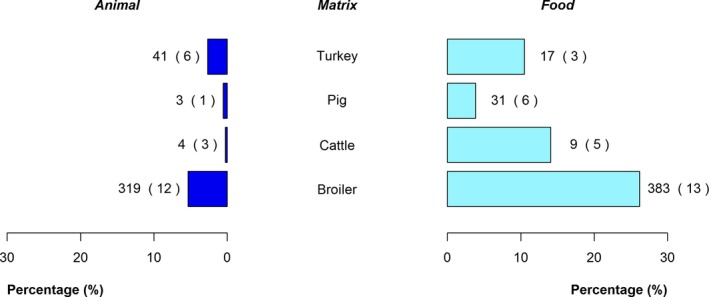
The percentages are calculated on the total number of isolates for each category (animal and food). The values at the side of each bar are the number of S. Enteritidis isolates for each species and category and the number in parentheses indicates the number of reporting Member States.
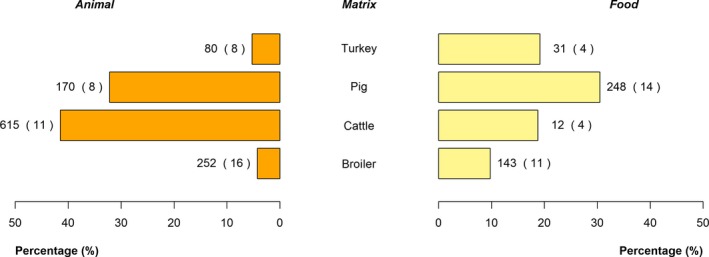
The percentages are calculated based on the total number of isolates for each category (animal and food). The values at the side of each bar are the number of S. Typhimurium isolates for each species and category and the number in parentheses indicates the number of reporting Member States.
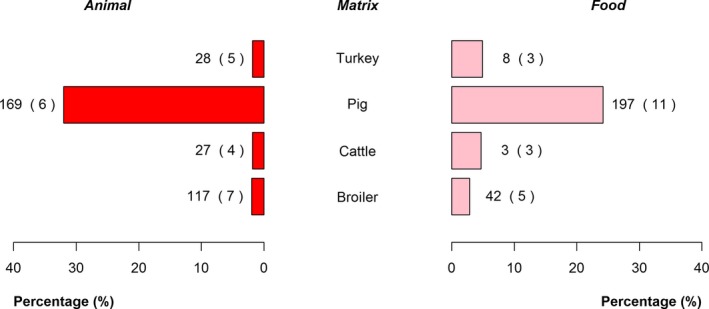
The percentages are calculated on the total number of isolates for each category (animal and food). The values at the side of each bar are the number of monophasic variant of S. Typhimurium isolates for each species and category and the number in parentheses indicates the number of reporting Member States.
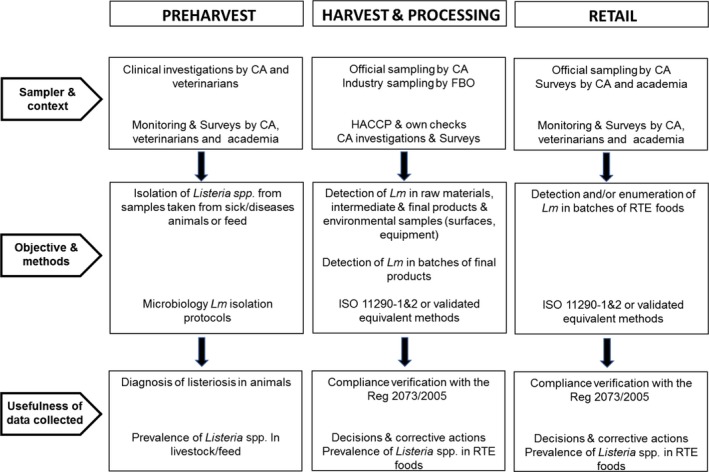
Lm: Listeria monocytogenes;
CA : Competent Authorities.HACCP : Hazard Analysis and Critical Control Points;RTE : ready‐to‐eat.
Source(s): Austria, Belgium, Cyprus, the Czech Republic, Denmark, Estonia, Finland, France, Germany, Greece, Hungary, Iceland, Ireland, Italy, Latvia, Lithuania, Malta, the Netherlands, Norway, Poland, Romania, Slovakia, Slovenia, Spain, Sweden and the United Kingdom. Bulgaria, Croatia, Luxembourg and Portugal did not report data to the level of detail required for the analysis.
‘Overall’ and the number of
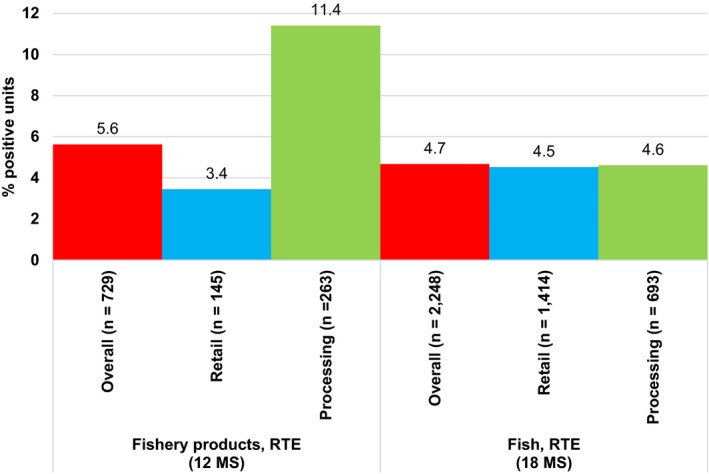
MS correspond to data across all major sampling stages (‘retail’ + ‘processing’ + ‘border inspection activities’ + ‘unspecified’). ‘Retail’ corresponds to data obtained from catering, hospitals or medical care facilities, retail, wholesale and restaurants or cafes or pubs or bars or hotels or catering services. ‘Processing’ corresponds to data obtained from packing centres, cutting plants and processing plants. For each sampling stage (‘overall’, ‘retail’ and ‘processing’), data are pooled across both types of sampling units (‘single’ and ‘batch’). As data were mostly reported by a limited number ofMS , the findings presented in this figure may not be representative of theEU ‐level.‘Fish,
RTE ’ includes detection data onRTE fish from 18MS (Austria, Belgium, Bulgaria, Croatia, Cyprus, the Czech Republic, Denmark, Estonia, Germany, Greece, Hungary, Ireland, Italy, Luxembourg, the Netherlands, Slovakia, Spain and Sweden) and includes data on ‘Fish’ of the following types: ‘chilled’, ‘cooked’, ‘gravad lax/slightly salted’, ‘marinated’ and ‘smoked (hot‐ and cold‐smoked)’.‘Fishery products,
RTE ’ includes detection data from 12MS (Austria, Belgium, Bulgaria, Croatia, Cyprus, Estonia, Hungary, Ireland, Portugal, Slovakia, Spain and Sweden) and includes data on the following types: ‘prawns, cooked’, ‘prawns‐shelled, shucked and cooked’, ‘shrimps, cooked’, ‘shrimps, shelled, shucked and cooked’, ‘crustaceans, unspecified, cooked’, ‘crustaceans, unspecified, shelled, shucked and cooked’, ‘molluscan shellfish, cooked’, ‘unspecified’ (cooked, ready‐to‐eat, pâté, smoked) and ‘Surimi’.
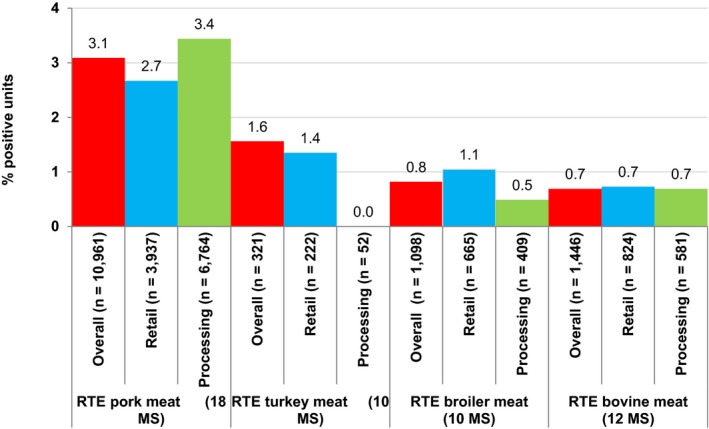
‘Overall’ and the number of
MS correspond to data across all major sampling stages (‘retail’ + ‘processing’ + ‘border inspection activities’ + ‘unspecified’). ‘Retail’ corresponds to data obtained from catering, hospital or medical care facilities, retail, wholesale and restaurants or cafes or pubs or bars or hotels or catering services. ‘Processing’ corresponds to data obtained from packing centres, cutting plants and processing plants. For each sampling stage (‘overall’, ‘retail’ and ‘processing’) data are pooled across both types of sampling units (‘single’ and ‘batch’). Since data were mostly reported by a limited number ofMS , the findings presented in this figure may not be representative of theEU ‐level.‘
RTE pork meat’ includes detection data onRTE pig meat products from 18MS (Austria, Belgium, Bulgaria, Croatia, Cyprus, the Czech Republic, Denmark, Estonia, Germany, Greece, Hungary, Ireland, Italy, Luxembourg, Portugal, Slovakia, Spain and Sweden) and includes data on ‘Meat from pig, meat products’ of the following types: ‘cooked ham (sliced or non‐sliced)’, ‘cooked,RTE ’, ‘fermented sausages’, ‘fresh raw sausages’, ‘meat specialities’, ‘pâté’, ‘raw and intended to be eaten raw’, ‘raw ham’, ‘unspecified, ready‐to‐eat’.‘
RTE turkey meat’ includes detection data onRTE turkey meat products from 10MS (Austria, Cyprus, Estonia, Hungary, Ireland, Italy, Luxembourg, Portugal, Spain and Sweden) and includes data on turkey ‘meat products’ of the following types: ‘cooked,RTE ’, ‘preserved’ and ‘raw and intended to be eaten raw’.‘
RTE broiler meat’ includes detection data onRTE broiler meat products from 10MS (Bulgaria, the Czech Republic, Estonia, Hungary, Ireland, Italy, Portugal, Spain, Sweden and the United Kingdom) and includes data on broiler ‘meat products’ of the following types: ‘cooked,RTE ’ and ‘cooked,RTE , chilled’.‘
RTE bovine meat’ includes detection data onRTE bovine meat products from 12MS (Austria, Bulgaria, the Czech Republic, Denmark, Estonia, Germany, Hungary, Ireland, Italy, Luxembourg, Spain and Sweden) and includes data on ‘Meat from bovine animals, meat products’ of the following types: ‘cooked,RTE ’, ‘cooked,RTE , chilled’, ‘fermented sausages’, ‘raw and intended to be eaten raw’, ‘unspecified,RTE ’.
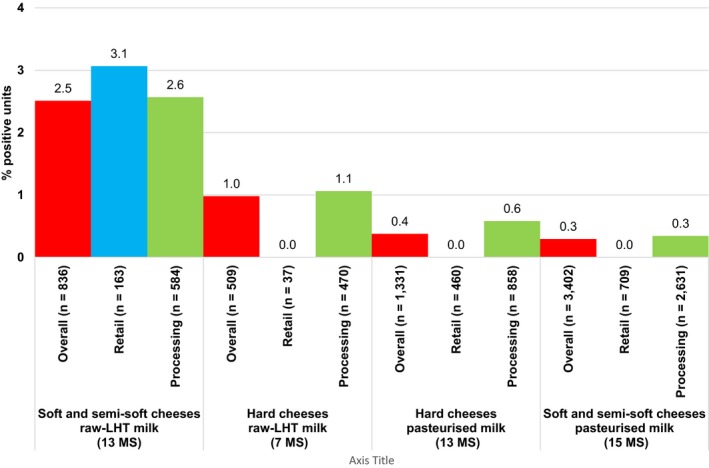
LHT : low heat treated. ‘Overall’ and the number ofMS correspond to data across all major sampling stages (‘retail’ + ‘processing’ + ‘farm’ + ‘border inspection activities’ + ‘unspecified’). ‘Retail’ corresponds to data obtained from catering, hospital or medical care facilities, retail, wholesale and restaurants or cafes or pubs or bars or hotels or catering services. For each sampling stage (‘overall’, ‘retail’ and ‘processing’), data are pooled across both types of sampling units (‘single’ and ‘batch’). ‘Processing’ corresponds to data obtained from packing centres, cutting plants and processing plants. Since data were mostly reported by a limited number ofMS , the findings presented in this figure may not be presentative of theEU ‐level. Soft and semi‐soft cheeses as well as hard cheeses include all cheeses for which Level 2 at matrix level was specified (‘fresh’ or ‘soft’ or ‘semi‐soft’ or ‘hard’).‘Soft and semi‐soft cheeses, made from raw‐
LHT milk’ includes detection data from 13MS (Austria, Belgium, Croatia, the Czech Republic, Estonia, France, Hungary, Ireland, Italy, the Netherlands, Portugal, Slovakia and Spain).‘Hard cheeses, made from raw‐
LHT milk’ includes detection data from 7MS (Austria, Bulgaria, Estonia, France, Ireland, Portugal and Spain).‘Hard cheeses, made from pasteurised milk’ includes detection data from 13
MS (Austria, Bulgaria, Croatia, Cyprus, the Czech Republic, Denmark, Estonia, Finland, Greece, Hungary, Ireland, Portugal and Spain).‘Soft and semi‐soft cheeses, made from pasteurised milk’ includes detection data from 15
MS (Austria, Belgium, Bulgaria, Croatia, Cyprus, the Czech Republic, Denmark, Estonia, Greece, Hungary, Ireland, Luxembourg, Portugal, Slovakia and Spain).
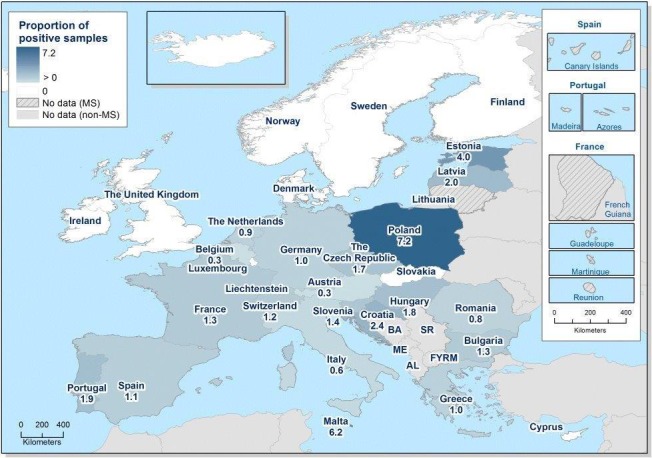
Source(s): Austria, Cyprus, Denmark, Estonia, Finland, France, Germany, Greece, Hungary, Iceland, Ireland, Italy, Latvia, Lithuania, Luxembourg, Malta, the Netherlands, Norway, Poland, Romania, Slovakia, Slovenia, Spain, Sweden and the United Kingdom. Belgium, Bulgaria, the Czech Republic, Croatia and Portugal did not report data to the level of detail required for analysis.
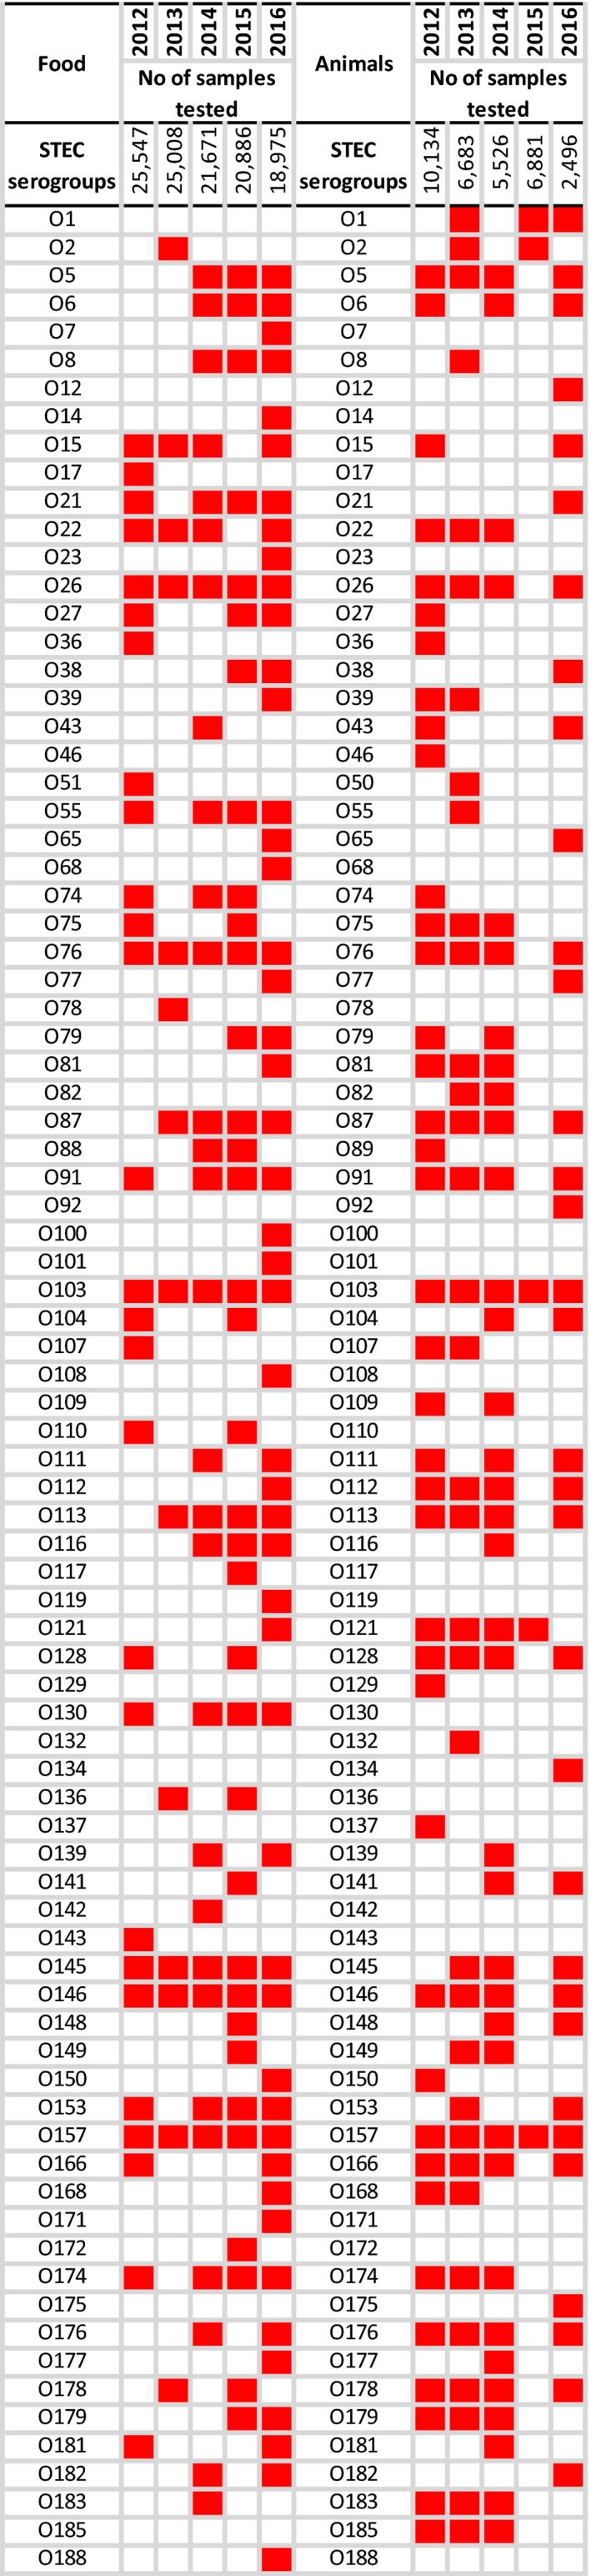
Note: Presence (red boxes) and absence of
STEC serogroups in foods (left) and animals (right).STEC : Shiga toxin‐producing Escherichia coli.
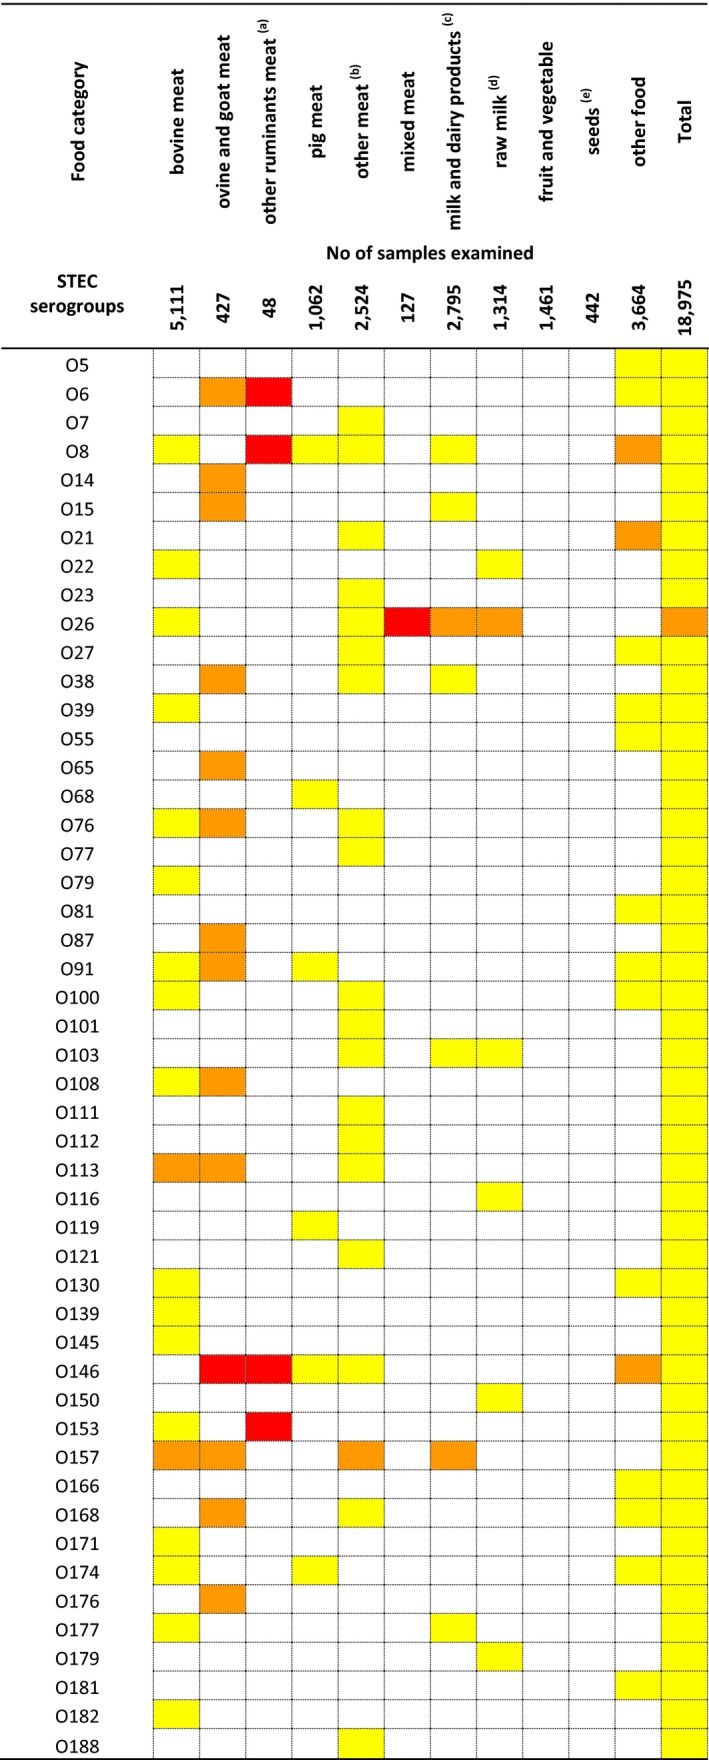
STEC : Shiga toxin‐producing Escherichia coli.Proportions of
STEC serogroups: red boxes > 1%, orange boxes > 0.1% and ≤ 1%, yellow boxes > 0.0001% and ≤ 0.1% of positive samples. White boxes indicate absence of the serogroup.(a) Other ruminants’ meat includes meat from deer.
(b) Other meat includes meat from animals other than ruminants.
(c) Milk and dairy products include any type of dairy product, cheese and milk other than raw milk.
(d) Raw milk includes raw milk from different species but most of the tested, and all the positive, samples were from cows.
(e) Seeds category includes mostly sprouted seeds, but dry seeds are also included.
Sources: 19
MS and Switzerland.
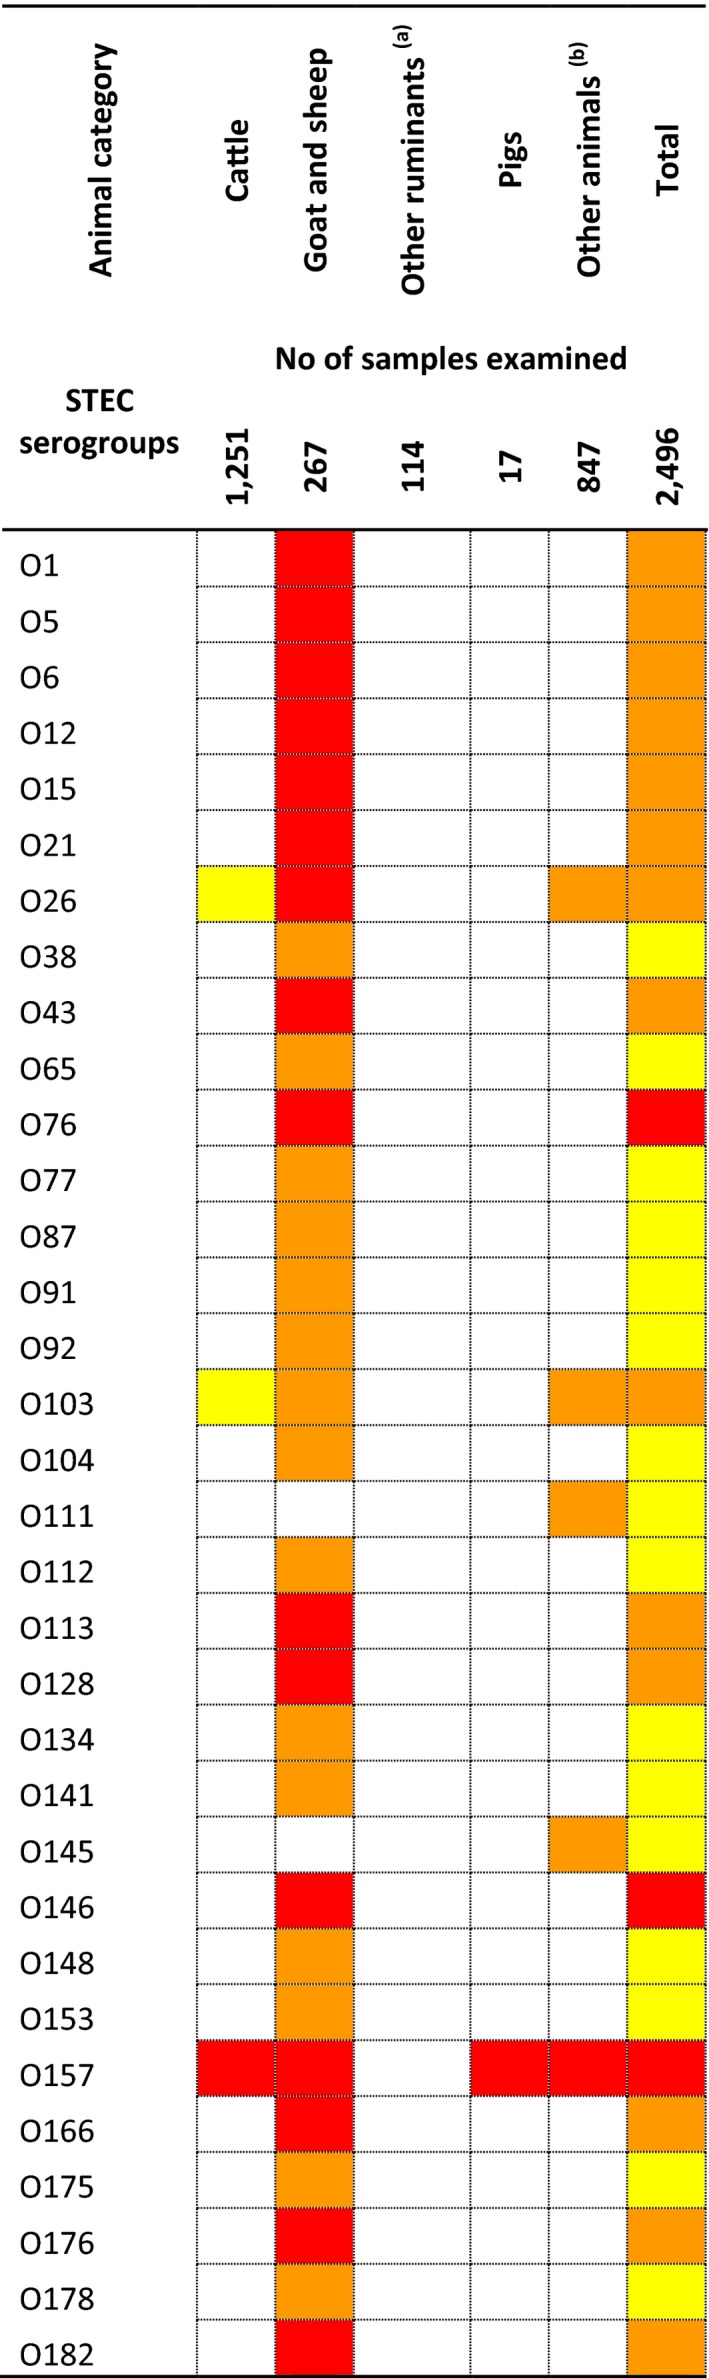
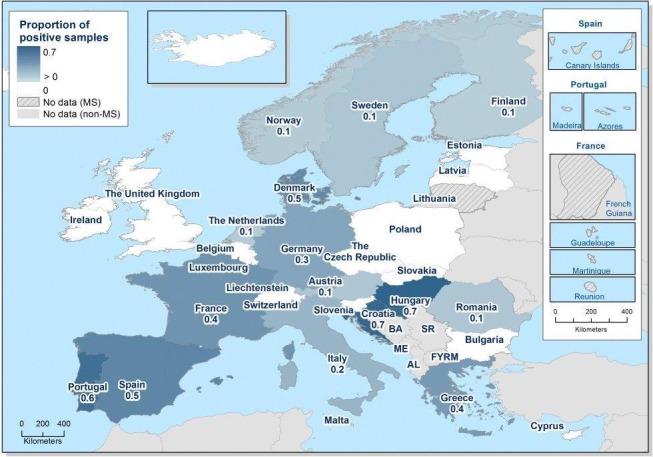
STEC : Shiga toxin‐producing Escherichia coli.Proportions of
STEC serogroups: red boxes > 1%, orange boxes > 0.1% and ≤ 1%, yellow boxes > 0.0001% and ≤ 0.1% of positive samples. White boxes indicate absence of the serogroup.(a) The animal category ‘other ruminants’ includes deer.
(b) The ‘other animal’ category comprises bats, Cantabrian chamois, deer, dogs, ibex and wild boar.
Sources: 9
MS .
Source(s): Austria, Cyprus, the Czech Republic, Denmark, Estonia, Finland, Germany, Hungary, Ireland, Italy, Latvia, Lithuania, Luxembourg, Malta, Norway, Poland, Romania Slovakia, Slovenia, Spain, Sweden and the United Kingdom. Belgium, Bulgaria, Croatia, France, Iceland and Portugal did not report data to the level of detail required for the analysis. Greece and the Netherlands do not have any formal surveillance system for the disease.
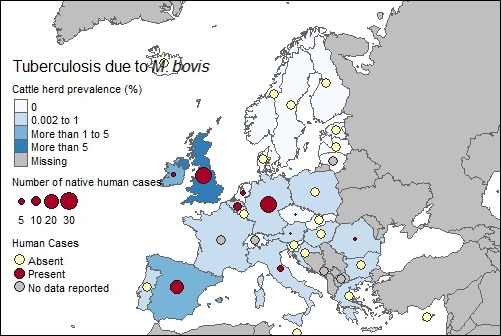
OF : Officially bovine tuberculosis free in cattle;MS : Member State.
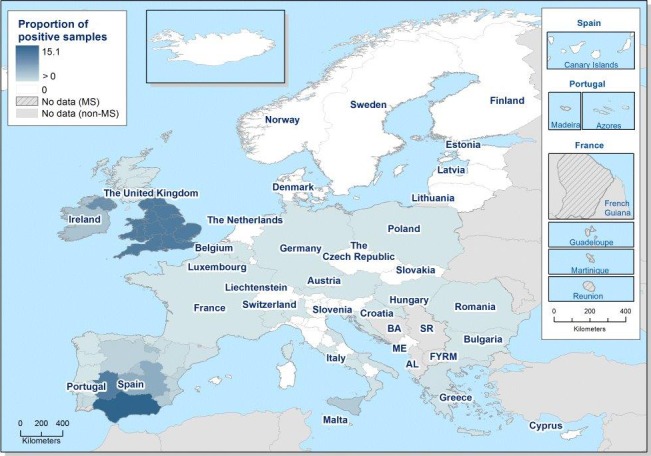
AL : Albania;BA : Bosnia and Herzegovina;FYRM : Former Yugoslav Republic of Macedonia,ME : Montenegro; andSR : Serbia.
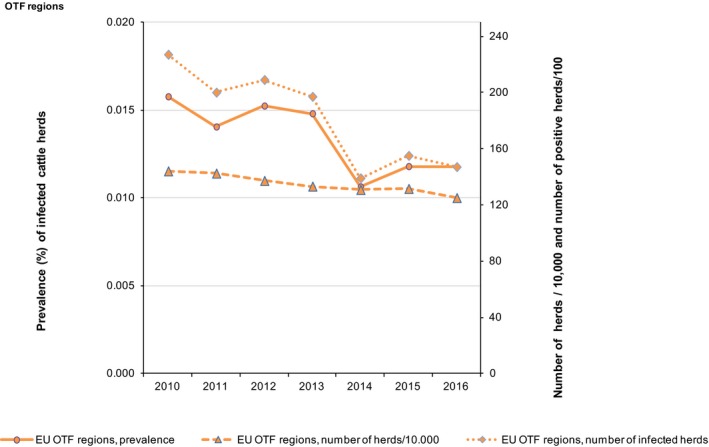
OTF : Officially bovine tuberculosis free in cattle.
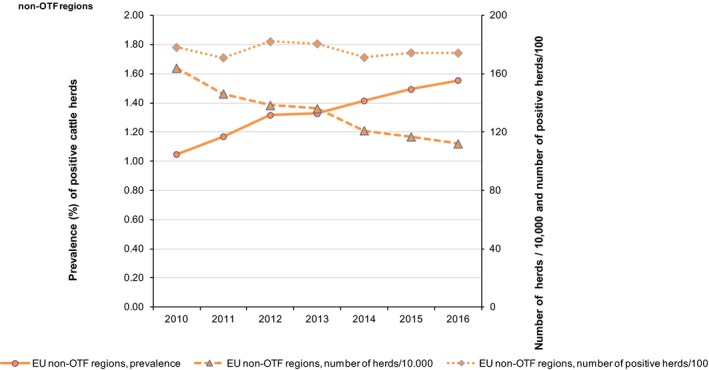
OTF : Officially bovine tuberculosis free in cattle.
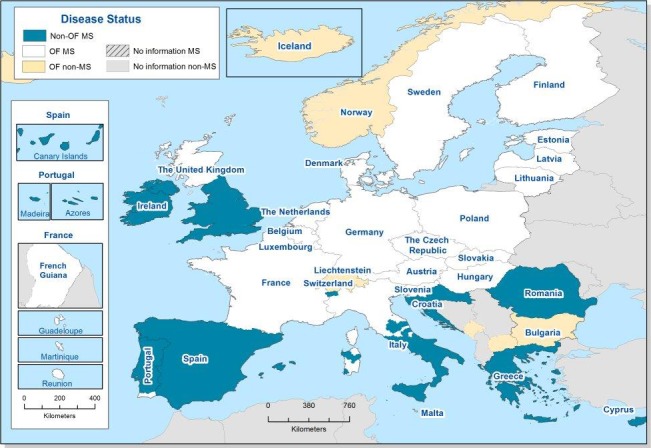
Source(s): Austria, Cyprus, the Czech Republic, Croatia, Estonia, Finland, France, Germany, Greece, Hungary, Iceland, Ireland, Italy, Latvia, Lithuania, Malta, the Netherlands, Norway, Poland, Portugal, Romania, Slovakia, Slovenia and Spain. Sweden. Belgium, Bulgaria, Luxembourg and the United Kingdom did not report data to the level of detail required for the analysis. Denmark does not have a surveillance system for this disease.
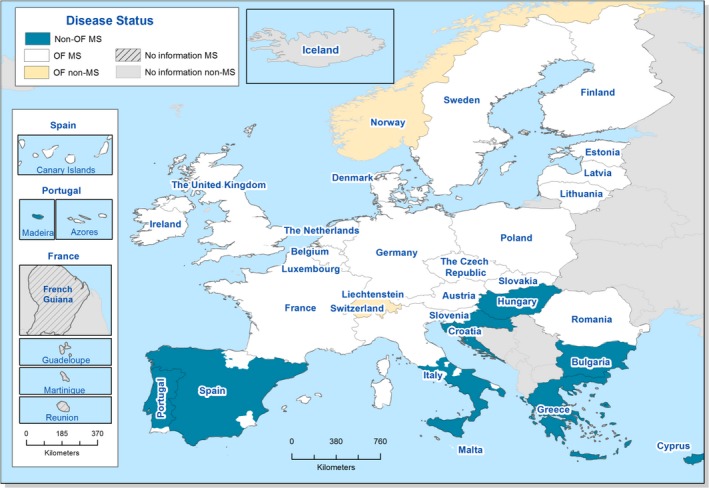
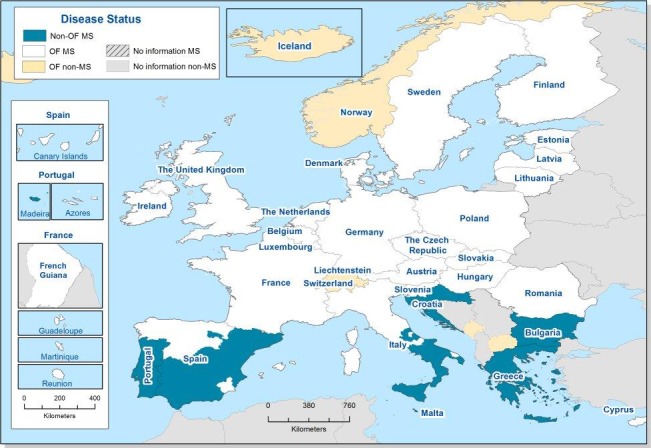
OF : Officially brucellosis free in cattle.
AL : Albania;BA : Bosnia and Herzegovina;FYRM : Former Yugoslav Republic of Macedonia;ME : Montenegro; andSR , Serbia.
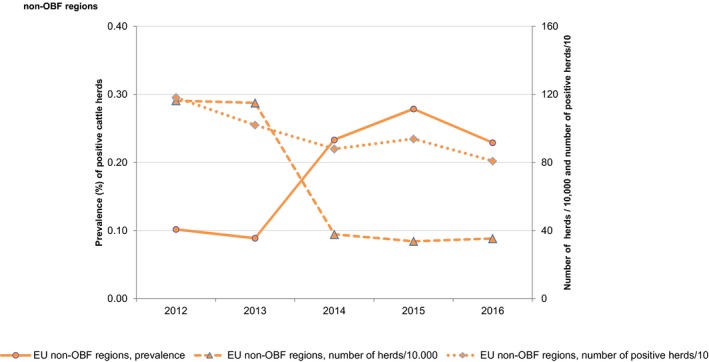
Non‐
OBF : Non‐officially brucellosis free in cattle.
OF : Officially B. melitensis free in sheep and goats.In France, all but one of the 96 metropolitan departments (due to Rev.1 vaccination against Brucella ovis) are ObmF and no cases of brucellosis have been reported in small ruminants since 2003.
Note.
AL : Albania;BA : Bosnia and Herzegovina;FYRM : Former Yugoslav Republic of Macedonia;ME : Montenegro; andSR : Serbia.
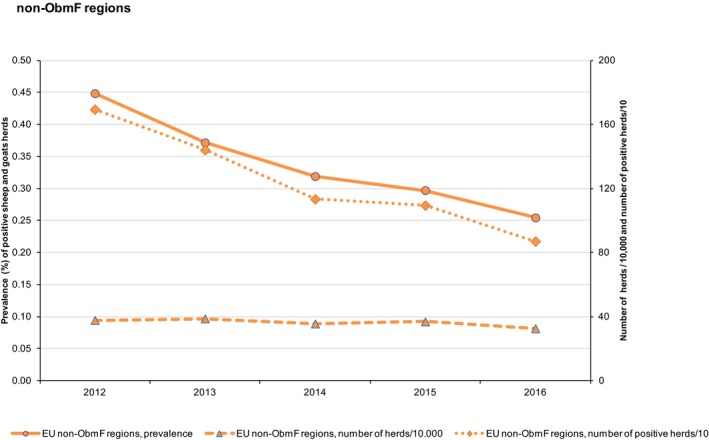
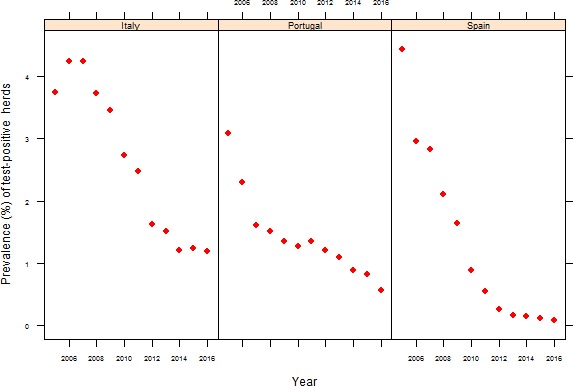
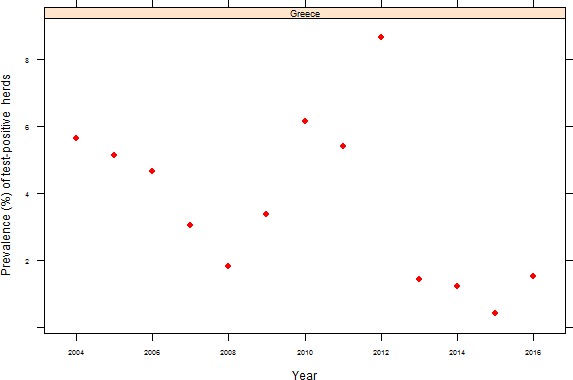
Non‐ObmF: Non‐officially B. melitensis free in sheep and goats.
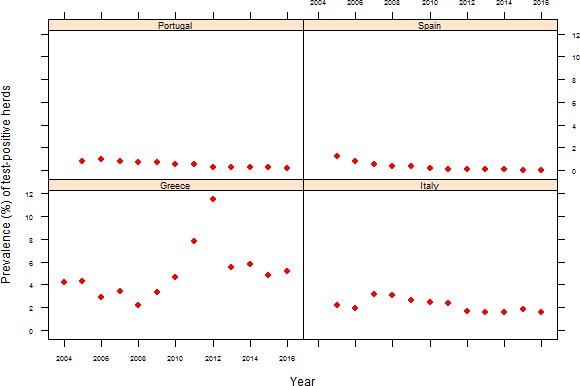
Note: During the final production stage of the present report, Greece informed that in mainland Greece where a control programme is implemented; of 20,569 sheep and goats herds tested with blood sampling in the vaccination zone (male animals only), 1,206 (5.9%) were positive, in 2016. The total number of animals tested serologically in the vaccination zone during was 124,770 and 2,294 (1.8%) were positive.
Source(s): Austria, Cyprus, the Czech Republic, Estonia, Finland, France, Greece, Hungary, Ireland, Latvia, Luxembourg, Malta, the Netherlands, Norway, Poland, Portugal, Romania, Slovakia, Slovenia, Sweden and the United Kingdom. Bulgaria, Croatia, Germany, Iceland, Italy, Lithuania and Spain did not report data to the level of detail required for the analysis. Belgium and Denmark do not have any formal surveillance system for the disease.
The results by Greece, reported in 2016, refer to samples taken between 2012 and 2015.
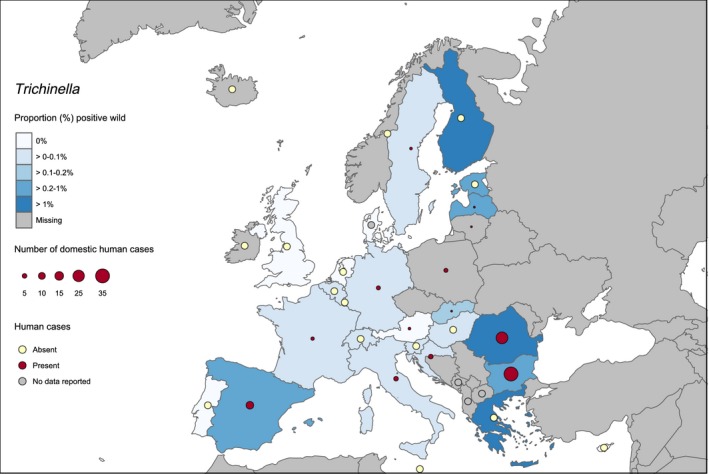
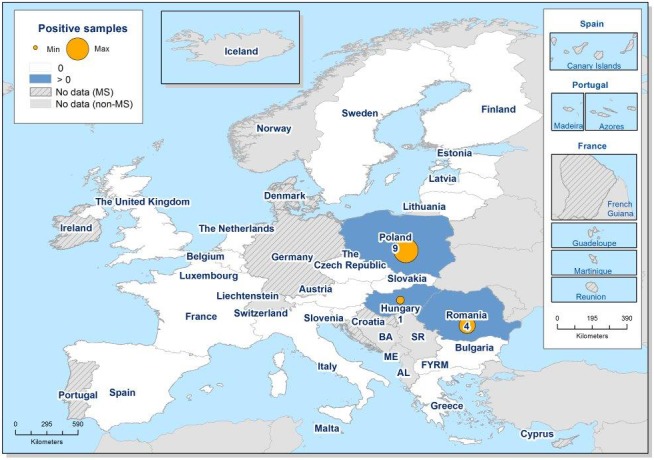
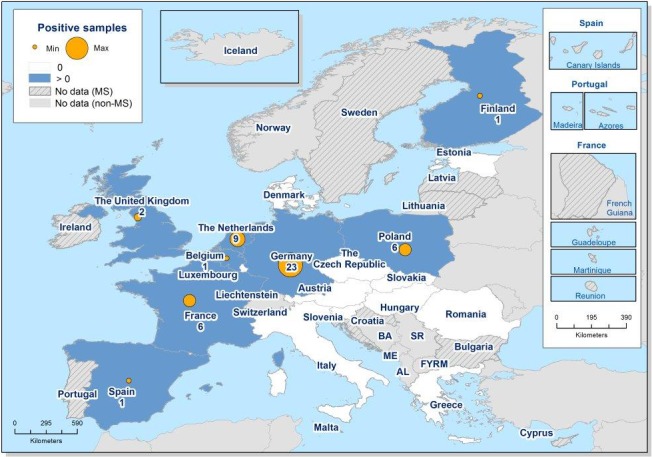
This distribution map has been built based on data from the International Trichinella Reference Centre (ITRC, online)
EFSA reports and published papers.
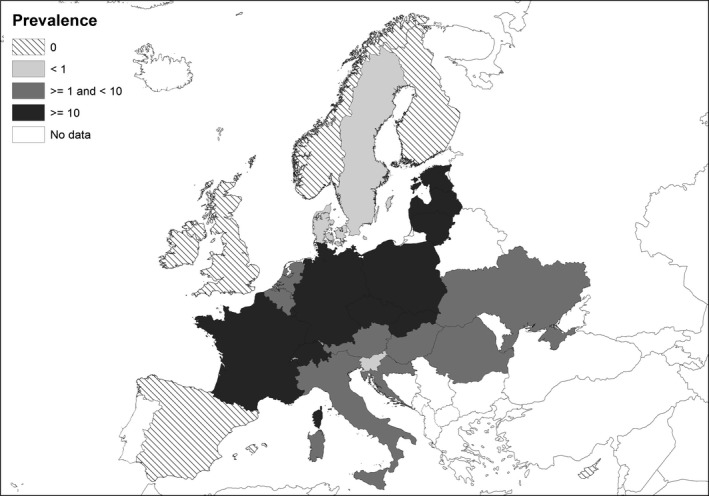
Map adopted from Oksanen et al. (2016) and based on studies performed between 2000 and 2016: the pooled prevalence of Echinococcus multilocularis on the main land of Norway is zero, however the pooled prevalence is 9% on the Svalbard islands due to Artic foxes. Prevalence data from Spain originated from single studies.
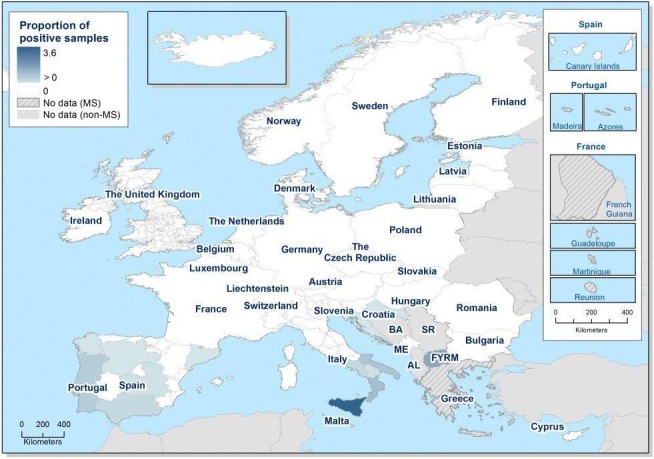
Source(s): Austria, Estonia, France, Germany, Hungary, Latvia, Lithuania, the Netherlands, Poland, Romania, Sweden, Slovakia and Slovenia. Belgium, Bulgaria, Croatia, Cyprus, the Czech Republic, Denmark, Finland, Greece, Iceland, Italy, Ireland, Luxembourg, Malta, Norway, Portugal, Spain and the United Kingdom did not report data to the level of detail required for the analysis.
Source(s): Austria, Estonia, Finland, Germany, Greece, Hungary, Ireland, Latvia, Lithuania, the Netherlands, Norway, Poland, Portugal, Romania, Slovakia, Slovenia, Spain, Sweden. Belgium, Bulgaria, Croatia, Cyprus, the Czech Republic, Denmark, France, Iceland, Italy, Luxembourg, Malta and the United Kingdom did not report data to the level of detail required for the analysis.
AL : Albania;BA : Bosnia and Herzegovina;FYRM : Former Yugoslav Republic of Macedonia;ME : Montenegro;SR : Serbia.
AL : Albania;BA : Bosnia and Herzegovina;FYRM : Former Yugoslav Republic of Macedonia;ME : Montenegro;SR : Serbia.
Source(s): Cyprus, the Czech Republic, Denmark, Estonia, Finland, France, Germany, Greece, Hungary, Iceland, Ireland, Latvia, Lithuania, Luxembourg, Malta, the Netherlands, Norway, Poland, Portugal, Romania, Slovakia, Slovenia, Spain, Sweden. Austria, Belgium, Bulgaria, Croatia, Italy, Switzerland and the United Kingdom did not report data to the level of detail required for the analysis.
Source(s): Austria, Belgium, Cyprus, the Czech Republic, Estonia, Finland, Greece, Hungary, Ireland, Italy, Latvia, Lithuania, Luxembourg, Malta, the Netherlands, Norway, Poland, Romania, Slovakia, Slovenia, Spain, Sweden, the United Kingdom. Bulgaria, Croatia, Denmark, France, Germany, Iceland and Portugal did not report data to the level of detail required for the analysis.
Source(s): Cyprus, the Czech Republic, Estonia, Finland, France, Germany, Greece, Hungary, Iceland, Ireland, Luxembourg, Latvia, Norway, Poland, Romania, Slovakia, Slovenia, Spain, Sweden and the United Kingdom. Austria, Belgium, Bulgaria, Croatia, Denmark, Italy, Lithuania, Malta, the Netherlands and Portugal did not report data to the level of detail required for the analysis.
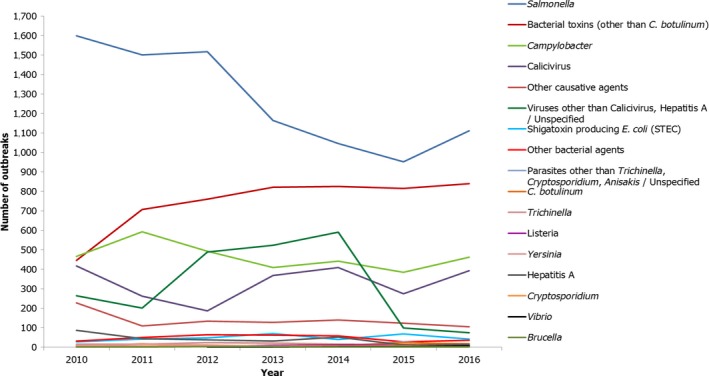
Other bacterial agents include Francisella, Enterococcus, enterotoxigenic E. coli (
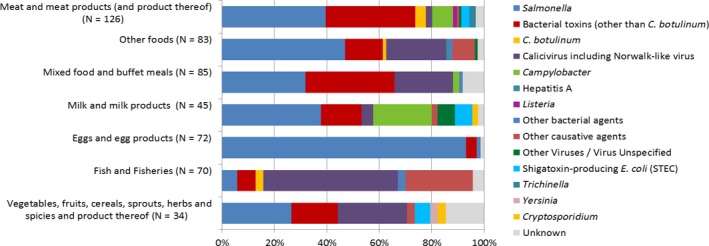
ETEC ), enteroinvasive E. coli (EIEC ), enteropathogenic E. coli (EPEC ), Shigella and other unspecified bacteria. Bacterial toxins other than Clostridium botulinum include toxins produced by Bacillus, Clostridium other than Clostridium botulinum and Staphylococcus and other unspecified bacterial toxins. Viruses other than calicivirus and hepatitis A virus include flavivirus, rotavirus and other unspecified viruses. Other causative agents include chemical agents, histamine, lectin, marine biotoxins, mushroom toxins and scombrotoxin. Parasites other than Trichinella and Cryptosporidium include Giardia and other unspecified parasites.
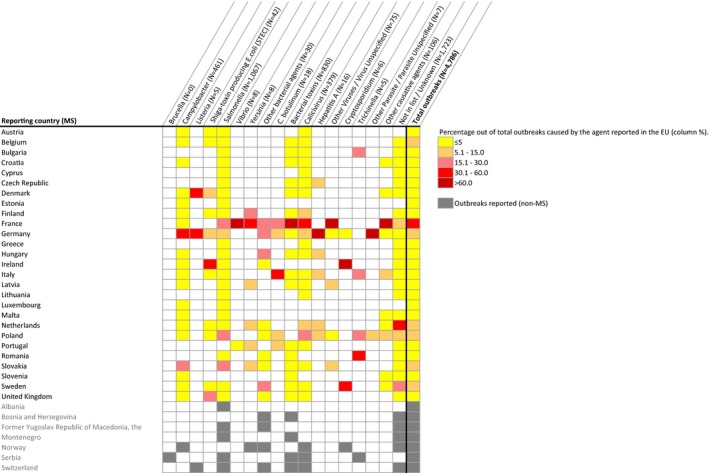
Other bacterial agents include Francisella, Enterococcus, Enterotoxigenic E. coli (
ETEC ), enteroinvasive E. coli (EIEC ), enteropathogenic E. coli (EPEC ), Streptococcus, Shigella and other unspecified bacteria. Other bacterial toxins include toxins produced by Bacillus, Clostridium other than Clostridium botulinum and Staphylococcus and other unspecified bacterial toxins. Other viruses include adenovirus, flavivirus, rotavirus and other unspecified viruses. Other causative agents include chemical agents, histamine, lectin, marine biotoxins, mushroom toxins and scombrotoxin. Other parasites include Giardia and other unspecified parasites.Percentage out of total outbreaks caused by the agent reported in theEU (column %): Grey boxes indicate reporting by non‐MS .
Other bacterial agents include Francisella, Enterococcus, enterotoxigenic E. coli (
ETEC ), enteroinvasive E. coli (EIEC ), enteropathogenic E. coli (EPEC ), Streptococcus, Shigella and other unspecified bacteria. Other bacterial toxins include toxins produced by Bacillus, Clostridium other than Clostridium botulinum and Staphylococcus and other unspecified bacterial toxins. Other viruses include adenovirus, flavivirus, rotavirus and other unspecified viruses. Other causative agents include chemical agents, histamine, lectin, marine biotoxins, mushroom toxins and scombrotoxin. Other parasites include Giardia and other unspecified parasites.
Bacterial toxins other than Clostridium botulinum include toxins produced by Bacillus, Clostridium other than Clostridium botulinum and Staphylococcus and other unspecified bacterial toxins. Other causative agents include chemical agents, histamine, lectin, marine biotoxins, mushroom toxins and scombrotoxin.
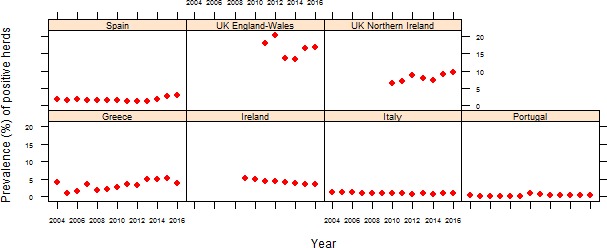
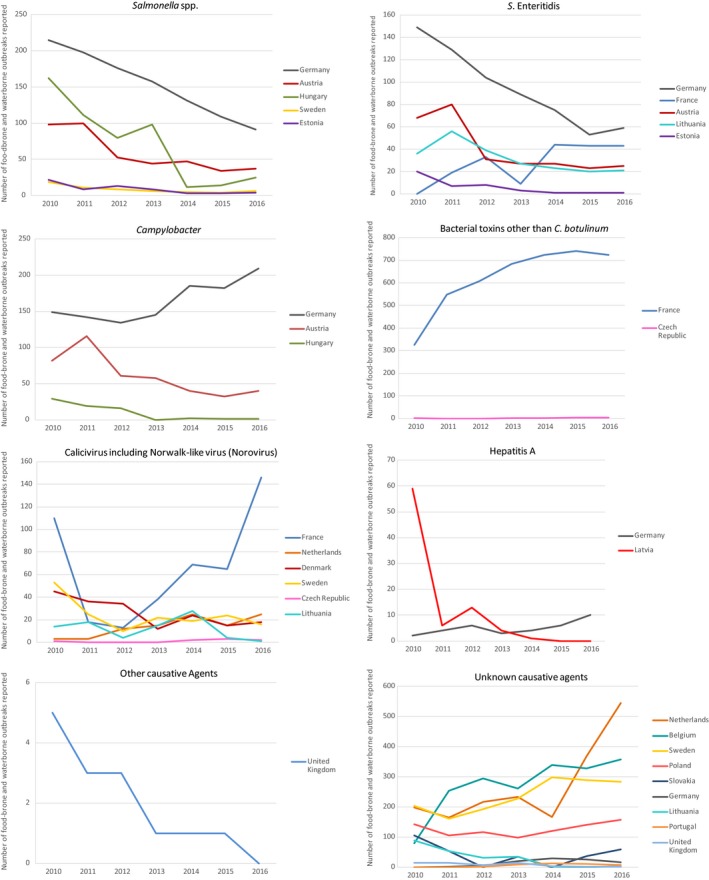
Only
MS with statistically significant trends (either increasing or decreasing) over years are shown.
Ten strong‐evidence outbreaks with food vehicle ‘unknown’ are not shown in the figure. Other bacterial agents include Shigella and other unspecified bacteria. Bacterial toxins include toxins produced by Bacillus, Clostridium other than Clostridium botulinum and Staphylococcus and other unspecified bacterial toxins. Other viruses include flavivirus and other unspecified viruses. Other causative agents include ciguatoxin and other unspecified toxins.
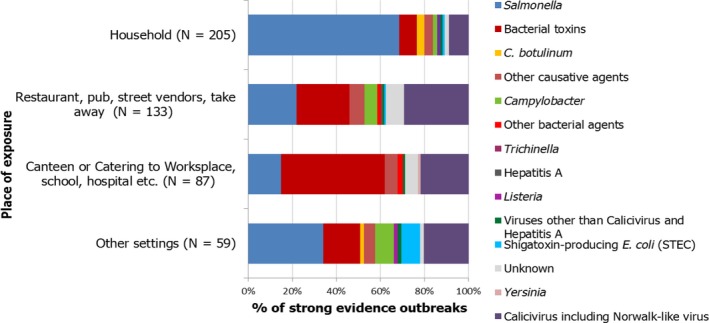
Thirty‐seven food‐borne‐outbreaks with setting ‘unknown’ are not shown in the figure. Other setting include: Camp or picnic, farm, multiple places of exposure in more than one country, multiple places of exposure in one country, temporary mass catering (fairs or festivals), other unspecified settings.
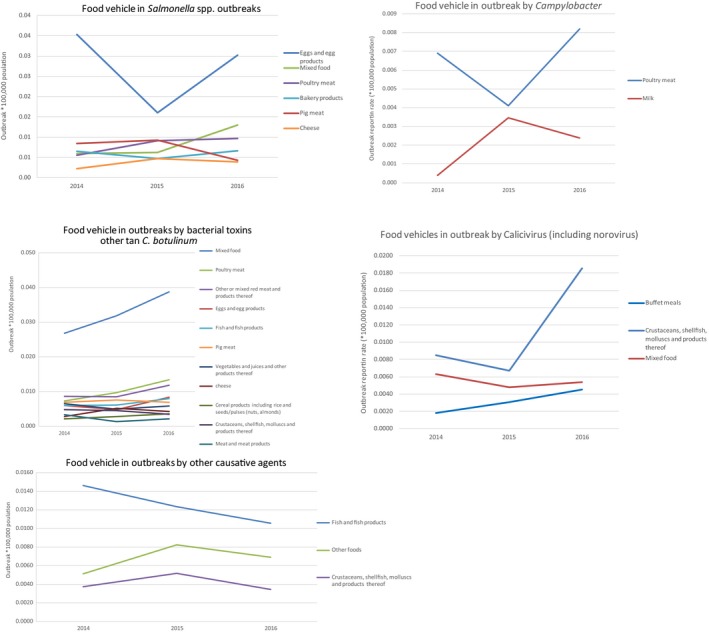
Only combinations with at least 10 outbreaks reported per year are shown. Food vehicles reported as ‘Unspecified’ and those classified as ‘Other Foods’ are not shown.
References
-
- Alban L, Pozio E, Boes J, Boireau P, Boue F, Claes M, Cook AJC, Dorny P, Enemark HL, van der Giessen J, Hunt KR, Howell M, Kirjusina M, Noeckler K, Rossi P, Smith GC, Snow L, Taylor MA, Theodoropoulos G, Vallee I, Viera‐Pinto MM and Zimmer IA, 2011. Towards a standardised surveillance for Trichinella in the European Union. Preventive Veterinary Medicine, 99, 148–160. - PubMed
-
- Bacci C, Vismarra A, Passeri B, Sciarrone F, Mangia C, Genchi M, Fabbi M, Vicari N, Bruini I, Brindani F and Kramer L, 2016. Detection of Toxoplasma gondii and Sarcocystis tenella in indigenous Cornigliese sheep in Italy using serological and molecular methods. Small Ruminant Research, 135, 13–16.
-
- Bayarri S, Gracia MJ, Pérez‐Arquillué C, Lázaro R and Herrera A, 2012. Toxoplasma gondii in commercially available pork meat and cured ham: a contribution to risk assessment for consumers. Journal of Food Protection, 75, 597–600. - PubMed
LinkOut - more resources
Full Text Sources
Miscellaneous