

The European Union summary report on antimicrobial resistance in zoonotic and indicator bacteria from humans, animals and food in 2015
- PMID: 32625402
- PMCID: PMC7009883
- DOI: 10.2903/j.efsa.2017.4694
The European Union summary report on antimicrobial resistance in zoonotic and indicator bacteria from humans, animals and food in 2015
Abstract
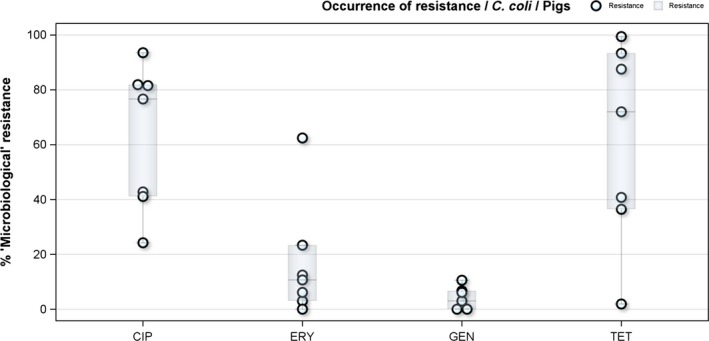
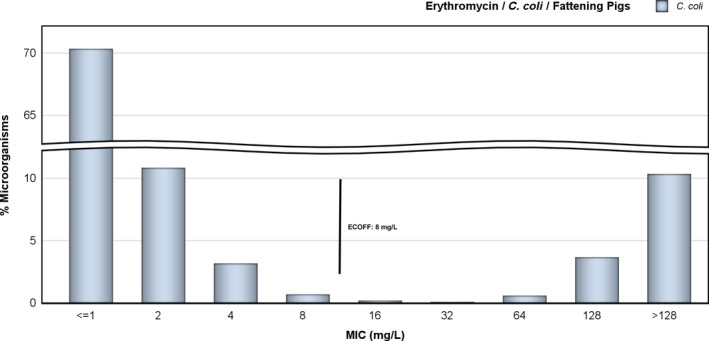
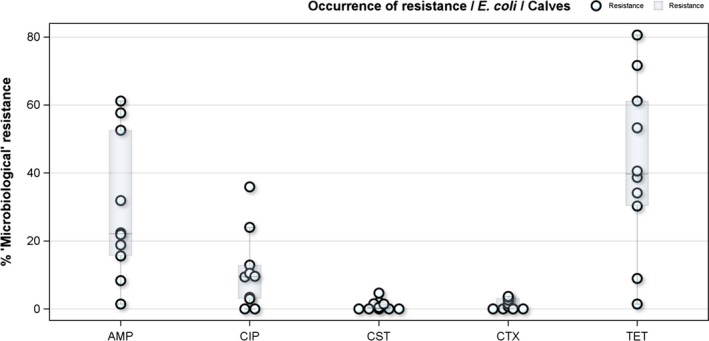
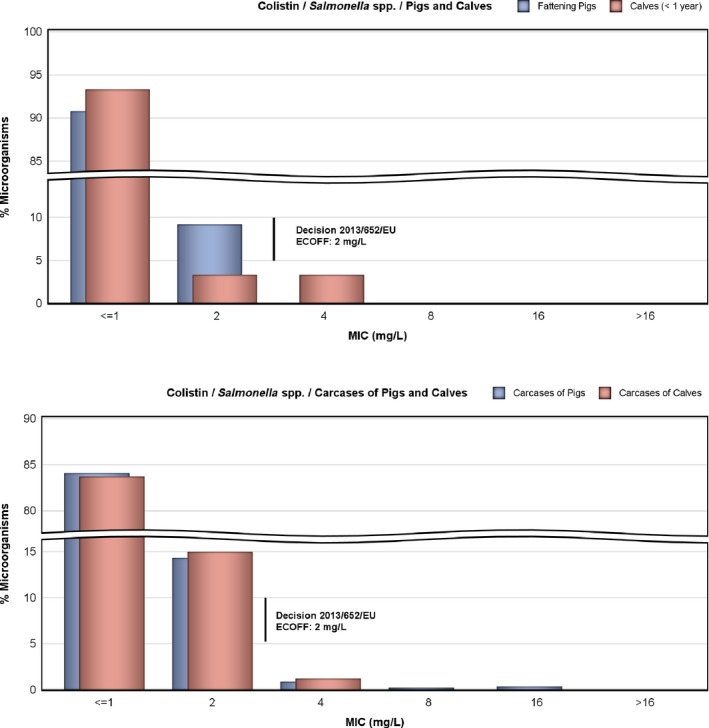
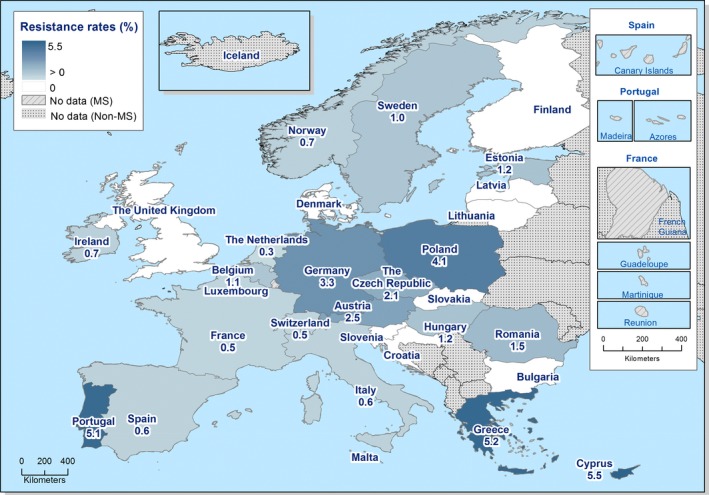
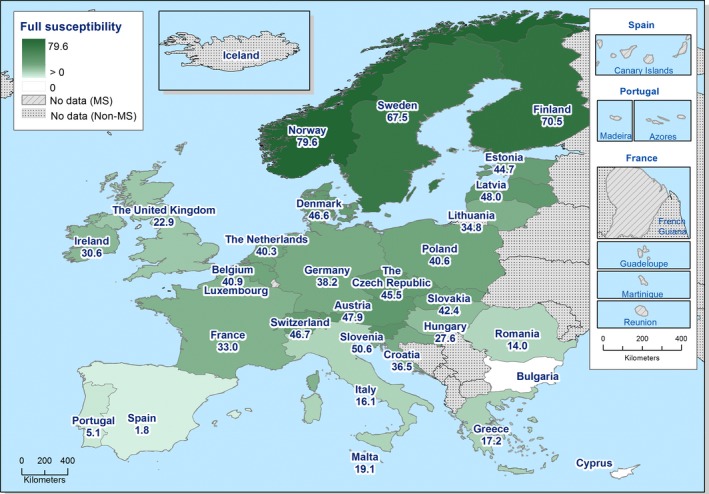
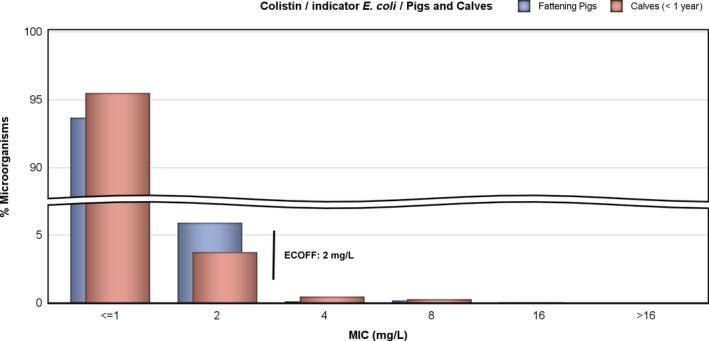
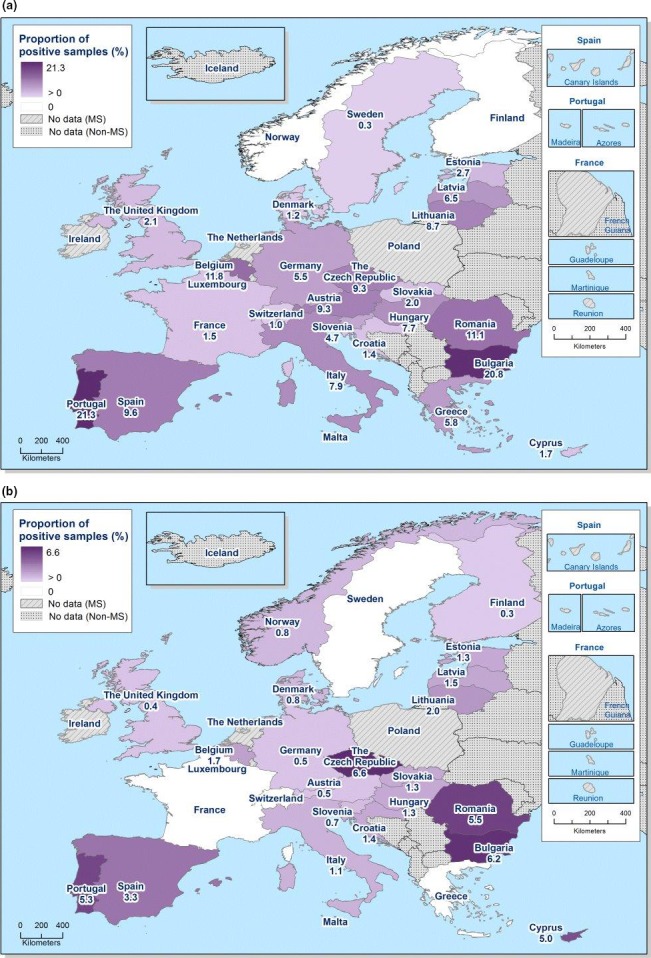
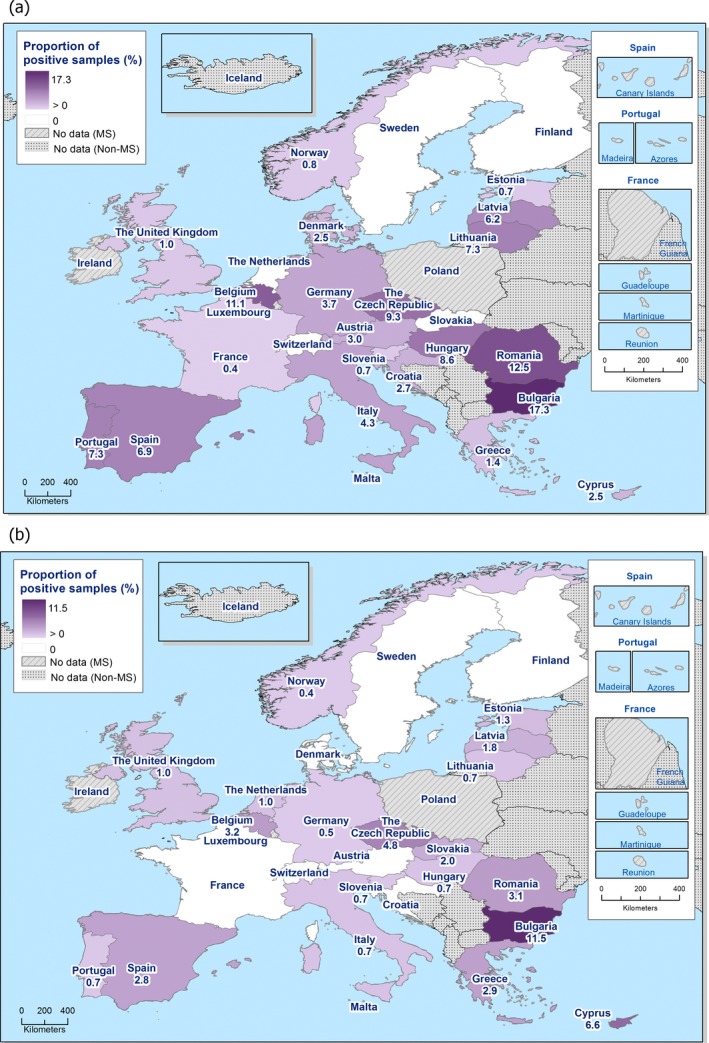
The data on antimicrobial resistance in zoonotic and indicator bacteria in 2015, submitted by 28 EU Member States (MSs), were jointly analysed by EFSA and ECDC. Resistance in zoonotic Salmonella and Campylobacter from humans, animals and food, and resistance in indicator Escherichia coli as well as meticillin-resistant Staphylococcus aureus in animals and food were addressed. 'Microbiological' resistance was assessed using epidemiological cut-off (ECOFF) values; for some countries, qualitative data on human isolates were interpreted in a way which corresponds closely to the ECOFF-defined 'microbiological' resistance. In Salmonella from humans, high proportions of isolates were resistant to ampicillin, sulfonamides and tetracyclines, whereas resistance to third-generation cephalosporins was low. In Salmonella and Escherichia coli isolates from fattening pigs and calves under one year of age, resistance to ampicillin, tetracyclines and sulfonamides was frequently detected, whereas resistance to third-generation cephalosporins was uncommon. For the first time, presumptive extended-spectrum beta-lactamase (ESBL)-/AmpC-/carbapenemase-production in Salmonella and Escherichia coli was monitored in humans (Salmonella), meat (pork and beef), fattening pigs and calves. Varying occurrence/prevalence rates of ESBL-/AmpC-producers were observed between countries, and carbapenemase-producing Escherichia coli were detected in single samples of pig meat and from fattening pigs from two MSs. Resistance to colistin was observed at low levels in Salmonella and Escherichia coli from fattening pigs and calves under one year of age and meat thereof. In Campylobacter from humans, high to extremely high proportions of isolates were resistant to ciprofloxacin and tetracyclines, particularly in C. coli. In a few countries, a third to half of C. coli in humans were resistant also to erythromycin, leaving few options for treatment of severe Campylobacter infections. High resistance to ciprofloxacin and tetracyclines was observed in C. coli isolates from fattening pigs, whereas much lower levels were recorded for erythromycin. Co-resistance to critically important antimicrobials in both human and animal isolates was generally uncommon.
Keywords: ESBL; antimicrobial resistance; indicator bacteria; zoonotic bacteria.
© 2017 European Food Safety Authority and European Centre for Disease Prevention and Control.
Figures
N: total number of isolates tested for susceptibility against the whole common antimicrobial.


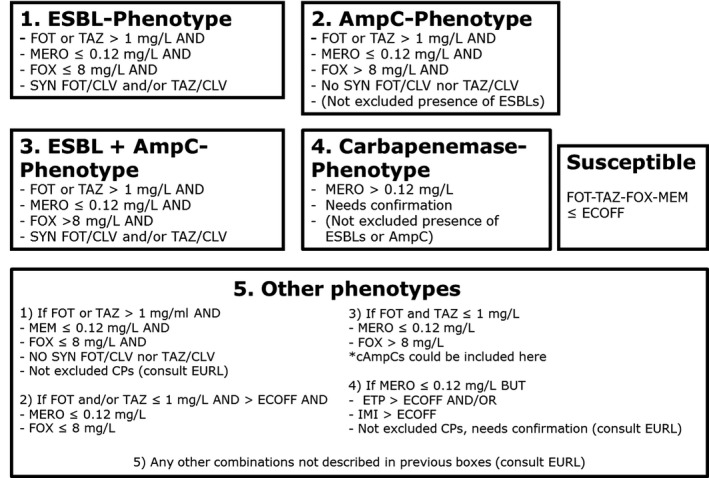
Presumptive ESBL‐producers include isolates exhibiting Phenotype 1 or 3.
Presumptive AmpC‐producers include isolates exhibiting Phenotype 2 or 3.
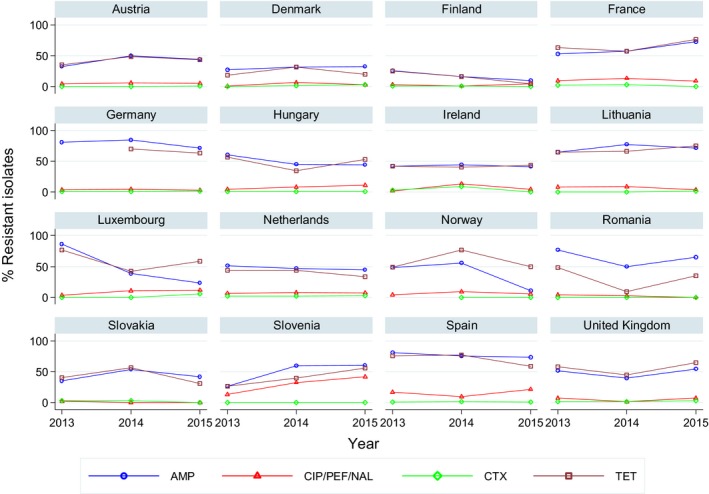
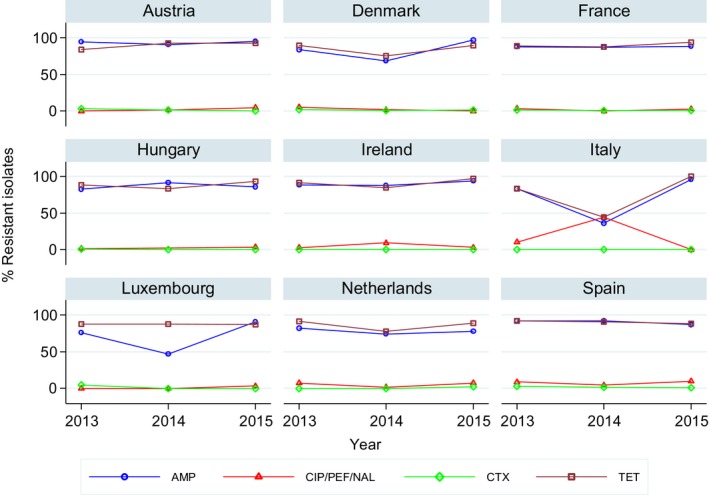
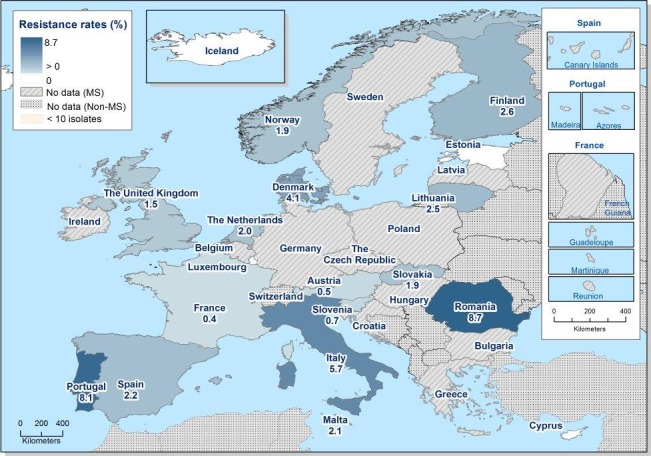
Statistically significant increasing trends over 3 years, as tested by logistic regression (p ≤ 0.05), were observed for ciprofloxacin in Hungary and Slovenia (↑), for ampicillin in Austria, France and Slovenia (↑) and for tetracyclines in Austria, France, Norway and Slovenia (↑). Statistically significant decreasing trends over 3 years were observed for ampicillin in Finland, Germany, Hungary, Luxembourg and Norway (↓) and for tetracyclines in Finland, Germany, Hungary, the Netherlands and Spain (↓). Only countries testing at least 10 isolates per year were included in the analysis.
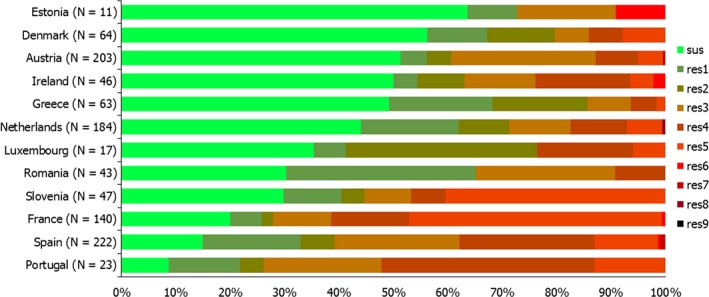
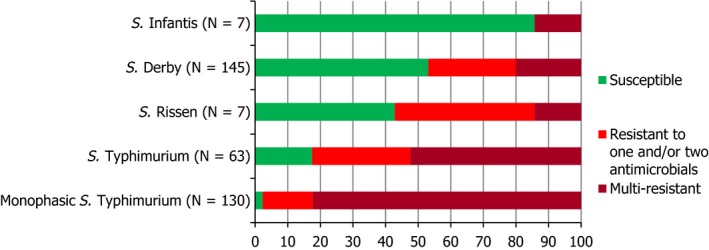
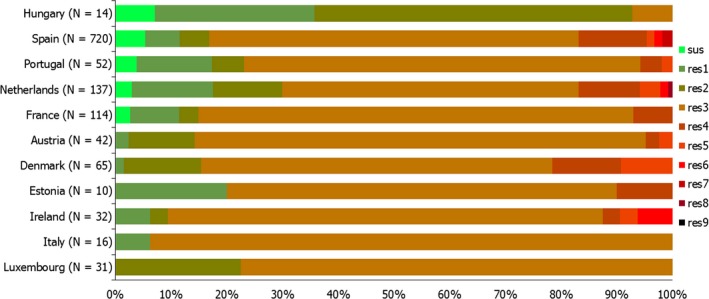
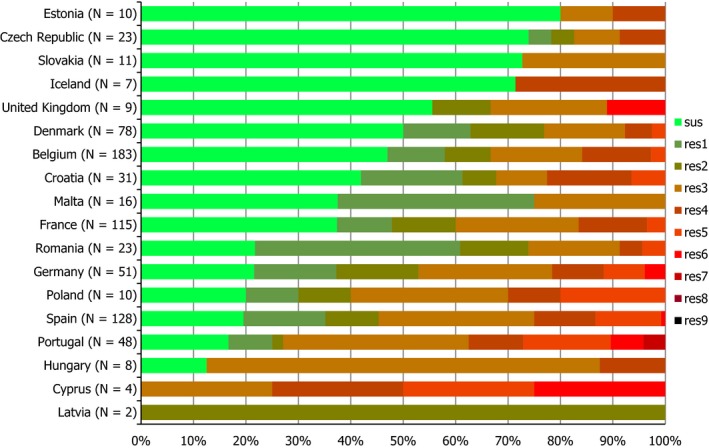
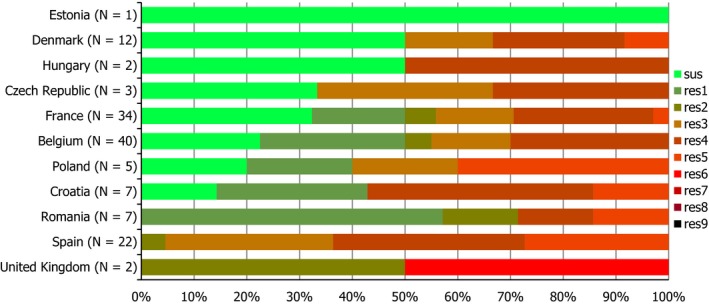
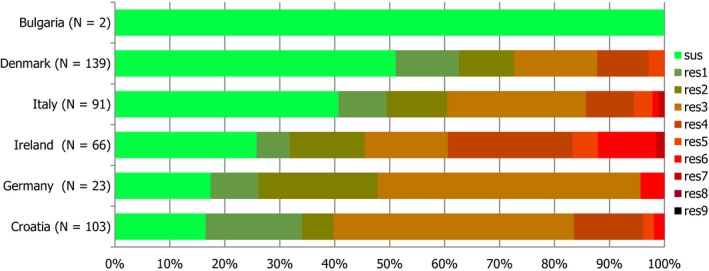
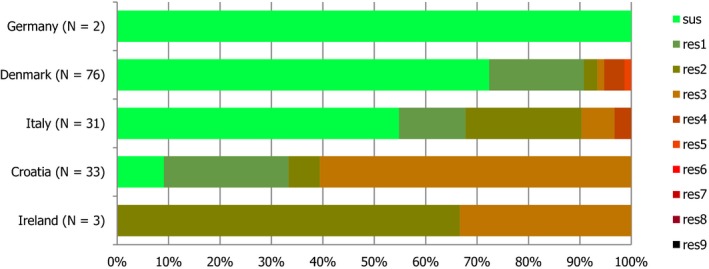
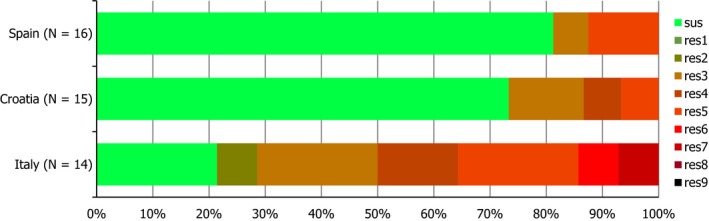
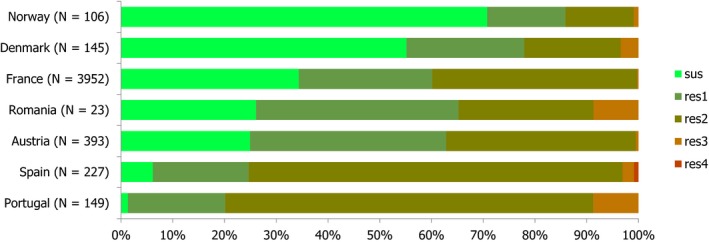
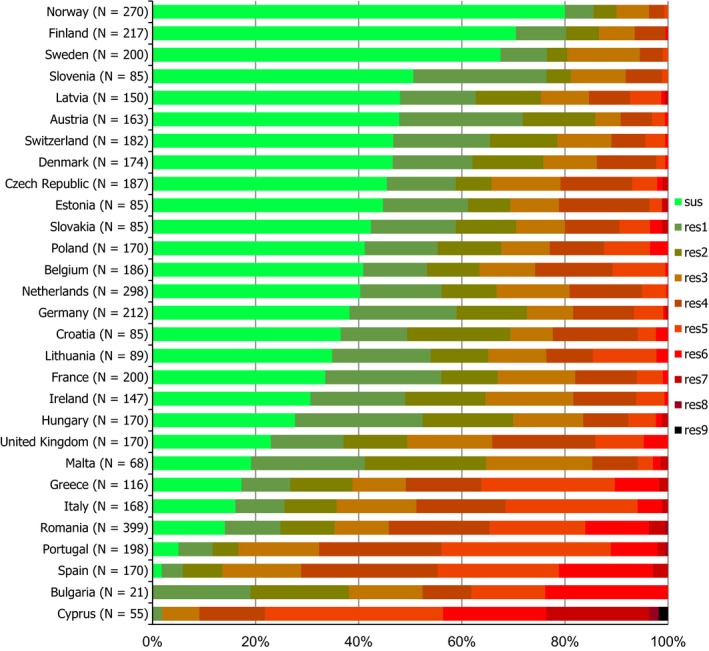
N: total number of isolates tested for susceptibility against the whole common antimicrobial set for Salmonella; sus: susceptible to all antimicrobial classes of the common set for Salmonella; res1–res9: resistance to one up to nine antimicrobial classes of the common set for Salmonella.
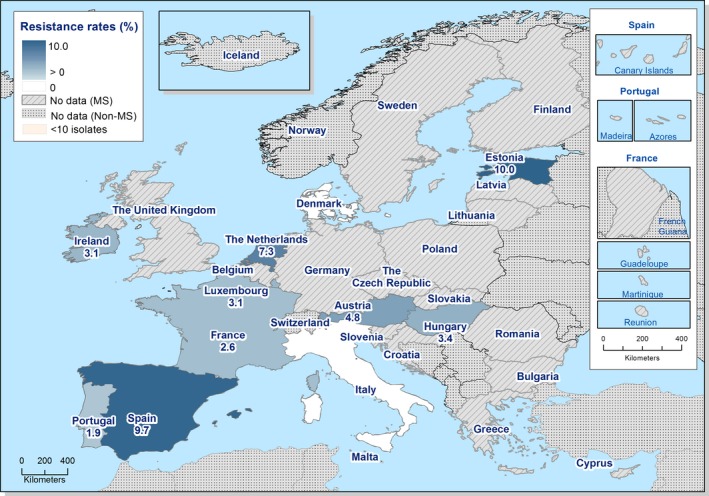
A statistically significant increasing trend over 3 years, as tested by logistic regression (p ≤ 0.05), was observed for ampicillin in Denmark (↑). Statistically significant decreasing trends over 3 years were observed for ampicillin, cefotaxime and tetracycline in Spain (↓). Only countries testing at least 10 isolates per year were included in the analysis.
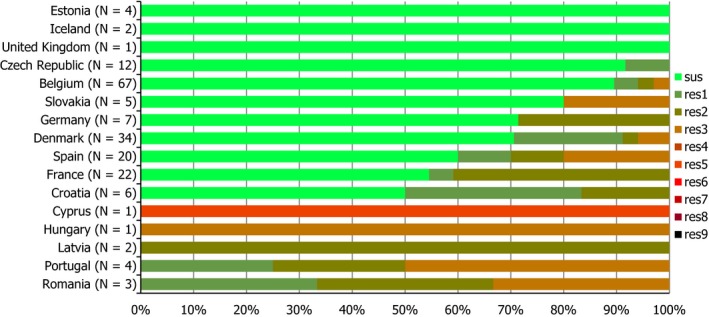
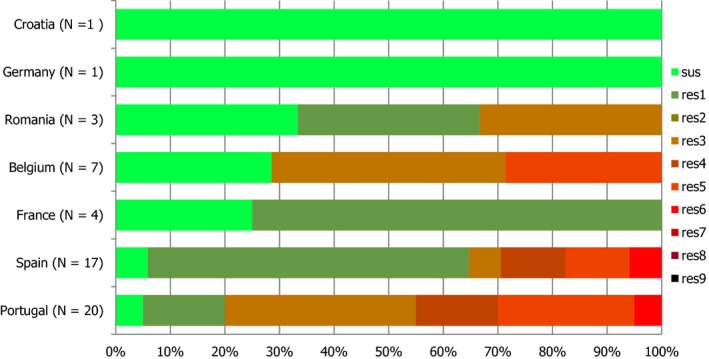
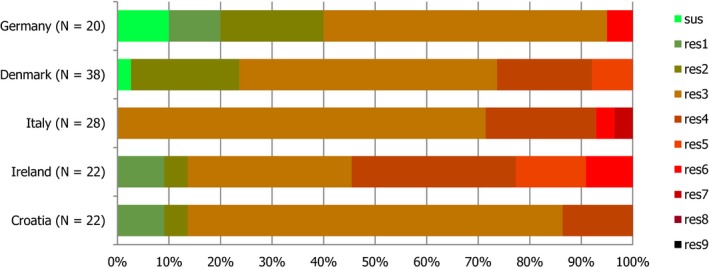
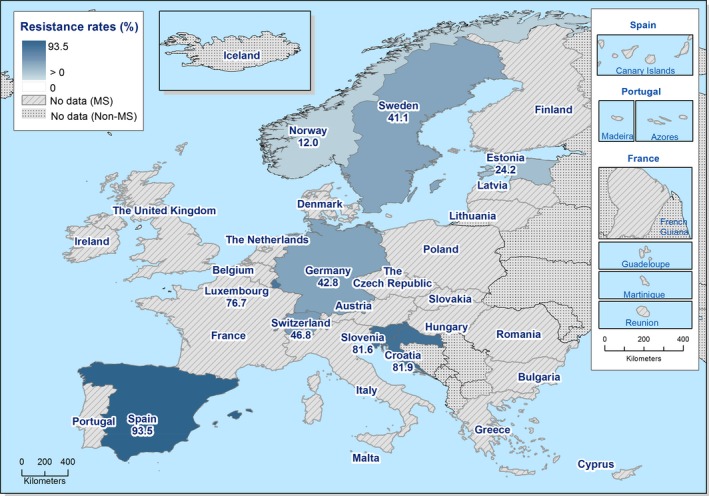
N: total number of isolates tested for susceptibility against the whole common antimicrobial set for Salmonella; sus: susceptible to all antimicrobial classes of the common set for Salmonella; res1–res9: resistance to one up to nine antimicrobial classes of the common set for Salmonella.
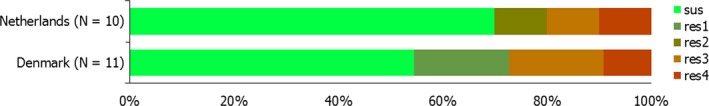
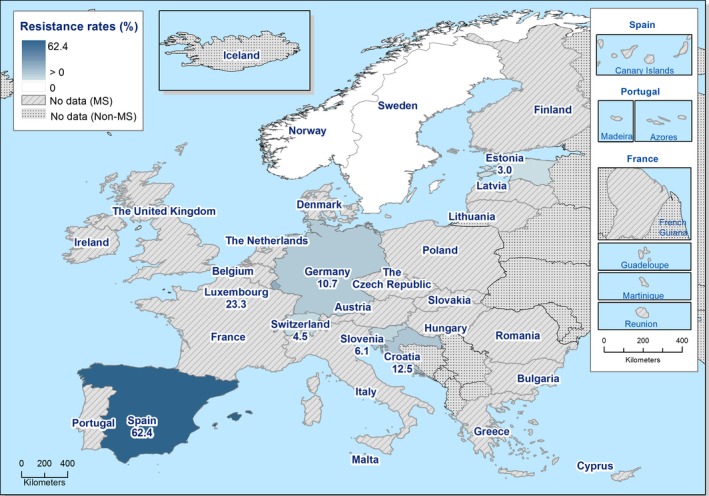
N: total number of isolates tested for susceptibility against the whole common antimicrobial set for Salmonella; sus: susceptible to all antimicrobial classes of the common set for Salmonella; res1–res9: resistance to one up to nine antimicrobial classes of the common set for Salmonella.
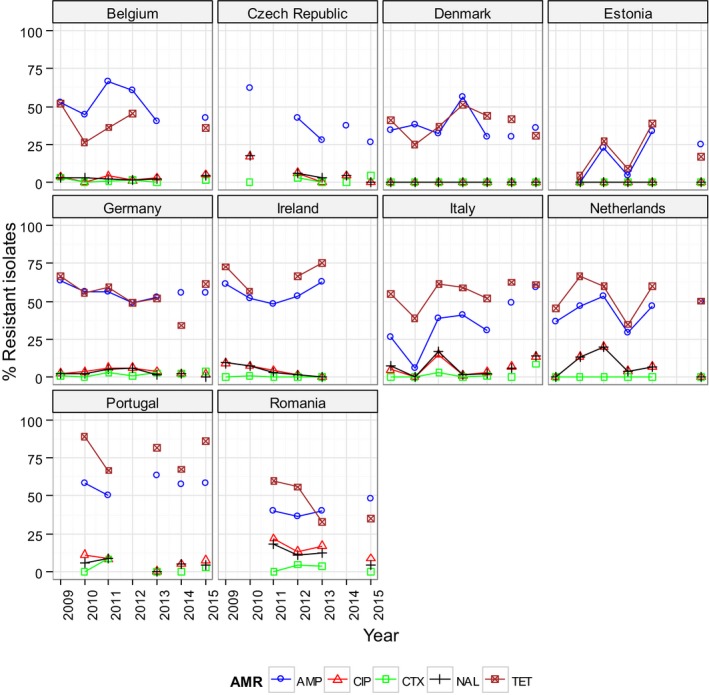
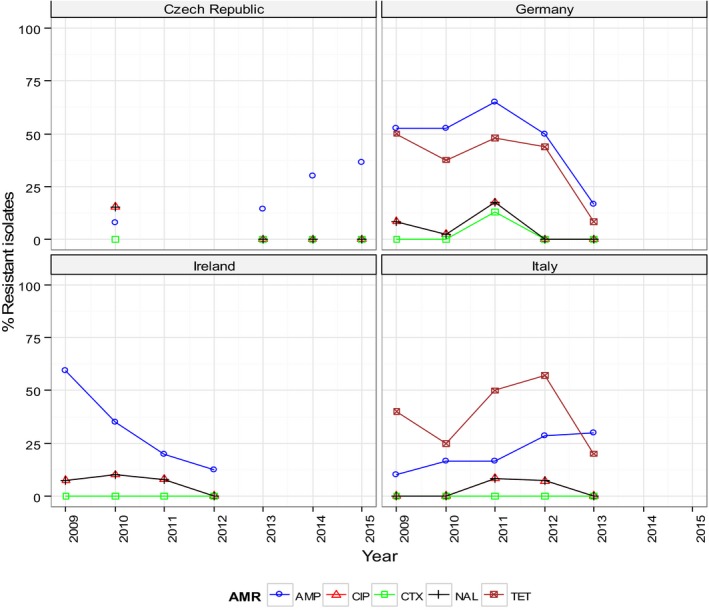
A statistically significant trend for 5 or more years, as tested by a logistic regression model (p ≤ 0.05), was observed in Ireland (↓) for both ciprofloxacin and nalidixic acid, for ampicillin in Belgium (↓), Germany (↓) and Italy(↑), for cefotaxime in Belgium (↓), Germany (↑) and Italy (↑), in Germany (↓) for nalidixic acid, and in Belgium (↓) and Germany (↓) for tetracycline.
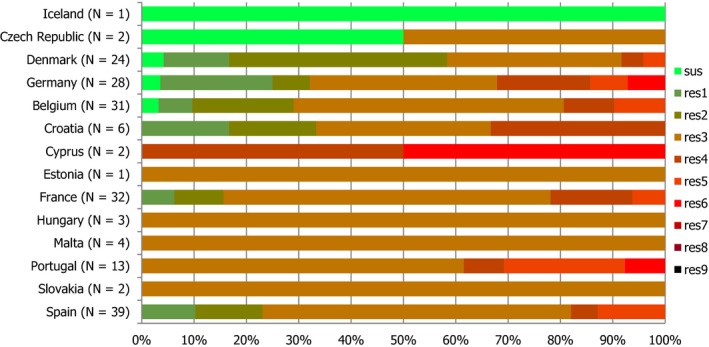
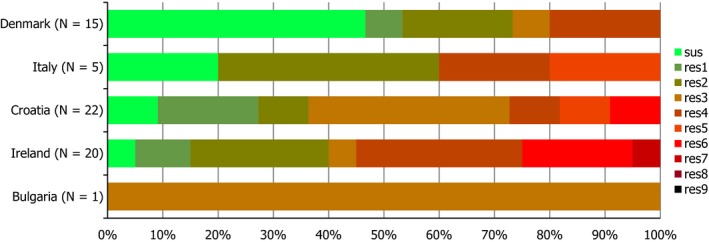
N: total number of isolates tested for susceptibility against the whole harmonised set of antimicrobials for Salmonella; sus: susceptible to all antimicrobial classes of the harmonised set of antimicrobials for Salmonella; res1–res9: resistance to one up to nine antimicrobial classes of the harmonised set for Salmonella.
N: total number of isolates tested for susceptibility against the whole harmonised set of antimicrobials for Sallmonella sus: susceptible to all antimicrobial classes of the harmonised set for Salmonella; res1–res9: resistance to one up to nine antimicrobial classes of the harmonised set for Salmonella.
N: total number of isolates tested for susceptibility against the whole harmonised set of antimicrobials for Salmonella; sus: susceptible to all antimicrobial classes of the harmonised set for Salmonella; res1–res9: resistance to one up to nine antimicrobial classes of the harmonised set for Salmonella.
N: total number of isolates tested for susceptibility against the whole harmonised sef of antimicrobials for Salmonella; sus: susceptible to all antimicrobial classes of the harmonised set for Salmonella; res1–res9: resistance to one up to nine antimicrobial classes of the harmonised set for Salmonella.
N: total number of isolates tested for susceptibility against the whole harmonised sef of antimicrobials for Salmonella; sus: susceptible to all antimicrobial classes of the harmonised set for Salmonella; res1–res9: resistance to one up to nine antimicrobial classes of the harmonised set for Salmonella.
A statistically significant trend for 5 or more years, as tested by a logistic regression model (p ≤ 0.05), was observed in the Germany (↓) for ampicillin.
N: total number of isolates tested for susceptibility against the whole harmonised set of antimicrobials for Salmonella; sus: susceptible to all antimicrobial classes of the harmonised set for Salmonella; res1–res9: resistance to one up to nine antimicrobial classes of the harmonised set for Salmonella.
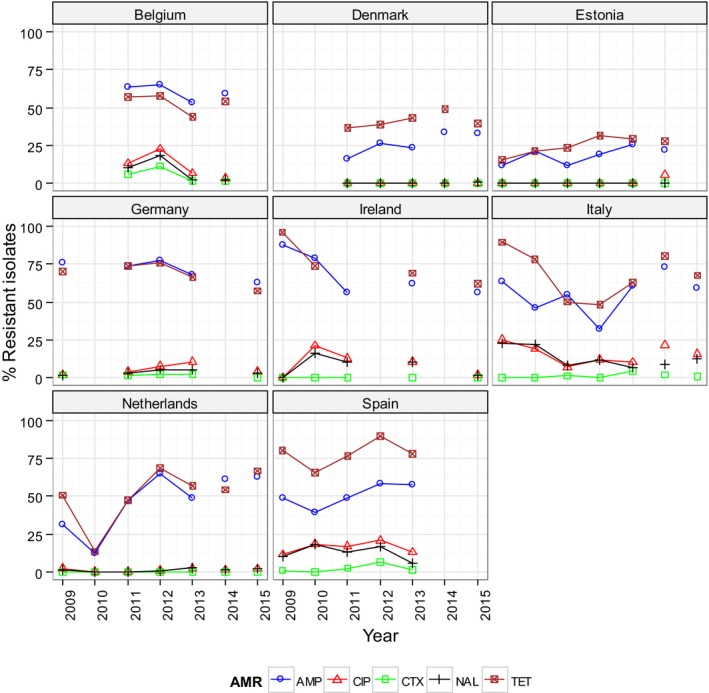
A statistically significant trend for 5 or more years, as tested by a logistic regression model (p ≤ 0.05), was observed in the Italy (↓) for both ciprofloxacin and nalidixic acid, for ampicillin in the Netherlands(↑), for ciprofloxacin in Estonia(↑), for cefotaxime in Italy (↑), and for tetracycline in Italy (↓) and the Netherlands (↑).
N: total number of isolates tested for susceptibility against the whole harmonised set of antimicrobials for Salmonella; sus: susceptible to all antimicrobial classes of the harmonised set for Salmonella; res1–res9: resistance to one up to nine antimicrobial classes of the harmonised set for Salmonella.
N: total number of isolates tested for susceptibility against the whole harmonised set of antimicrobials for Salmonella; sus: susceptible to all antimicrobial classes of the harmonised set for Salmonella; res1–res9: resistance to one up to nine antimicrobial classes of the harmonised set for Salmonella.
N: total number of isolates tested for susceptibility against the whole harmonised set of antimicrobials for Salmonella; sus: susceptible to all antimicrobial classes of the harmonised set for Salmonella; res1–res9: resistance to one up to nine antimicrobial classes of the harmonised set for Salmonella.
N: total number of isolates tested for susceptibility against the whole harmonised set of antimicrobials for Salmonella; sus: susceptible to all antimicrobial classes of the harmonised set for Salmonella; res1–res9: resistance to one up to nine antimicrobial classes of the harmonised set for Salmonella.
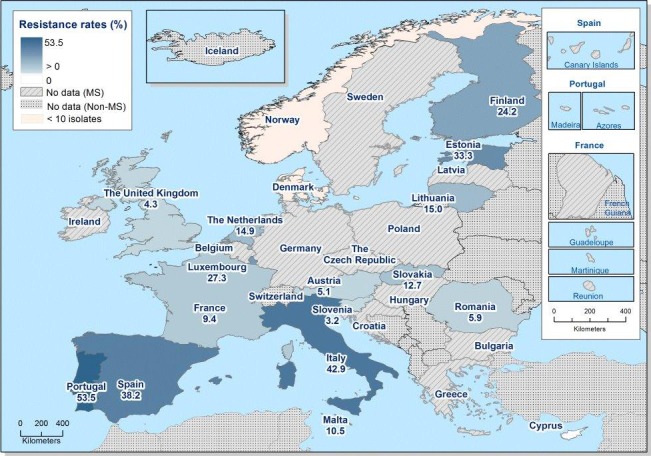
Statistically significant increasing trends over 3 years, as tested by logistic regression (p ≤ 0.05), were observed for ciprofloxacin in Austria and Slovenia (↑). Statistically significant decreasing trends over 3 years were observed for erythromycin in France and Malta (↓). Only countries testing at least 10 isolates per year were included in the analysis.
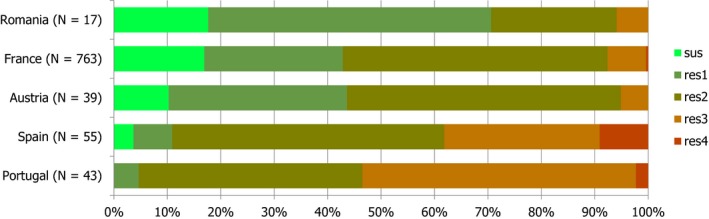
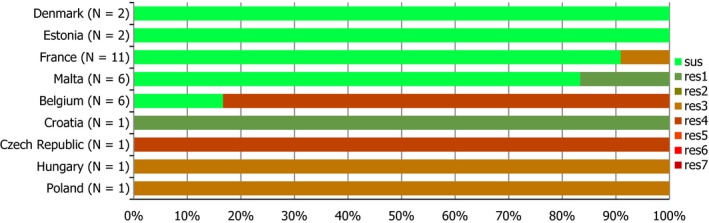
N: total number of isolates tested for susceptibility against the whole harmonised set of antimicrobials for Campylobacter; sus: susceptible to all antimicrobial classes of the harmonised set for Campylobacter; res1‐res4: resistance to one up to four antimicrobial classes of the harmonised set for Campylobacter.
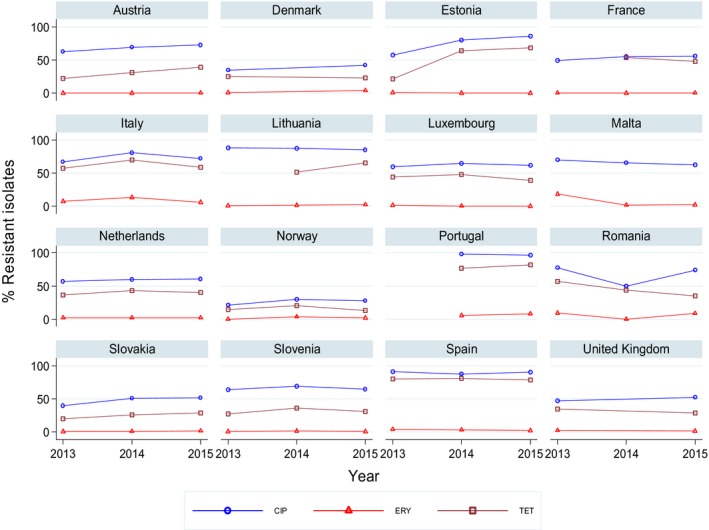
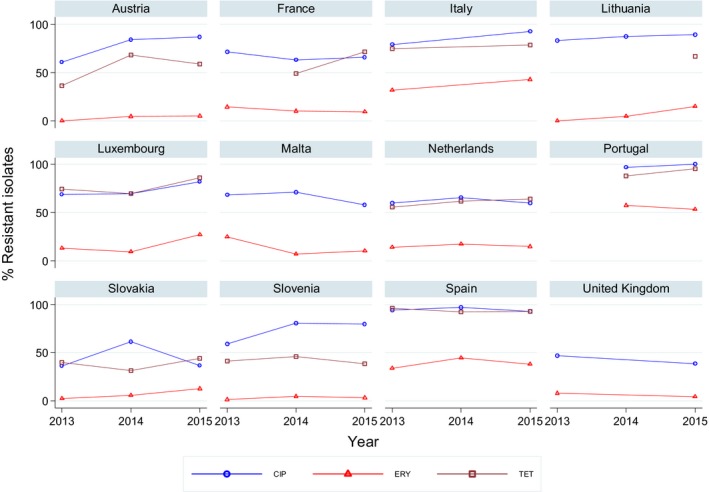
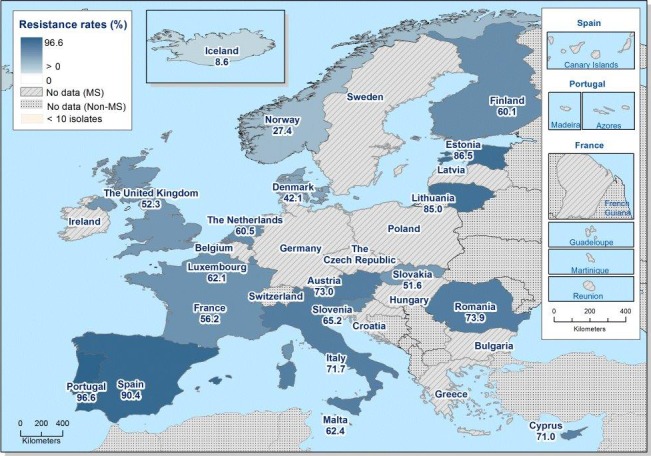
Statistically significant increasing trends over 3 years, as tested by logistic regression (p ≤ 0.05), were observed for ciprofloxacin in Austria, Estonia, France, the Netherlands and Slovakia (↑), for erythromycin in Slovakia (↑) and for tetracycline in Austria, Estonia, Italy, the Netherlands and Slovakia (↑). Statistically significant decreasing trends over 3 years were observed for erythromycin in Luxembourg and Malta (↓). Only countries testing at least 10 isolates per year were included in the analysis.
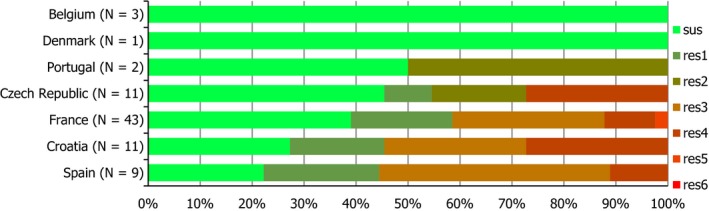
N: total number of isolates tested for susceptibility against the whole harmonised set of antimicrobials for Campylobacter; sus: susceptible to all antimicrobial classes of the harmonised set for Campylobacter; res1‐res4: resistance to one up to four antimicrobial classes of the harmonised set for Campylobacter.

Statistical significance of temporal trends over 5 or more years was assessed by using a logistic regression model (p ≤ 0.05).
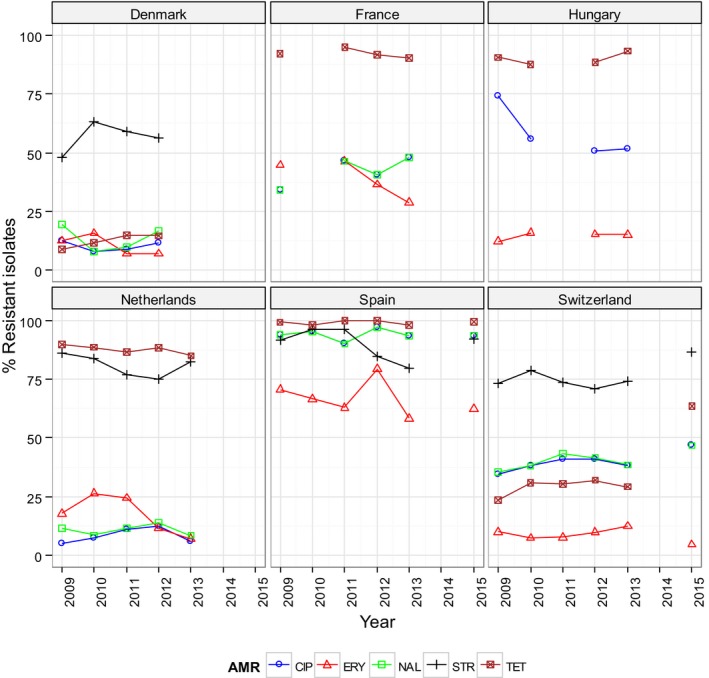
Statistically significant increasing trends were observed for ciprofloxacin in France (↑) and Switzerland (↑), and for streptomycin and tetracycline in Switzerland (↑).
Statistically significant decreasing trends were observed for erythromycin and streptomycin in the Netherlands (↓).
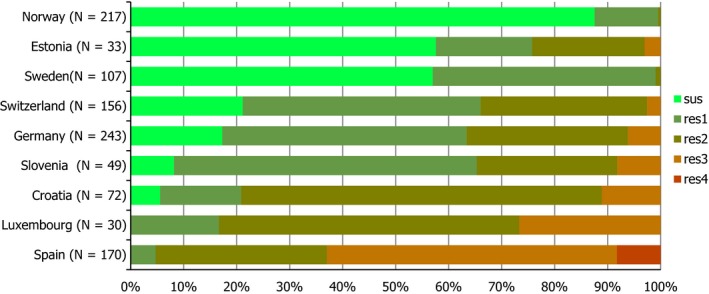
N: total number of isolates tested for susceptibility against the whole harmonised set of antimicrobials for Campylobacter; sus: susceptible to all antimicrobial classes of the harmonised set for Campylobacter; res1–res4: resistance to one up to four antimicrobial classes of the harmonised set for Campylobacter.
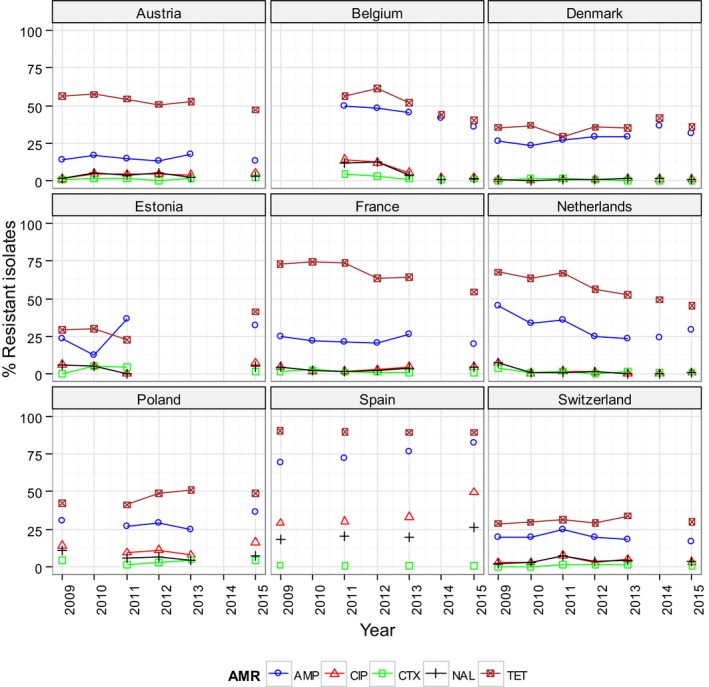
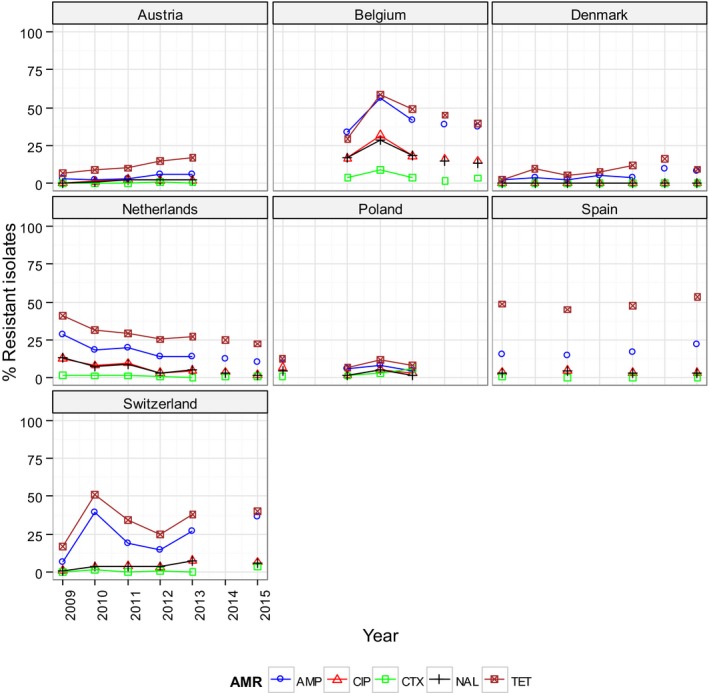
Statistically significance of trends over four/five or more years was tested by a logistic regression model (p ≤ 0.05). Statistically significant increasing trends were observed for ampicillin in Denmark (↑) and Spain (↑), as well as for ciprofloxacin in Poland (↑) and Spain (↑). Statistically significant decreasing trends were observed for ampicillin in Belgium (↓) and the Netherlands (↓), for tetracycline in Austria (↓), Belgium (↓), France (↓) and the Netherlands (↓), as well as for cefotaxime, ciprofloxacin and nalidixic acid in Belgium (↓) and the Netherlands (↓).
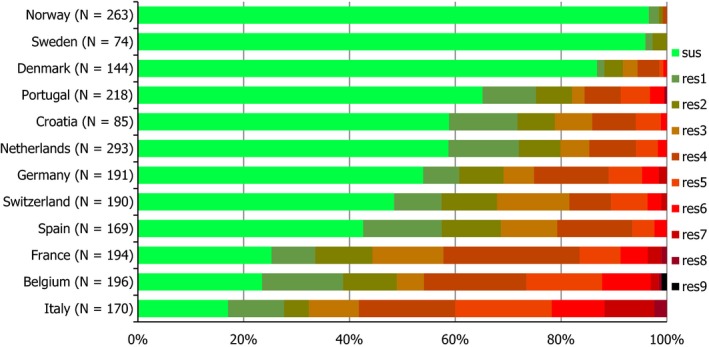
N: total number of isolates tested for susceptibility against the whole harmonised set of antimicrobials for Escherichia coli; sus: susceptible to all antimicrobial classes of the harmonised set for Escherichia coli; res1–res9: resistance to one up to eleven antimicrobial classes of the harmonised set for Escherichia coli.
Statistically significant decreasing trends over four/five or more years, as tested by a logistic regression model (p ≤ 05), Statistically significant increasing trends over five or more years were observed for ampicillin and tetracycline in Austria (↑) and Denmark (↑), for ampicillin, ciprofloxacin, nalidixic acid and cefotaxime in Switzerland (↑) and for cefotaxime in Poland (↑). Statistically significant decreasing trends were observed for ampicillin, ciprofloxacin, cefotaxime, nalidixic acid and tetracycline in Belgium (↓) and the Netherlands (↓), and for ampicillin in Poland (↓).
N: total number of isolates tested for susceptibility against the whole harmonised set of antimicrobials for Escherichia coli; sus: susceptible to all antimicrobial classes of the harmonised set for Escherichia coli; res1‐res9: resistance to one up to eleven antimicrobial classes of the harmonised set for Escherichia coli.
References
-
- Abdallah HM, Reuland EA, Wintermans BB, Al Naiemi N, Koek A, Abdelwahab AM, Ammar AM, Mohamed AA and Vandenbroucke‐Grauls CM, 2015. Extended‐spectrum beta‐lactamases and/or carbapenemases‐producing Enterobacteriaceae isolated from retail chicken meat in Zagazig Egypt. PLoS ONE, 10, e0136052. - PMC - PubMed
-
- Bangerter PD, Sidler X, Perreten V and Overesch G, 2016. Longitudinal study on the colonisation and transmission of methicillin‐resistant Staphylococcus aureus in pig farms. Veterinary Microbiology, 183, 125–134. - PubMed
LinkOut - more resources
Full Text Sources