

Epidemiological analyses on African swine fever in the Baltic countries and Poland
- PMID: 32625438
- PMCID: PMC7010137
- DOI: 10.2903/j.efsa.2017.4732
Epidemiological analyses on African swine fever in the Baltic countries and Poland
Abstract
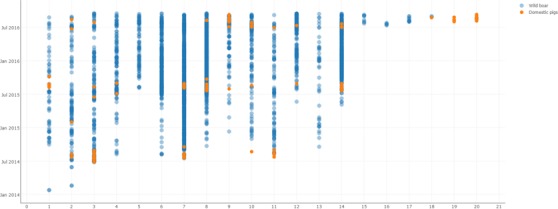
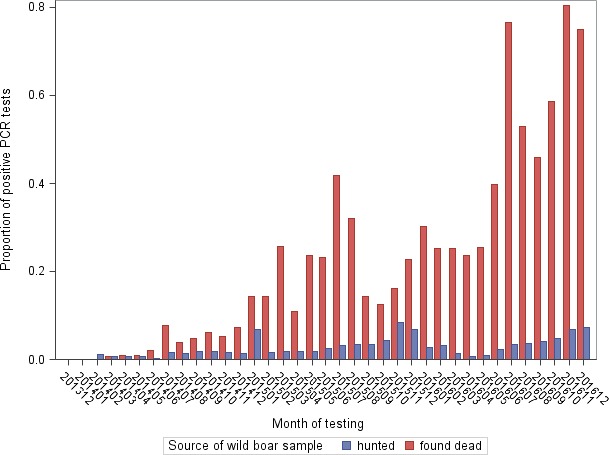
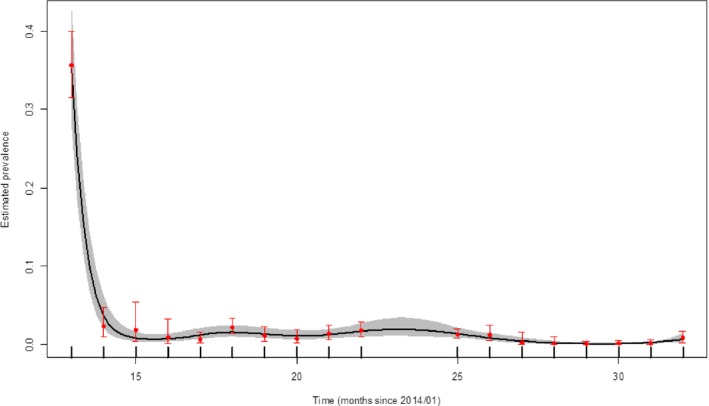
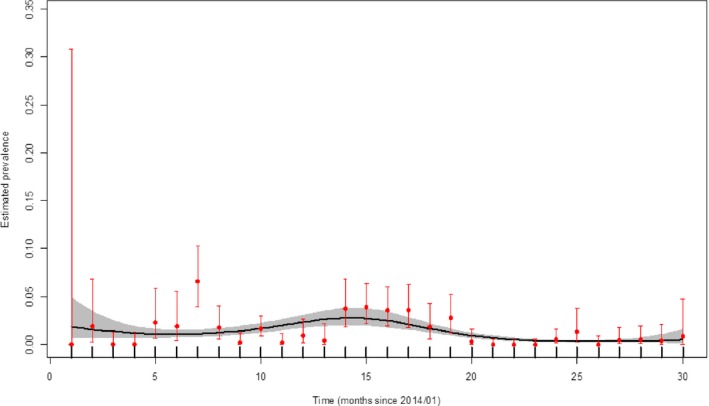
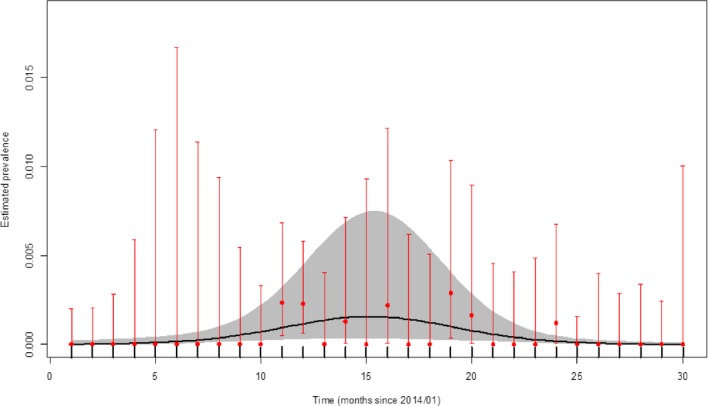
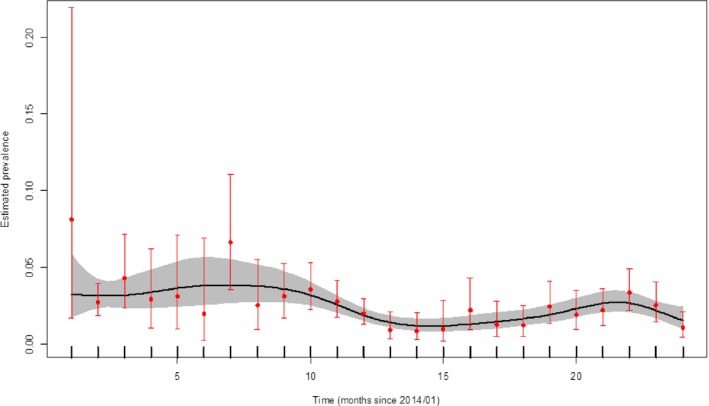
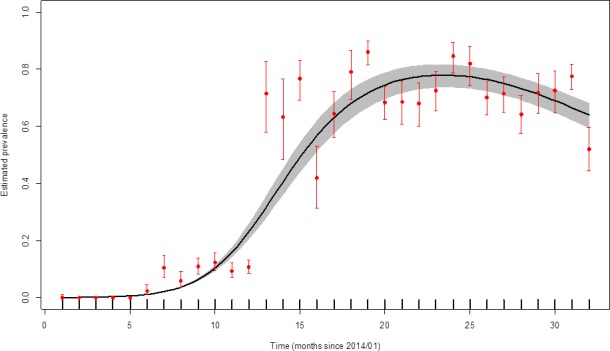
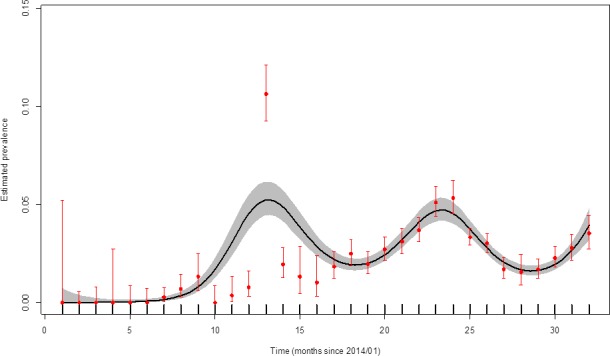
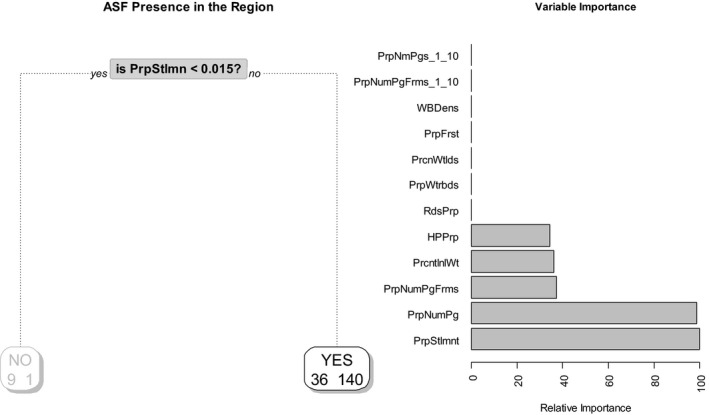
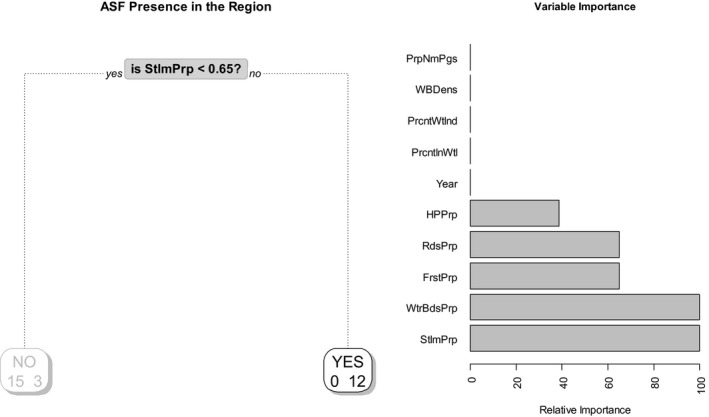
African swine fever virus (ASFV) has been notified in the Baltic countries and the eastern part of Poland from the beginning of 2014 up to now. In collaboration with the ASF-affected Member States (MS), EFSA is updating the epidemiological analysis of ASF in the European Union which was carried out in 2015. For this purpose, the latest epidemiological and laboratory data were analysed in order to identify the spatial-temporal pattern of the epidemic and a risk factors facilitating its spread. Currently, the ASF outbreaks in wild boar in the Baltic countries and Poland can be defined as a small-scale epidemic with a slow average spatial spread in wild boar subpopulations (approximately from 1 in Lithuania and Poland to 2 km/month in Estonia and Latvia). The number of positive samples in hunted wild boar peaks in winter which can be explained by human activity patterns (significant hunting activity over winter). The number of positive samples in wild boar found dead peaks in summer. This could be related to the epidemiology of the disease and/or the biology of wild boar; however, this needs further investigation. Virus prevalence in hunted wild boar is very low (0.04-3%), without any apparent trend over time. Apparent virus prevalence at country level in wild boar found dead in affected countries ranges from 60% to 86%, with the exception of Poland, where values between 0.5% and 1.42%, were observed. Since the beginning of the epidemic, the apparent antibody prevalence in hunted wild boar has always been lower than the apparent virus prevalence, indicating an unchanged epidemiological/immunological situation. The risk factor analysis shows an association between the number of settlements, human and domestic pigs population size or wild boar population density and the presence of ASF in wild boar for Estonia, Latvia and Lithuania.
Keywords: African swine fever; epidemiology; wild boar.
© 2017 European Food Safety Authority. EFSA Journal published by John Wiley and Sons Ltd on behalf of European Food Safety Authority.
Figures
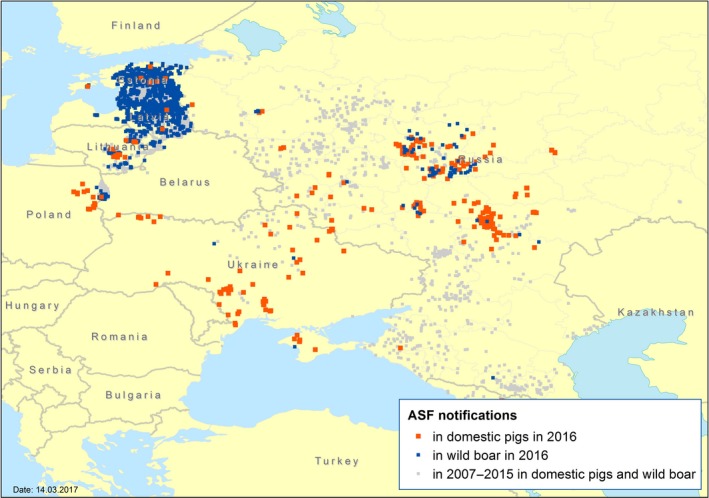
Sources:
ADNS ,WAHIS , Official web site of the Federal Service for Veterinary and Phytosanitary Surveillance of Russia; period covered 1 January 2007–31 August 2016.
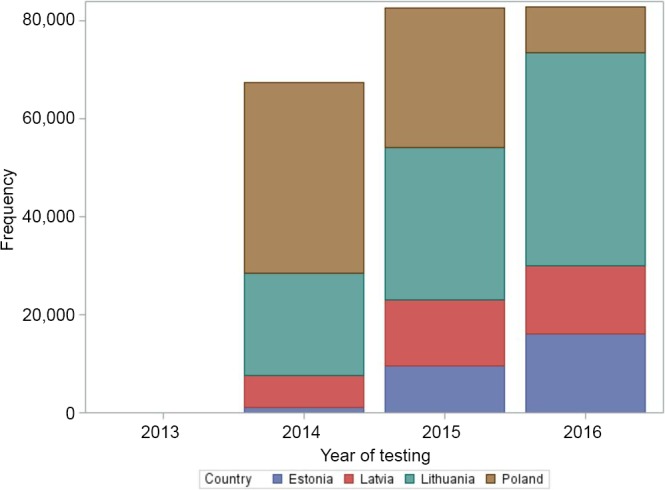

Source:
DCF .

Source:
ADNS .

 Start of active selective hunting of female wild boars and
  removal of dead animals in Latvia;
 Start of active selective hunting of female wild boars and
  removal of dead animals in Estonia;
 Start of active selective hunting of female wild boars and
  removal of dead animals in Lithuania;
 Start of active selective hunting of female wild boars and
  removal of dead animals in Poland (Appendix D).
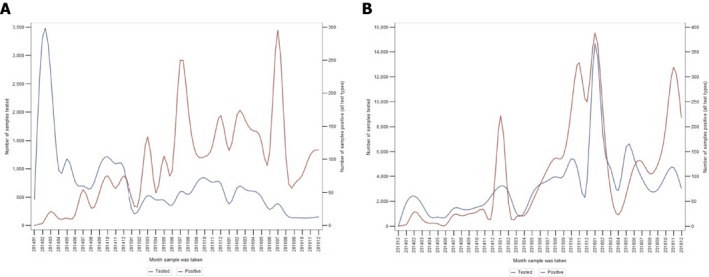
Note that the scales of the tested and the positive hunted wild boar in Figure B are different from the corresponding scales in Figure A.
Source:
DCF .
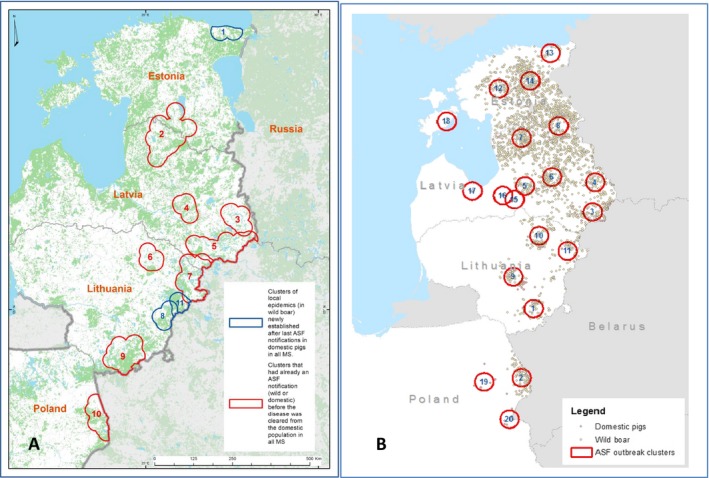
Red clusters: ASF clusters involving wild boar or domestic pigs which were preceded by an outbreak in the domestic pig sector and had a notification before the domestic pig outbreak had been resolved; Blue clusters: ASF clusters which are not preceded by outbreaks in the domestic pig sector and had no notification before the domestic pig outbreak had been resolved.
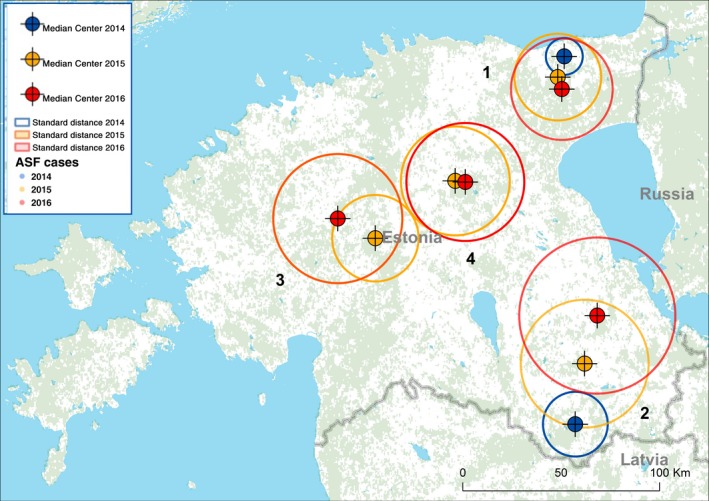
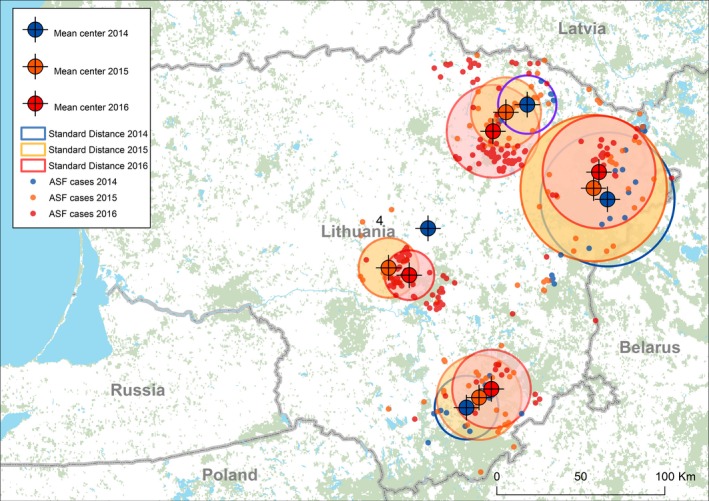
Source:
ADNS .
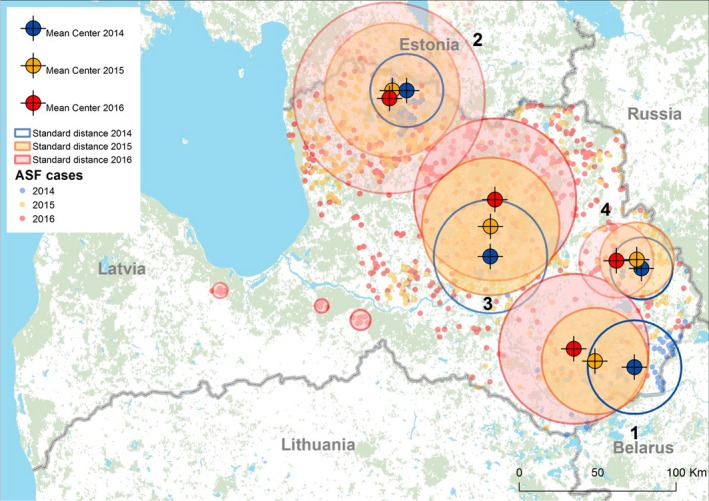
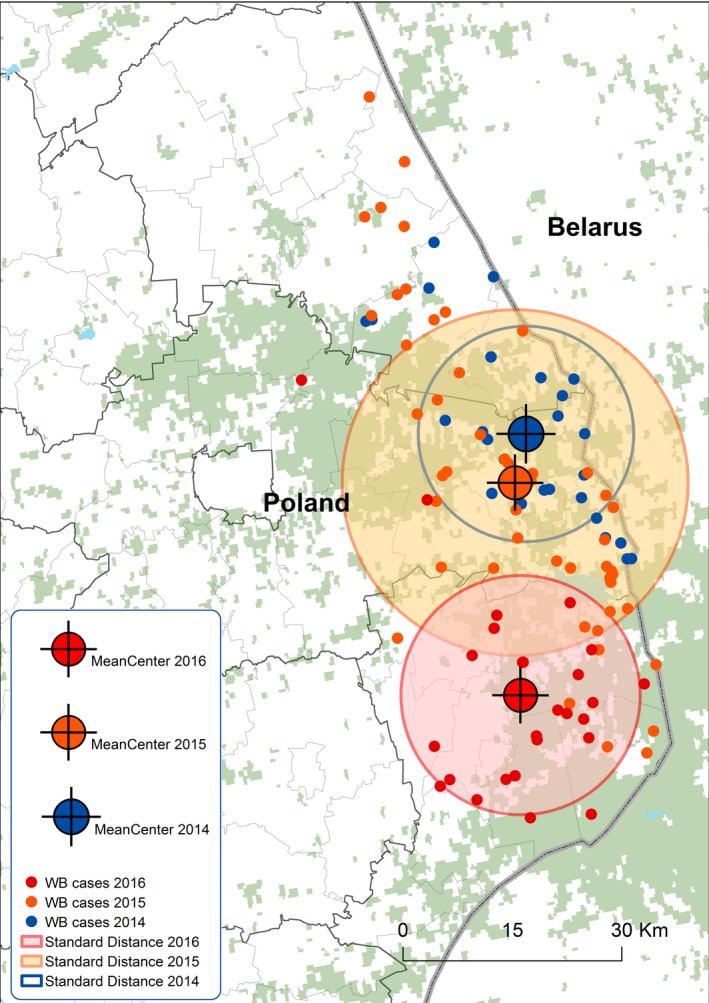
Source:
ADNS .
Source:
ADNS .
Source:
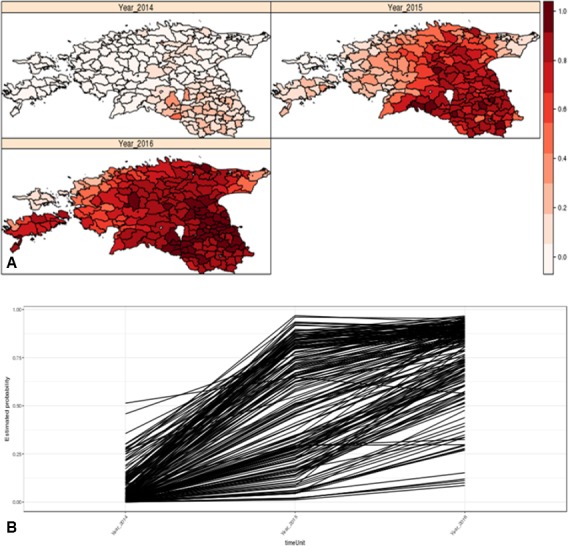
DCF .
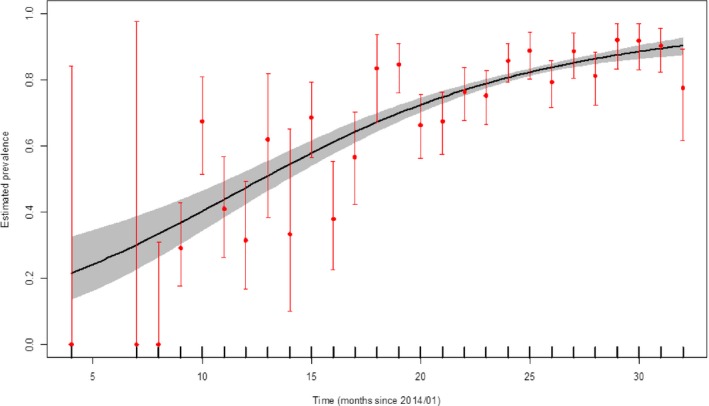
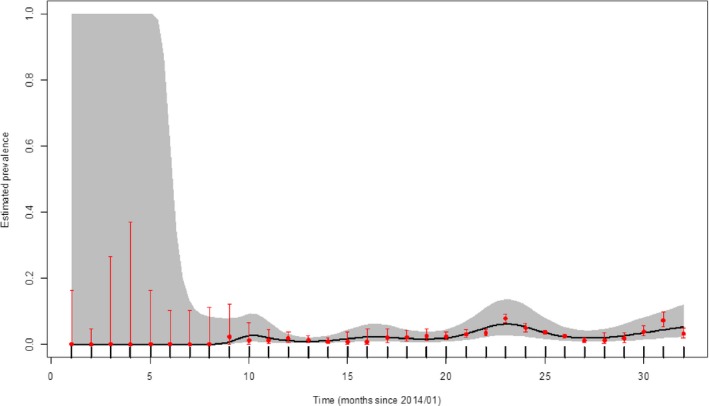
Grey colour: 95% confidence interval (
CI ‐95%).
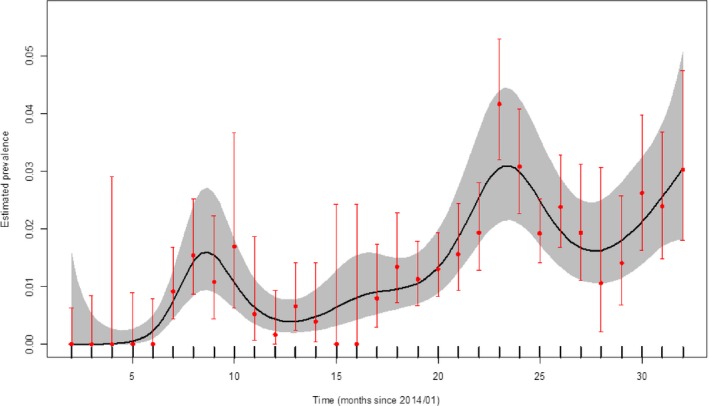
Grey colour: 95% confidence interval (
CI ‐95%).

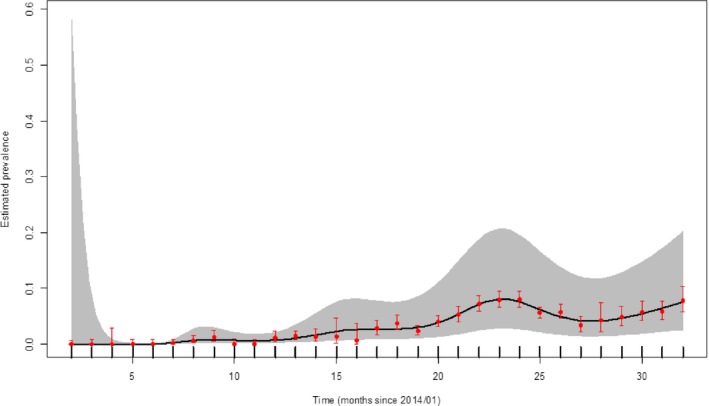
Grey colour: 95% confidence interval (
CI ‐95%).

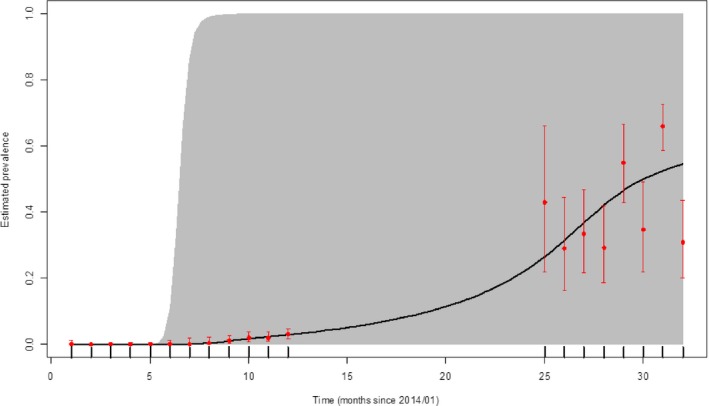
Grey colour: 95% confidence interval (
CI ‐95%).
Grey colour: 95% confidence interval (
CI ‐95%).
Grey colour: 95% confidence interval (
CI ‐95%).
Grey colour: 95% confidence interval (
CI ‐95%).

Grey colour: 95% confidence interval (
CI ‐95%).
Grey colour: 95% confidence interval (
CI ‐95%).Source:
DCF .
Grey colour: 95% confidence interval (
CI ‐95%).
Grey colour: 95% confidence interval (
CI ‐95%).
Grey colour: 95% confidence interval (
CI ‐95%).


Source: Ministry of the environment (Estonia)
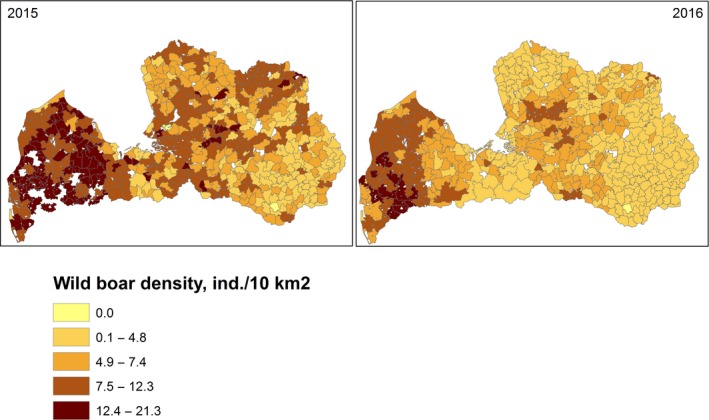
Source: State Forest Service of Latvia
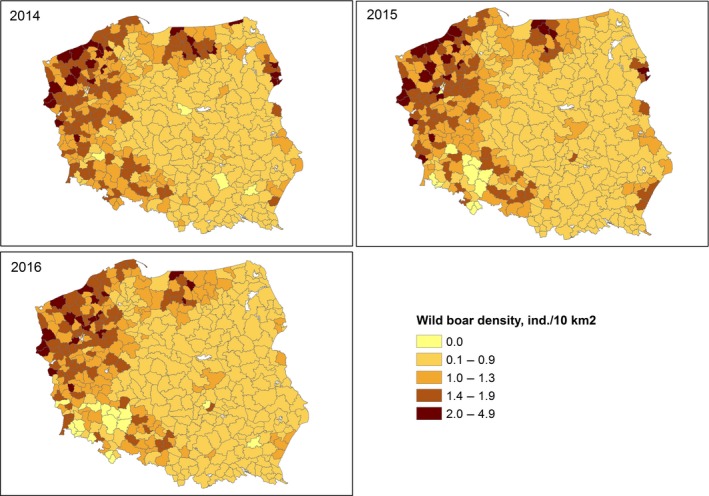
Source: General Directorate of the State Forests (Poland)
References
-
- Breiman L, 2001. Random forests. Machine Learning, 45, 5–32.
-
- Breiman L, Friedman JH, Olshen RA and Stone CJ, 1984. Classification and regression trees. Chapman and Hall, New York: 368 pp.
-
- EEA (European Environment Agency), 2007. CLC2006 technical guidelines. Technical report No 17/2007. ISSN 1725‐4012 2237, 66 pp.
-
- EFSA AHAW Panel (EFSA Panel on Animal Health and Welfare), 2015. Scientific opinion on African swine fever. EFSA Journal 2015;13(7):4163, 92 pp. doi: 10.2903/j.efsa.2015.4163 - DOI
-
- FAO , 2013. African swine fever in the Russian Federation: risk factors for Europe and beyond. EMPRES WATCH, Vol. 28, May 2013. Rome.
LinkOut - more resources
Full Text Sources